
The resource contains 60 sourced observations from eight original publications, plus two supporting chart inputs and 16 reproducible descriptive comparisons. Its contribution is careful source checking, compatible comparisons, clear definitions and four reusable charts. NCFMR’s analyses use Census survey data, so eight publications should not be described as eight independent surveys.
What are the key marriage and divorce findings?
- The U.S. recorded 2,128,446 marriages in 2024, with a crude marriage rate of 6.3 per 1,000 total population. Both are provisional measures. CDC / National Center for Health Statistics.
- CDC’s 2024 count was 662,950 divorces and annulments, covering 45 states and D.C. Five states were excluded. It is not a complete national count. CDC / National Center for Health Statistics.
- The estimated median age at first marriage in 2025 was 30.8 for men and 28.4 for women in the U.S. U.S. Census Bureau.
- Both first-marriage age medians were 7.3 years higher than in 1975. Their rounded group-median difference was 2.4 years in both periods. These are MyLittleDesire calculations from Census estimates, not spouse-pair age gaps. U.S. Census Bureau.
- Married-couple households accounted for 47% of U.S. households in 2025, compared with 66% in 1975. Households and adults are different denominators. U.S. Census Bureau.
- Among first marriages ending in divorce in NCFMR’s 2024 ACS analysis, median duration was 13 years for males and 14 years for females. NCFMR, Bowling Green State University.
- England and Wales recorded 105,002 divorces in 2025; civil partnership dissolutions are counted separately. Office for National Statistics.
- 16.3% of the 2015 marriage cohort in England and Wales divorced before its tenth anniversary, compared with 24.7% of the 1995 cohort. Neither is lifetime divorce risk. Office for National Statistics.
- The median duration of opposite-sex marriages ending in divorce in England and Wales reached 13.0 years in 2025. Office for National Statistics.
- Australia registered 118,804 marriages in 2025, down from 120,844 in 2024. Australian Bureau of Statistics.
- Australia’s detailed divorce table and original workbook report 49,158 divorces in 2025. A conflicting summary figure is disclosed in the methodology below. Australian Bureau of Statistics.
- Statistics Canada’s historical release reports 42,933 divorces in 2020, a pandemic-disrupted year. This figure is retained as dated context, not a current Canadian estimate. Statistics Canada.
How many marriages and divorces do U.S. records show?
The CDC’s selected 2024 records show 2,128,446 marriages and a crude marriage rate of 6.3 per 1,000 total population. The divorce and annulment table covers a smaller reporting area, so the two event counts should not be divided into a national “percentage of marriages ending in divorce.” CDC / National Center for Health Statistics.
| ID | Finding | Value | Data period | Original source |
|---|---|---|---|---|
| M001 | U.S. marriages recorded in 2024 | 2,128,446 marriages | 2024 | CDC / National Center for Health Statistics |
| M002 | U.S. crude marriage rate in 2024 | 6.3 per 1,000 total population | 2024 | CDC / National Center for Health Statistics |
| M003 | Reported divorces and annulments in 2024 | 662,950 divorces and annulments | 2024 | CDC / National Center for Health Statistics |
| M004 | Crude divorce and annulment rate in the reporting area | 2.3 per 1,000 total population | 2024 | CDC / National Center for Health Statistics |
| M005 | U.S. marriages recorded in 2019 | 2,015,603 marriages | 2019 | CDC / National Center for Health Statistics |
| M006 | U.S. crude marriage rate in 2019 | 6.1 per 1,000 total population | 2019 | CDC / National Center for Health Statistics |
| M007 | U.S. marriages recorded in 2020 | 1,676,911 marriages | 2020 | CDC / National Center for Health Statistics |
| M008 | U.S. crude marriage rate in 2020 | 5.1 per 1,000 total population | 2020 | CDC / National Center for Health Statistics |
The divorce table excludes California, Hawaii, Indiana, Minnesota and New Mexico in 2024. Its rate is calculated using the population of the reporting area. The marriage table covers the U.S. more broadly. Even with matched coverage, one year’s new marriages and one year’s divorces concern different marriage cohorts. CDC / National Center for Health Statistics.
Original comparison: count recovery and population-rate recovery are different. From 2019 to 2024, the marriage count increased by 112,843, or 5.6%, while the published crude rate increased by 0.2 per 1,000, or about 3.3%. The count reflects the number of events; the rate also accounts for the population denominator. These calculations use rounded published rates and do not constitute a causal decomposition. CDC / National Center for Health Statistics.
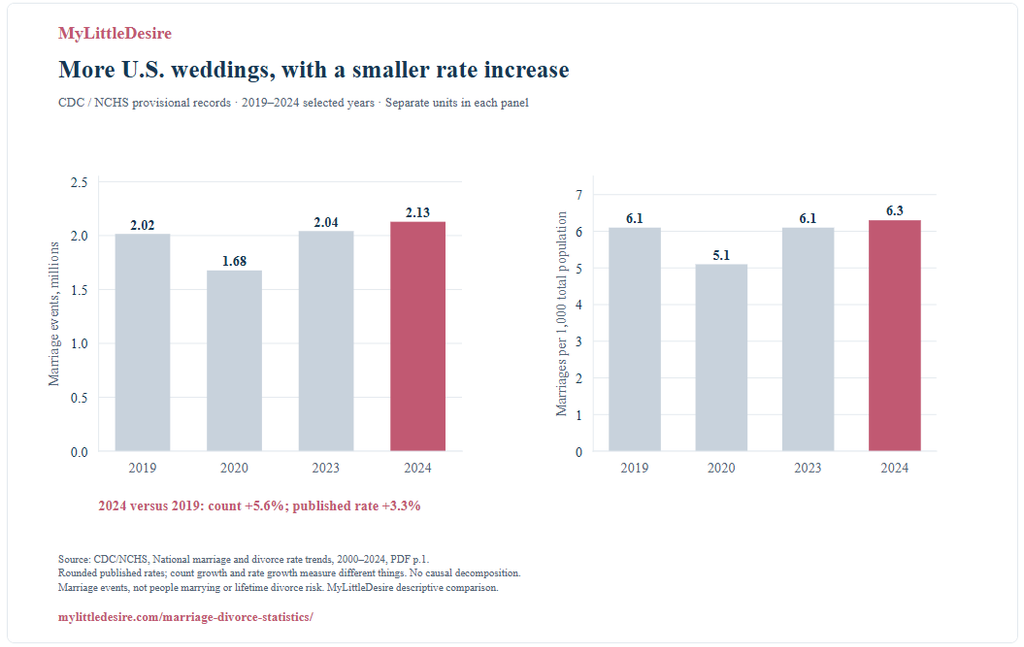
The chart also uses two supporting CDC observations recorded outside the main 60-row selection: 2,041,926 marriages and 6.1 per 1,000 total population in 2023. They remain traceable in the supporting-input CSV. Pandemic-era observations show disruption in registrations and ceremonies; a later recovery cannot by itself establish stronger relationships or lower lifetime divorce risk. CDC / National Center for Health Statistics.
What changed about first-marriage ages and households?
U.S. estimated first-marriage ages moved later for both men and women between 1975 and 2025. Men’s median rose from 23.5 to 30.8; women’s rose from 21.1 to 28.4. Each difference is 7.3 years. U.S. Census Bureau.
| ID | Finding | Value | Data period | Original source |
|---|---|---|---|---|
| M009 | Estimated median age at first marriage, men | 30.8 years | 2025 | U.S. Census Bureau |
| M010 | Estimated median age at first marriage, women | 28.4 years | 2025 | U.S. Census Bureau |
| M011 | Estimated median age at first marriage, men | 23.5 years | 1975 | U.S. Census Bureau |
| M012 | Estimated median age at first marriage, women | 21.1 years | 1975 | U.S. Census Bureau |
| M013 | Households that were married-couple households | 47% | 2025 | U.S. Census Bureau |
| M014 | Households that were married-couple households | 66% | 1975 | U.S. Census Bureau |
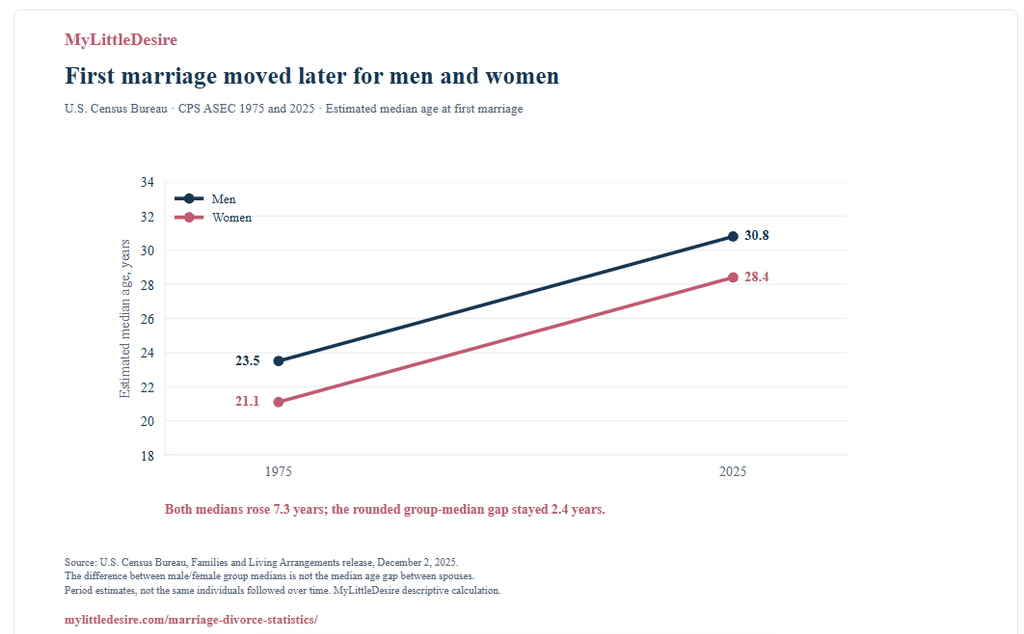
A useful synthesis is that later marriage did not widen this particular rounded group-median gap. Subtracting the women’s estimate from the men’s gives 2.4 years in both 1975 and 2025. This is a comparison of population-level medians. It does not measure the typical age difference between spouses, and it does not mean every subgroup followed the same path. U.S. Census Bureau.
The household figures answer a separate question. Married-couple households declined from 66% to 47% of households, a 19-percentage-point difference. A household can contain more than one adult, so this cannot be rewritten as the percentage of Americans who are married or unmarried. Census conducted significance testing for its published comparisons; no additional uncertainty test was performed for the new derived gap comparison. U.S. Census Bureau.
How long did first marriages last among people who divorced?
In NCFMR’s 2024 ACS analysis, the median duration at first divorce was 13 years for males and 14 years for females. This describes a selected population: people whose first marriages ended in divorce in the analyzed data. It does not give the expected length of a new marriage or the duration of all current marriages. NCFMR, Bowling Green State University.
| ID | Finding | Value | Data period | Original source |
|---|---|---|---|---|
| M015 | Median first-marriage duration at first divorce, males | 13 years | 2024 | NCFMR, Bowling Green State University |
| M016 | Median first-marriage duration at first divorce, females | 14 years | 2024 | NCFMR, Bowling Green State University |
| M017 | Median first-marriage duration at first divorce, males | 11 years | 2008 | NCFMR, Bowling Green State University |
| M018 | Median first-marriage duration at first divorce, females | 11 years | 2008 | NCFMR, Bowling Green State University |
| M019 | Median duration at first divorce, females with high school/GED or less | 17 years | 2024 | NCFMR, Bowling Green State University |
| M020 | Median duration at first divorce, females with some college | 11 years | 2024 | NCFMR, Bowling Green State University |
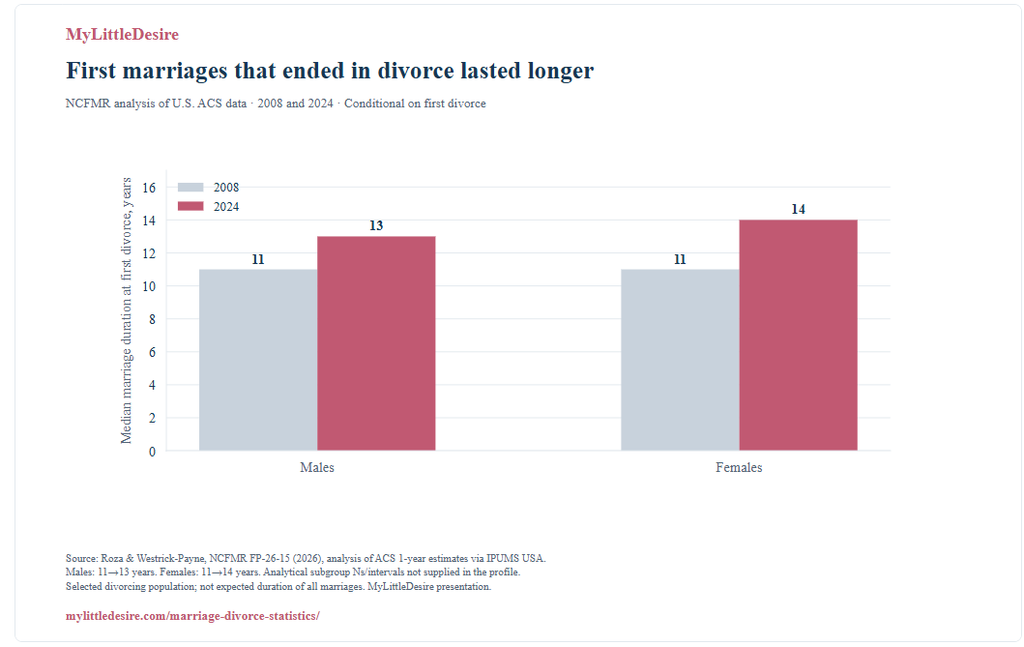
Compared with 2008, median duration rose two years for males and three years for females. The profile also shows variation by education: the selected female high-school/GED-or-less group had a median of 17 years, compared with 11 years for the some-college group in 2024. These conditional duration estimates cannot establish which education group has a higher probability of divorce. The study does not supply achieved subgroup Ns or intervals for the selected medians. NCFMR, Bowling Green State University.
Why do U.S. divorce rates look so different across sources?
Different divorce measures use different numerators, denominators and observation windows. CDC’s 2.3 per 1,000 total population in its 2024 reporting area and NCFMR’s 14.2 per 1,000 married women ages 15+ from the 2024 ACS answer different questions. They are not conflicting estimates of the same probability. CDC / National Center for Health Statistics; NCFMR, Bowling Green State University.
| ID | Finding | Value | Data period | Original source |
|---|---|---|---|---|
| M021 | Women’s refined divorce rate | 14.2 per 1,000 married women ages 15+ | 2024 | NCFMR, Bowling Green State University |
| M022 | Estimated women reporting divorce in the preceding 12 months | 986,810 women | 2024 ACS interviews / preceding 12 months | NCFMR, Bowling Green State University |
| Measure | What it describes | Why it needs its own label |
|---|---|---|
| Crude event rate | Annual legal events divided by the relevant population | Population may include children or use an age cutoff; reporting geography can differ. |
| Refined divorce rate | Divorce relative to an eligible married population | Keep sex, age, numerator definition and survey window attached. |
| Marriage-cohort proportion | Share of a marriage cohort divorced before a stated anniversary | A ten-year cumulative proportion is not lifetime risk. |
| Currently divorced share | Population’s marital-status composition at interview | It is a stock of people, rather than an annual count of new divorces. |
| Duration at divorce | Time married among marriages that ended in divorce | It is conditional on divorce and does not describe all marriages. |
NCFMR’s 2024 women’s refined-rate estimate carries a reported 90% margin of error of ±0.32 per 1,000. Its estimated 986,810 women reporting a divorce are weighted people, not a count of court decrees. The ACS asks about the preceding twelve months across interviews; the CDC tables use calendar-year administrative records and different geographic coverage. NCFMR, Bowling Green State University; CDC / National Center for Health Statistics.
This source inventory does not establish a universal current “half of all marriages” probability. A defensible estimate needs a clearly defined country, marriage cohort, marriage order, anniversary window and method. Dividing annual divorces by annual marriages cannot provide it.
What proportion divorced within ten years in England and Wales?
ONS estimates that 16.3% of couples who married in 2015 divorced before their tenth anniversary. The corresponding published estimates were 24.7% for the 1995 marriage cohort and 9.9% for the 1965 cohort. All three use the same anniversary window. Office for National Statistics.
| ID | Finding | Value | Data period | Original source |
|---|---|---|---|---|
| M029 | Marriages ending in divorce before the 10th anniversary, 1965 cohort | 9.9% | Married in 1965; before 10th anniversary | Office for National Statistics |
| M030 | Marriages ending in divorce before the 10th anniversary, 1995 cohort | 24.7% | Married in 1995; before 10th anniversary | Office for National Statistics |
| M031 | Marriages ending in divorce before the 10th anniversary, 2015 cohort | 16.3% | Married in 2015; before 10th anniversary | Office for National Statistics |
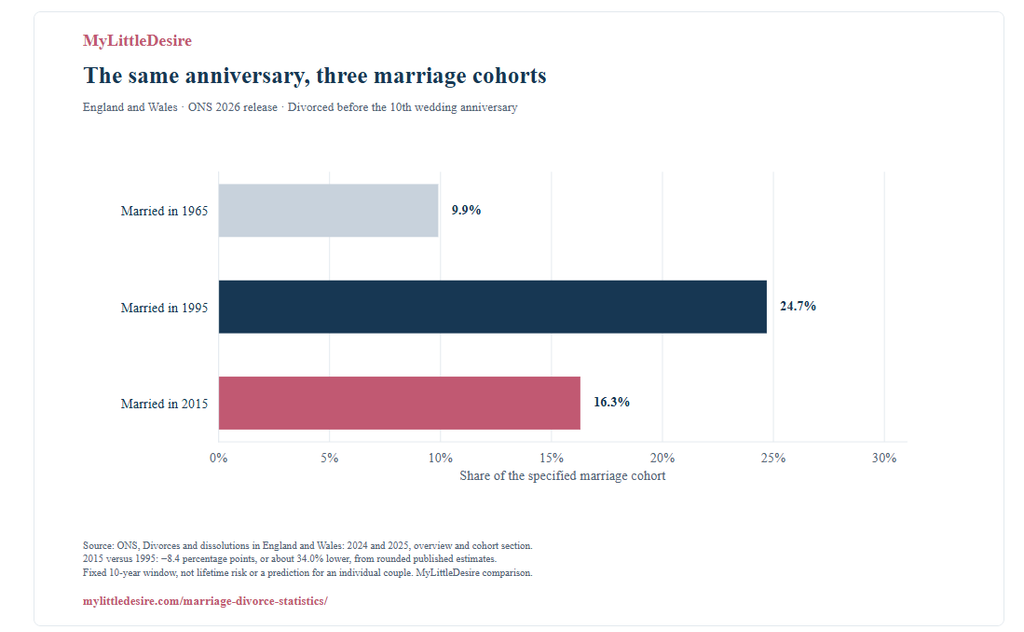
Original calculation: the 2015 cohort’s ten-year divorce proportion was 8.4 percentage points below the 1995 cohort’s, or about 34.0% lower relative to 24.7%. ONS already discusses the cohort contrast; MyLittleDesire supplies explicit arithmetic, the fixed-window chart and a reusable input trail. This is descriptive synthesis, not a new scientific discovery or a forecast for today’s newlyweds. Office for National Statistics.
What do the latest England-and-Wales divorce records show?
England and Wales recorded 105,002 divorces in 2025, comprising 102,879 opposite-sex and 2,123 same-sex divorces. Including 959 civil partnership dissolutions brings the broader legal-partnership total to 105,961. Civil partnership dissolutions should not be silently added to a number labeled “marriage divorces.” Office for National Statistics.
| ID | Finding | Value | Data period | Original source |
|---|---|---|---|---|
| M023 | Divorces granted in England and Wales | 105,002 divorces | 2025 | Office for National Statistics |
| M024 | Opposite-sex divorces granted | 102,879 divorces | 2025 | Office for National Statistics |
| M025 | Same-sex divorces granted | 2,123 divorces | 2025 | Office for National Statistics |
| M026 | Opposite-sex divorce rate | 8.4 per 1,000 opposite-sex married people | 2025 | Office for National Statistics |
| M027 | Same-sex divorce rate | 19.5 per 1,000 same-sex married people | 2025 | Office for National Statistics |
| M028 | Median duration of opposite-sex marriages ending in divorce | 13 years | 2025 | Office for National Statistics |
| M032 | New-law divorce final orders arising from sole applications | 74.3% | 2025 | Office for National Statistics |
| M033 | All legal partnership dissolutions granted | 105,961 dissolutions | 2025 | Office for National Statistics |
| M034 | Civil partnership dissolutions granted | 959 civil partnership dissolutions | 2025 | Office for National Statistics |
The September 2026 release changes the rate methodology to use the corresponding opposite-sex or same-sex married population, with the new method applied to the back series. The same-sex population estimates have greater sampling variability. Differences in marriage duration and population composition also matter; the two rates should not be presented as a causal explanation of relationship stability. Office for National Statistics.
Among divorce final orders granted under the new legislation in 2025, 74.3% arose from sole applications. That is an application-type measure. It is not the share initiated by women, the share involving conflict or the proportion of every marriage that ends in divorce. Court-processing timing and the introduction of the new legal process can affect annual counts. Office for National Statistics.
What do England-and-Wales marriage records show?
The latest marriage bulletin selected for this edition covers 2023 and was released in November 2025. It reports 231,949 marriages and civil partnerships combined. The label matters: this is a total of legal partnership formations, not marriages alone. Office for National Statistics.
| ID | Finding | Value | Data period | Original source |
|---|---|---|---|---|
| M035 | Marriages and civil partnerships formed | 231,949 legal partnership formations | 2023 | Office for National Statistics |
| M036 | Opposite-sex marriages formed | 216,901 marriages | 2023 | Office for National Statistics |
| M037 | Median age of men entering opposite-sex marriage | 34.8 years | 2023 | Office for National Statistics |
| M038 | Median age of women entering opposite-sex marriage | 33 years | 2023 | Office for National Statistics |
| M039 | Opposite-sex marriage rate for men | 18.1 per 1,000 unmarried men | 2023 | Office for National Statistics |
| M040 | Opposite-sex marriage rate for women | 16.4 per 1,000 unmarried women | 2023 | Office for National Statistics |
| M041 | Marriages occurring in August | 14.3% | 2023 | Office for National Statistics |
| M042 | Marriages occurring on a Saturday | 41.9% | 2023 | Office for National Statistics |
Opposite-sex marriage ages in this bulletin include remarriages. Their medians of 34.8 for men and 33.0 for women should therefore not be ranked against the U.S. estimates of age at first marriage. Likewise, ONS marriage rates use unmarried people as denominators, unlike CDC’s total-population crude rate. Office for National Statistics; U.S. Census Bureau; CDC / National Center for Health Statistics.
Timing statistics can support wedding and lifestyle coverage. August accounted for 14.3% of marriages, and Saturdays for 41.9% in the ONS 2023 occurrence calendar. Keep the jurisdiction and year attached, rather than turning these into a universal best day or a 2027 forecast. Office for National Statistics.
What changed in Australian marriage and divorce records?
Australia registered 118,804 marriages in 2025, compared with 120,844 in 2024, a calculated decline of about 1.7%. Its detailed divorce table reports 49,158 divorces, up from 47,216, or about 4.1%. Those changes describe separate sets of annual events; they do not show that the new marriages were the ones ending in divorce. Australian Bureau of Statistics.
| ID | Finding | Value | Data period | Original source |
|---|---|---|---|---|
| M043 | Marriages registered in Australia | 118,804 marriages | 2025 | Australian Bureau of Statistics |
| M044 | Marriages registered in Australia | 120,844 marriages | 2024 | Australian Bureau of Statistics |
| M045 | Crude marriage rate | 5.3 per 1,000 population ages 16+ | 2025 | Australian Bureau of Statistics |
| M046 | Crude marriage rate | 5.5 per 1,000 population ages 16+ | 2024 | Australian Bureau of Statistics |
| M047 | Divorces granted in Australia | 49,158 divorces | 2025 | Australian Bureau of Statistics |
| M048 | Divorces granted in Australia | 47,216 divorces | 2024 | Australian Bureau of Statistics |
| M049 | Crude divorce rate | 2.2 per 1,000 population ages 16+ | 2025 | Australian Bureau of Statistics |
| M050 | Crude divorce rate | 2.1 per 1,000 population ages 16+ | 2024 | Australian Bureau of Statistics |
| M051 | Median marriage duration to divorce | 13.4 years | 2025 | Australian Bureau of Statistics |
| M052 | Median marriage duration to separation | 9.4 years | 2025 | Australian Bureau of Statistics |
| M053 | Median age at divorce, males | 47.3 years | 2025 | Australian Bureau of Statistics |
| M054 | Median age at divorce, females | 44.4 years | 2025 | Australian Bureau of Statistics |
ABS defines its crude marriage and divorce rates per 1,000 estimated residents aged 16 and over. CDC’s crude rates use total population, while the selected ONS divorce rates use married people. A single country-ranking chart using those values would combine incompatible denominators. Australian Bureau of Statistics; CDC / National Center for Health Statistics; Office for National Statistics.
For marriages ending in divorce in Australia in 2025, median duration to divorce was 13.4 years and median duration to separation was 9.4 years. Subtracting the two medians does not reveal the median divorce-processing interval. That would require calculating the interval within each case and then taking its median. The age and duration statistics describe the divorcing population, rather than the expected outcome for every marriage. Australian Bureau of Statistics.
Source discrepancy: the release summary says 49,148 divorces in 2025. The detailed divorce text, chart, selected-indicator table and downloadable workbook Table 3, cell G6, agree on 49,158. This resource uses that corroborated table value. The original ABS workbook is available for checking. The summary discrepancy remains disclosed; no unpublished correction is claimed.
What can the historical Canadian figures tell us?
The consulted Statistics Canada national divorce table ends in 2020. Its historical analysis reports 42,933 divorces in 2020, compared with 56,937 in 2019. The calculated decline was about 24.6%. These are historical pandemic-era findings, not measured 2027 Canadian outcomes. Statistics Canada.
| ID | Finding | Value | Data period | Original source |
|---|---|---|---|---|
| M055 | Divorces granted in Canada | 42,933 divorces | 2020 | Statistics Canada |
| M056 | Divorces granted in Canada | 56,937 divorces | 2019 | Statistics Canada |
| M057 | Divorce rate among married persons | 5.6 per 1,000 married persons | 2020 | Statistics Canada |
| M058 | Divorce rate among married persons | 7.5 per 1,000 married persons | 2019 | Statistics Canada |
| M059 | Mean duration of marriages ending in divorce | 15.3 years | 2020 | Statistics Canada |
| M060 | Divorces resulting from a joint application | 31% | 2020 | Statistics Canada |
Statistics Canada explains that barriers to court access likely contributed to the decline. A decrease in granted divorces does not necessarily mean an equivalent decrease in relationship breakdowns. Divorce records also omit marital separations and dissolved common-law unions. The published duration of 15.3 years is a mean, so it should not be directly compared with the median durations in the U.S., England-and-Wales or Australian sections. Statistics Canada.
The reported 31% joint-application share describes a legal filing arrangement in 2020. It does not establish that those divorces were conflict-free. A website modification date or a new summary referencing this series does not update the observation year. Statistics Canada.
How were the comparisons calculated?
The following calculations use published source inputs. Percent change means change relative to the starting value; percentage-point change means subtraction of two percentages. No new statistical significance or causal analysis was conducted. Several source contrasts were already discussed by their original researchers.
| ID | Comparison | Result | Calculation | Interpretation and original sources |
|---|---|---|---|---|
| C01 | U.S. marriage-count increase, 2019 to 2024 | 112,843 marriages | 2128446-2015603 | Provisional counts; total events differ from per-person rate. Sources: CDC / National Center for Health Statistics |
| C02 | U.S. marriage-count growth, 2019 to 2024 | 5.6% | (2128446/2015603-1)*100 | Count growth, not an increase in the proportion of adults married. Sources: CDC / National Center for Health Statistics |
| C03 | U.S. crude marriage-rate change, 2019 to 2024 | 0.2 per 1,000 total population | 6.3-6.1 | Difference between rounded published rates; not percentage points of adults. Sources: CDC / National Center for Health Statistics |
| C04 | U.S. crude marriage-rate growth, 2019 to 2024 | 3.3% | (6.3/6.1-1)*100 | Uses rounded published rates; compare conceptually with count growth, not a causal decomposition. Sources: CDC / National Center for Health Statistics |
| C05 | Men’s estimated first-marriage age change, 1975 to 2025 | 7.3 years | 30.8-23.5 | Difference in estimated period medians; not the life-course change of the same men. Sources: U.S. Census Bureau |
| C06 | Women’s estimated first-marriage age change, 1975 to 2025 | 7.3 years | 28.4-21.1 | Difference in estimated period medians; no new significance test calculated. Sources: U.S. Census Bureau |
| C07 | Men–women median first-marriage age gap in 1975 | 2.4 years | 23.5-21.1 | Difference in group medians, not the median age gap between spouses. Sources: U.S. Census Bureau |
| C08 | Men–women median first-marriage age gap in 2025 | 2.4 years | 30.8-28.4 | Same rounded gap as 1975; not evidence every age group or couple has the same gap. Sources: U.S. Census Bureau |
| C09 | Married-couple household share change, 1975 to 2025 | -19 percentage points | 47-66 | Household composition measure; not the change in adults’ marriage prevalence. Sources: U.S. Census Bureau |
| C10 | Male median first-marriage duration at first divorce, 2008 to 2024 | 2 years | 13-11 | Selected divorcing population; not the expected length of a newly formed marriage. Sources: NCFMR, Bowling Green State University |
| C11 | Female median first-marriage duration at first divorce, 2008 to 2024 | 3 years | 14-11 | Selected divorcing population; education/age/cohort composition can differ. Sources: NCFMR, Bowling Green State University |
| C12 | 10-year divorce proportion: 2015 versus 1995 marriage cohort | -8.4 percentage points | 16.3-24.7 | England and Wales; fixed anniversary window. Not a lifetime divorce-risk estimate. Sources: Office for National Statistics |
| C13 | Relative change in 10-year divorce proportion, 1995 to 2015 cohorts | -34% | (16.3/24.7-1)*100 | From rounded ONS cohort estimates; descriptive, not age-adjusted or causal. Sources: Office for National Statistics |
| C14 | Australian marriage-registration change, 2024 to 2025 | -1.7% | (118804/120844-1)*100 | Registrations, not occurrence-date counts or shares of all adults. Sources: Australian Bureau of Statistics |
| C15 | Australian divorce-count change, 2024 to 2025 | 4.1% | (49158/47216-1)*100 | Uses official Table 3 value 49,158; summary’s 49,148 discrepancy disclosed. Sources: Australian Bureau of Statistics |
| C16 | Canadian divorce-count change, 2019 to 2020 | -24.6% | (42933/56937-1)*100 | Historical pandemic-era comparison; court-access disruption limits interpretation. Sources: Statistics Canada |
How was this resource researched and checked?
We selected official vital-statistics publications, original government survey summaries and original NCFMR analyses of Census data. The database records each observation’s value, units, population, geography, data year, publication date, original URL, source locator, methodology, uncertainty where supplied and caveats. Two supporting inputs and 16 derived calculations are separated from the main 60 observations.
| Original publication | Selected observations | Share of main database |
|---|---|---|
| Provisional number of marriages, divorces and annulments and rates: United States, 2000–2024 | 8 | 13.3% |
| Census Bureau Releases New Estimates on America’s Families and Living Arrangements | 6 | 10.0% |
| Duration of Marriage at First Divorce, 2008–2024 (FP-26-15) | 6 | 10.0% |
| Charting Marriage & Divorce in the U.S.: The Refined Divorce Rate, 2008–2024 | 2 | 3.3% |
| Divorces and dissolutions in England and Wales: 2024 and 2025 | 12 | 20.0% |
| Marriages and civil partnerships in England and Wales: 2023 | 8 | 13.3% |
| Marriages and Divorces, Australia, 2025 | 12 | 20.0% |
| A fifty-year look at divorces in Canada, 1970 to 2020 | 6 | 10.0% |
The eight publications come from six publishing institutions: CDC/NCHS, the U.S. Census Bureau, NCFMR at Bowling Green State University, ONS, ABS and Statistics Canada. They do not represent eight independent data collections. NCFMR reanalyzes Census ACS data, and multiple government releases can use related administrative systems. The largest single publication supplies 12 of the 60 observations; the combined ONS publications supply 20.
- Publication year, observation year and source-review date remain separate. This is a 2027 planning edition checked in October 2026; no measured 2027 outcomes or MyLittleDesire forecast are included.
- Event counts, weighted person estimates, annual rates, marital-status shares, cohort proportions and conditional durations are kept distinct.
- Rates retain their reporting geography, age cutoff and marital-status denominator. No pooled international rate or incompatible country ranking was produced.
- Administrative records do not have a survey sample N. Achieved analytical Ns and intervals not provided in consulted summaries remain unknown, rather than being replaced with a program’s nominal sample target.
- Original conflicting values are disclosed. For Australia, the original downloadable table corroborates the selected count. NCFMR’s 2023 refined-rate discrepancy is excluded from trend comparisons.
- Pandemic effects, court backlogs, registration timing, methodology changes and legal changes can influence annual event series. They are not automatically changes in the probability of relationship breakdown.
- The chart designs and arithmetic are MyLittleDesire’s synthesis. The underlying records and research belong to their original publishers; this is not original survey fieldwork.
The source inventory does not verify a general current percentage for divorce caused by infidelity, a universal lifetime failure rate, or individual predictions based on communication, education or occupation. Those claims require different research designs. Missing evidence has not been filled with attractive but unsupported figures.
Complete original sources
Provisional number of marriages, divorces and annulments and rates: United States, 2000–2024 — CDC / National Center for Health Statistics. Published: Publication date not displayed in consulted PDF; 2000–2024 edition. Data: Annual records through 2024; selected years 2019, 2020 and 2024. Original source.
Census Bureau Releases New Estimates on America’s Families and Living Arrangements — U.S. Census Bureau. Published: 2025-12-02. Data: CPS ASEC 1975 and 2025. Original source.
Duration of Marriage at First Divorce, 2008–2024 (FP-26-15) — NCFMR, Bowling Green State University; Sara C. Roza and Krista K. Westrick-Payne. Published: 2026; page displays updated September 10, 2026. Data: ACS 1-year estimates, 2008–2024; selected endpoints 2008 and 2024. Original source.
Charting Marriage & Divorce in the U.S.: The Refined Divorce Rate, 2008–2024 — NCFMR, Bowling Green State University; Krista K. Westrick-Payne. Published: 2025; exact publication day not established. Data: 2024 ACS 1-year estimates for selected findings. Original source.
Divorces and dissolutions in England and Wales: 2024 and 2025 — Office for National Statistics. Published: 2026-09-23. Data: 2025 final orders; historical marriage cohorts followed to fixed anniversaries. Original source.
Marriages and civil partnerships in England and Wales: 2023 — Office for National Statistics. Published: 2025-11-18; corrected chart year labels later that day. Data: 2023 registrations and occurrences as defined in bulletin. Original source.
Marriages and Divorces, Australia, 2025 — Australian Bureau of Statistics. Published: 2026-07-28. Data: 2024 and 2025 administrative records. Original source.
A fifty-year look at divorces in Canada, 1970 to 2020 — Statistics Canada. Published: 2022-03-09; archived historical analysis. Data: Selected 2019–2020 annual records. Original source.
Additional verification: ABS original 2025 workbook; Statistics Canada national divorce table.
How should this page be cited?
Suggested citation after publication: MyLittleDesire. “Marriage & Divorce Statistics 2027: Rates, Trends and Comparisons.” 2027 planning edition. https://mylittledesire.com/marriage-divorce-statistics/ Accessed [your access date]. When using a comparison, identify it as MyLittleDesire’s descriptive analysis of the named original data. Readers verifying an underlying survey, court series or cohort estimate should consult and cite the original researcher as well.