Mother’s Day statistics describe several sides of the occasion: planned gifts and spending, what mothers would like, how families celebrate and what happens on restaurant-booking platforms. Their meaning depends on who was asked, which country they were in and whether the number describes an intention or an observation.
This resource brings together 60 grouped findings from 16 numeric research-source records, plus a calendar reference. It includes four charts and 24 reproducible descriptive calculations. The studies come from seven publisher/pollster families; they are not 60 independent studies or 16 wholly independent institutions. Related response categories remain grouped.
When is Mother’s Day in 2027?
Mother’s Day falls on Sunday, May 9, 2027 in the United States, Canada and Australia. UK Mothering Sunday falls on Sunday, March 7, 2027. These known calendar dates are separate from future consumer behavior. Country calendars [S17].
| Market | 2027 date | Calendar source |
|---|---|---|
| United States | Sunday, May 9, 2027 | Country observance calendar |
| Canada | Sunday, May 9, 2027 | Country observance calendar |
| Australia | Sunday, May 9, 2027 | Country observance calendar |
| United Kingdom: Mothering Sunday | Sunday, March 7, 2027 | Country observance calendar |
What are the most useful Mother’s Day findings?
US$38.0bn
US$284.25
NRF’s projected US Mother’s Day spending for 2026; a survey-based plan, not audited retail sales. NRF / Prosper Insights & Analytics [S01]
NRF’s average planned 2026 budget per Mother’s Day celebrant, covering gifts and celebrations. NRF / Prosper Insights & Analytics [S01]
US$10.1bn
US$59.66 → US$57.67
Mother’s Day minus Father’s Day projected total spending in both 2025 and 2026, at published precision (C05–C07). NRF / Prosper Insights & Analytics [S01], NRF / Prosper Insights & Analytics [S02], NRF / Prosper Insights & Analytics [S04], NRF / Prosper Insights & Analytics [S05]
The gap between the two holidays’ per-celebrant average budgets narrowed by US$1.99 (C08–C10). Separate holiday samples. NRF / Prosper Insights & Analytics [S01], NRF / Prosper Insights & Analytics [S02], NRF / Prosper Insights & Analytics [S04], NRF / Prosper Insights & Analytics [S05]
75% / 74%
30%
NRF shoppers planning flowers / greeting cards for Mother’s Day 2026. Categories can overlap. NRF / Prosper Insights & Analytics [S01]
Australian adults planning to mark Mother’s Day 2026 by buying a gift; this is narrower than celebrating in any way. Australian Retail Council / Roy Morgan [S09]
39%
75%
Flowers among Australian respondents who knew what they planned to buy in the 2026 survey. Australian Retail Council / Roy Morgan [S09]
Canadian primary-channel respondents usually doing most Mother’s Day shopping in-store, March 2025. Caddle / Retail Council of Canada [S11]
48% vs 25%
43%
Canadian yes responses for shopping more local/independent versus seeking sustainable options, March 2025. Separate questions. Caddle / Retail Council of Canada [S11]
British mothers wanting a greeting card in YouGov’s February 2024 survey. A historical preference. YouGov Surveys: Self-serve [S07]
37%
47%
Canadian Mother’s Day celebrants planning a meal out in OpenTable’s March 2026 survey; not all Canadians. OpenTable / Ripple Research [S13]
US adult citizens planning to do anything for Mother’s Day in YouGov’s April 2026 survey; different design from NRF. YouGov [S15]
Which Mother’s Day statistic should a writer use?
Choose the measure that matches the story. A gift-only average, a gifts-and-celebrations budget, a mother’s preference and observed platform traffic answer different questions.
| Question | Suitable research | Published figure | Essential qualification |
|---|---|---|---|
| US gifts and celebrations budget | NRF / Prosper Insights & Analytics [S01] | US$284.25 per celebrant in 2026 | Pre-event intention; USD; not all adults or measured sales |
| US gift-only budget | LendingTree / QuestionPro [S12] | US$153 per gift-giver in 2026 | Different sample, basket and eligibility from NRF |
| What mothers want | Drive Research [S06], YouGov Surveys: Self-serve [S07], YouGov Surveys: Self-serve [S08], YouGov Surveys: Self-serve [S16] | Source-specific gift/activity preferences | Mothers’ answers; not purchases; Drive method conflict disclosed |
| Canadian primary shopping channel | Caddle / Retail Council of Canada [S11] | 75% usually most purchases in-store, March 2025 | Primary channel, not any channel used; n=5,936 |
| Australian gift-buying participation | Australian Retail Council / Roy Morgan [S09] | 30% in April 2026 | Buying a gift, not broad celebration in any way |
| Canadian restaurant plans | OpenTable / Ripple Research [S13] | 37% of surveyed celebrants planning a meal out | Celebrants-only sample, not all Canadians |
| US adult-citizen celebration intentions | YouGov [S15] | 47% yes, April 2026 | Different population/questionnaire from NRF; no inferred collapse |
How much did US consumers plan to spend on Mother’s Day?
NRF projected US$38.0 billion for 2026, with an average planned budget of US$284.25 per celebrant. These are estimates from a pre-event survey, rather than audited holiday sales. NRF / Prosper Insights & Analytics [S01].
| ID | Finding and interpretation | Population, actual period and sample | Source and locator |
|---|---|---|---|
| F01 | NRF projected US$38.0 billion in Mother’s Day spending for 2026. Planned spending, not audited sales. Dollar values are nominal USD. Categories and shopping destinations may overlap. | US adult consumers; spending/gift results among celebrants or shoppers as described 2026-04-01 to 2026-04-08 · 7,877 adults; item/subgroup counts not published | Original source [S01] Release opening |
| F02 | 84% of US adults planned to celebrate Mother’s Day in NRF’s 2026 survey. Planned spending, not audited sales. Dollar values are nominal USD. Categories and shopping destinations may overlap. | US adult consumers 2026-04-01 to 2026-04-08 · 7,877 adults | Original source [S01] Release participation paragraph |
| F03 | The average planned Mother’s Day budget was US$284.25 per celebrant in 2026. Planned spending, not audited sales. Dollar values are nominal USD. Categories and shopping destinations may overlap. | Mother’s Day celebrants; source per-person budget 2026-04-01 to 2026-04-08 · 7,877 adults; item/subgroup counts not published | Original source [S01] Release average-spending paragraph |
| F04 | Among celebrants, 54% planned purchases for a mother/stepmother, 22% for a wife and 13% for a daughter. Recipients may overlap. The percentages are respondent plans, not the shares of all dollars each group receives. | US adult consumers; spending/gift results among celebrants or shoppers as described 2026-04-01 to 2026-04-08 · 7,877 adults; item/subgroup counts not published | Original source [S01] Release recipients paragraph |
Which gifts and shopping destinations were popular?
Flowers and greeting cards were the most widely planned gift categories in NRF’s 2026 release. Jewelry accounted for the largest projected dollar budget among the categories it identified. Popularity and expenditure are different measures. NRF / Prosper Insights & Analytics [S01].
| ID | Finding and interpretation | Population, actual period and sample | Source and locator |
|---|---|---|---|
| F05 | Planned gift categories included flowers (75%), greeting cards (74%), special outings (63%), gift cards (55%) and clothing/accessories (51%). Multi-category purchase intentions. A more popular category need not account for more spending. | Mother’s Day shoppers 2026-04-01 to 2026-04-08 · 7,877 adults; item/subgroup counts not published | Original source [S01] Release popular gift categories |
| F06 | Projected category spending was US$7.5bn on jewelry, US$6.4bn on outings, US$4.4bn on electronics, US$3.2bn on flowers and US$1.3bn on cards. Projected rounded amounts; these are selected categories, not a complete spending partition. Not realized sales. | US adult consumers; spending/gift results among celebrants or shoppers as described 2026-04-01 to 2026-04-08 · 7,877 adults; item/subgroup counts not published | Original source [S01] Release category spending paragraph |
| F07 | Planned shopping destinations were online (33%), department stores (33%), specialty stores (29%) and discount stores (26%). Respondents can use more than one destination. These are not market shares. | Mother’s Day shoppers 2026-04-01 to 2026-04-08 · 7,877 adults; item/subgroup counts not published | Original source [S01] Release shopping-destination paragraph |
| F08 | 46% prioritized finding a unique/different gift and 39% creating a special memory. Stated priorities, not measured satisfaction or proof a particular gift is preferred by its recipient. | Mother’s Day gift shoppers 2026-04-01 to 2026-04-08 · 7,877 adults; item/subgroup counts not published | Original source [S01] Release gift priorities paragraph |
Editorial calculation: jewelry represented approximately 19.7% of the projected total budget (US$7.5bn ÷ US$38bn; C12). Projected spending on outings was approximately twice spending on flowers (US$6.4bn ÷ US$3.2bn; C13). Neither calculation gives a typical item price or the share of mothers wanting that gift.
How did planned US spending change between 2024 and 2026?
NRF’s nominal projected total rose from US$33.5 billion in 2024 to US$34.1 billion in 2025 and US$38.0 billion in 2026. The annual samples differ, and these figures do not establish actual or inflation-adjusted growth. NRF / Prosper Insights & Analytics [S01]; NRF / Prosper Insights & Analytics [S02]; NRF / Prosper Insights & Analytics [S03].
| ID | Finding and interpretation | Population, actual period and sample | Source and locator |
|---|---|---|---|
| F09 | In 2025, NRF projected US$34.1bn total spending, an average US$259.04 per celebrant and 84% participation. Historical intention estimates, not realized retail sales; nominal USD. Separate survey from 2026. | US adult consumers; eligible celebrants/shoppers for conditional items 2025-03-31 to 2025-04-07 · 7,948 adults; conditional counts not supplied | Original source [S02] Release opening and participation/average paragraphs |
| F10 | 2025 gift intentions were flowers (74%), cards (73%) and special outings (61%). Historical intention estimates, not realized retail sales; nominal USD. Separate survey from 2026. | 2025 Mother’s Day gift shoppers 2025-03-31 to 2025-04-07 · 7,948 adults; conditional counts not supplied | Original source [S02] Release popular categories |
| F11 | 2025 category budgets included jewelry US$6.8bn, outings US$6.3bn, gift cards US$3.5bn, flowers US$3.2bn and cards US$1.1bn. Historical intention estimates, not realized retail sales; nominal USD. Separate survey from 2026. | US adult consumers; eligible celebrants/shoppers for conditional items 2025-03-31 to 2025-04-07 · 7,948 adults; conditional counts not supplied | Original source [S02] Release category spending paragraph |
| F12 | 2025 shopping plans included online (36%), department stores (32%), specialty stores (29%) and local/small businesses (25%). Destinations overlap. Local/small business is not equivalent to discount stores in the 2026 release. | 2025 Mother’s Day shoppers 2025-03-31 to 2025-04-07 · 7,948 adults; conditional counts not supplied | Original source [S02] Release shopping destinations |
| F13 | In 2024, NRF projected US$33.5bn spending, US$254.04 per celebrant and 84% participation. Historical plans in nominal USD. Current page metadata has a later 2024 migration timestamp, not used as an original release day. | US adult consumers; average budget among celebrants 2024-04-01 to 2024-04-08 · 8,213 adults | Original source [S03] Release opening and participation paragraph |

From 2025 to 2026, the projected total increased by US$3.9 billion, or approximately 11.4%. The average per celebrant increased by US$25.21, or approximately 9.7% (C01–C04). These are separate changes in published budget estimates.
How does Mother’s Day compare with Father’s Day?
The gap depends on whether the story concerns total budgets or average budgets among each holiday’s celebrants. Joining the original NRF releases shows an unchanged US$10.1 billion total gap at published precision in 2025 and 2026, alongside a narrower average-budget gap.
| ID | Finding and interpretation | Population, actual period and sample | Source and locator |
|---|---|---|---|
| F14 | NRF projected US$27.9bn for Father’s Day 2026, US$226.58 per celebrant, with 77% planning to celebrate. Separate Father’s Day survey, not the same people or field dates as Mother’s Day. End-date discrepancy retained. Plans in nominal USD. | US adult consumers; celebrants for average planned spending 2026-04-30 to 2026-05-06 per release; holiday landing page says May 5 · 7,914 adults | Original source [S04] Release opening and participation paragraphs |
| F15 | For Father’s Day 2025, NRF projected US$24.0bn total, US$199.38 per celebrant and 76% participation. Historical plans; separate holiday survey. Nominal USD, not inflation-adjusted or actual transactions. | US adult consumers; celebrants for average planned spending 2025-05-01 to 2025-05-07 · 8,225 adults | Original source [S05] Release opening and participation paragraphs |
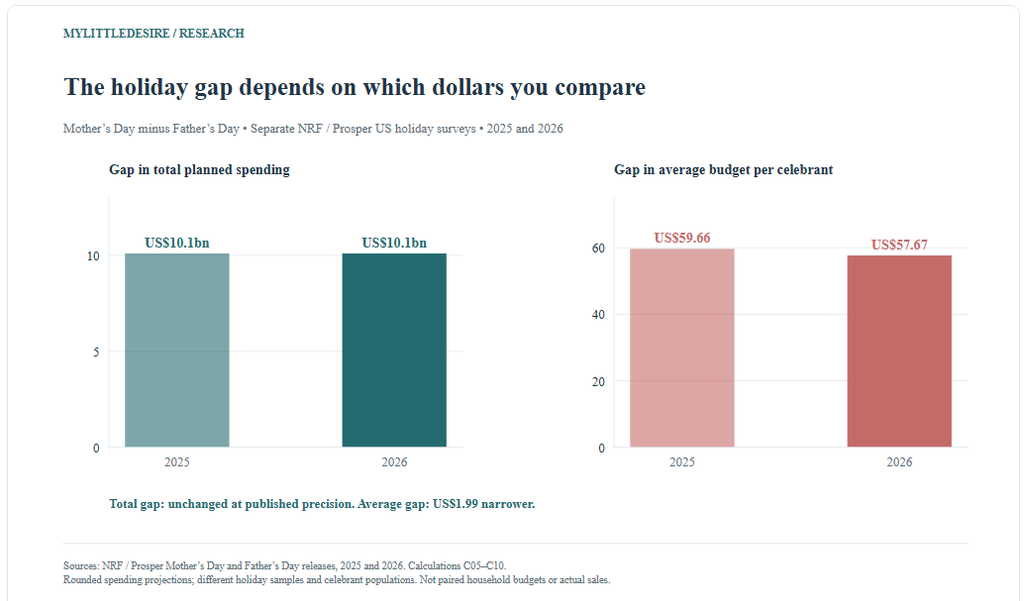
The holiday-average gap moved from US$59.66 to US$57.67, a narrowing of US$1.99 (C08–C10). Separate populations celebrate the two occasions. This cannot establish how the same household treats its mother and father figures, or explain the difference by how much either parent is valued.
What do mothers say they want for Mother’s Day?
Drive Research’s April 2026 survey reports a mix of family time, thoughtful gifts, experiences and rest. It also provides giver plans from a separate non-mother group, enabling qualified comparisons. Drive Research [S06].
Source-method limitation: Drive’s introduction says 1,086 adults, while its methodology says 1,088. The reported subgroup counts are 753 mothers and 304 non-mothers expecting to celebrate. Full weighting and routing are not published. The findings below are verified as reported with this conflict visible. Contradictory spending-threshold summaries are excluded.
| ID | Finding and interpretation | Population, actual period and sample | Source and locator |
|---|---|---|---|
| F16 | Mothers’ preferred 2026 activities included dining out (52%), receiving gifts (48%), an experience (44%), a meal at home (40%) and sleeping in (38%). Source totals conflict (1,086 introduction / 1,088 methodology). Mother group n=753, non-mother celebrant group n=304; full routing/weights not supplied. Responses verified as published, not nationally validated. | US mothers in Drive Research survey April 2026; retrospective questions refer to Mother’s Day 2025 · 753 mothers | Original source [S06] What do moms want to do … section |
| F17 | For Mother’s Day 2025, mothers recalled receiving gifts (54%), a home meal (49%), dining out (36%), chores (32%), sleeping in (27%) and an experience (11%). Source totals conflict (1,086 introduction / 1,088 methodology). Mother group n=753, non-mother celebrant group n=304; full routing/weights not supplied. Responses verified as published, not nationally validated. Retrospective experiences and desired future behavior are not a measured year-over-year outcome trend. | US mothers in Drive Research survey Retrospective 2025 experiences reported April 2026 · 753 mothers | Original source [S06] Last year activity paragraphs |
| F18 | Preferred company included children (89%), spouse/partner (54%), mother/mother figure (28%) and some time alone (20%). Source totals conflict (1,086 introduction / 1,088 methodology). Mother group n=753, non-mother celebrant group n=304; full routing/weights not supplied. Responses verified as published, not nationally validated. Family time and some alone time can both be selected; they are not opposites. | US mothers in Drive Research survey April 2026; retrospective questions refer to Mother’s Day 2025 · 753 mothers | Original source [S06] Who do moms want to spend … section |
| F19 | Desired gifts included a handwritten card (50%), gift cards (48%), flowers (40%), experiences (37%), hobby-related items (36%), homemade gifts (31%), a day off household duties (22%) and breakfast in bed (17%). Source totals conflict (1,086 introduction / 1,088 methodology). Mother group n=753, non-mother celebrant group n=304; full routing/weights not supplied. Responses verified as published, not nationally validated. | US mothers in Drive Research survey April 2026; retrospective questions refer to Mother’s Day 2025 · 753 mothers | Original source [S06] What moms want as Mother’s Day gifts |
| F20 | Non-mother celebrants planned flowers (48%), food/drink (47%), handwritten cards (46%), gift cards (34%), hobby gifts (30%), experiences (21%), a household-duty break (10%) and homemade gifts (8%). Source totals conflict (1,086 introduction / 1,088 methodology). Mother group n=753, non-mother celebrant group n=304; full routing/weights not supplied. Responses verified as published, not nationally validated. These givers are not matched to the mothers answering the preference question. | US non-mothers expecting to celebrate Mother’s Day in Drive Research survey April 2026; retrospective questions refer to Mother’s Day 2025 · 304 non-mother celebrants | Original source [S06] Where gift givers may miss the mark … section |
| F21 | Gift qualities mothers valued were personal/thoughtful (81%), sentimental (49%), reflecting interests (41%), showing effort/planning (37%) and high quality (8%). Source totals conflict (1,086 introduction / 1,088 methodology). Mother group n=753, non-mother celebrant group n=304; full routing/weights not supplied. Responses verified as published, not nationally validated. These are reported response options, not a causal test of what makes someone happy. | US mothers in Drive Research survey April 2026; retrospective questions refer to Mother’s Day 2025 · 753 mothers | Original source [S06] What matters most when moms receive a gift |

The homemade-gift gap is +23.0 percentage points, experience gifts +16.0, gift cards +14.0 and a household-duty break +12.0, while flowers are −8.0 (mothers’ wishes minus non-mother giver plans; C15–C19). These unmatched aggregate answers do not measure individual unmet needs. Several contrasts are already discussed by the original researcher.
How much planning and work do mothers report?
Some mothers say they coordinate their own celebration or want relief from ordinary tasks. Wanting family time and wanting some rest can coexist; the questions do not require choosing one over the other. Drive Research [S06].
| ID | Finding and interpretation | Population, actual period and sample | Source and locator |
|---|---|---|---|
| F22 | 31% of mothers coordinated their own plans. Tasks they most wanted removed included cooking (33%), cleaning (31%) and planning meals/activities (18%). Source totals conflict (1,086 introduction / 1,088 methodology). Mother group n=753, non-mother celebrant group n=304; full routing/weights not supplied. Responses verified as published, not nationally validated. Coordination and desired task relief are separate questions; do not sum them. | US mothers in Drive Research survey April 2026; retrospective questions refer to Mother’s Day 2025 · 753 mothers | Original source [S06] The mental and physical load of Mother’s Day |
| F23 | 25% preferred the entire day alone if there were no social pressure/guilt; 19% reported more work than a normal Sunday and 31% more pressure to make the day special for others. Source totals conflict (1,086 introduction / 1,088 methodology). Mother group n=753, non-mother celebrant group n=304; full routing/weights not supplied. Responses verified as published, not nationally validated. Hypothetical no-pressure preference differs from some alone time. These responses are not clinical measures. | US mothers in Drive Research survey April 2026; retrospective questions refer to Mother’s Day 2025 · 753 mothers | Original source [S06] Mental/physical load agreement statements |
| F24 | Mothers with children at home versus out of home preferred sleeping in at 47%/27%, a duty-free day at 31%/9% and some alone time at 24%/14%. Source totals conflict (1,086 introduction / 1,088 methodology). Mother group n=753, non-mother celebrant group n=304; full routing/weights not supplied. Responses verified as published, not nationally validated. Cross-sectional groups, not effects of children leaving home. | Mother subgroups by whether children live in household April 2026; retrospective questions refer to Mother’s Day 2025 · 753 mothers overall; subgroup counts not supplied | Original source [S06] Table: Moms with children at home … |
What did British mothers prefer?
YouGov’s February 2024 British-mother survey found that time with children led the company preferences, while greeting cards led its listed gift preferences. The findings are historical and retain their original sample and geography. YouGov Surveys: Self-serve [S07].
| ID | Finding and interpretation | Population, actual period and sample | Source and locator |
|---|---|---|---|
| F25 | British mothers wanted time with children (70%), their mother/family (31%), some alone time (11%), friends (5%) or a romantic partner (3%). Historical preferences, not received gifts. Source describes British mothers; do not silently extend coverage to all UK jurisdictions. Full questionnaire not supplied on article. | British mothers; child-age subsets as specified 2024-02-21 to 2024-02-22 · 500 mothers; subgroup counts not supplied | Original source [S07] Who does mum really want … section |
| F26 | Preferred activities were dining out (37%), staying home (31%), wellness treatments (12%), doing nothing (12%) and another outing (12%). Historical preferences, not received gifts. Source describes British mothers; do not silently extend coverage to all UK jurisdictions. Full questionnaire not supplied on article. | British mothers; child-age subsets as specified 2024-02-21 to 2024-02-22 · 500 mothers; subgroup counts not supplied | Original source [S07] Aside from spending time with their children … paragraph |
| F27 | Mothers of under-18s versus adult children selected wellness treatments at 21%/6% and some alone time at 17%/7%. Historical subgroup comparison with unpublished cell counts; no new significance claim or causal interpretation. | Mothers with under-18 versus adult children 2024-02-21 to 2024-02-22 · 500 mothers overall; subgroup counts not given | Original source [S07] Child-age comparison paragraph |
| F28 | Desired gifts included greeting cards (43%), flowers (39%), a meal out (34%), handmade gifts (28%), family photos (16%), wellness experiences (16%) and clothing (7%). Historical preferences, not received gifts. Source describes British mothers; do not silently extend coverage to all UK jurisdictions. Full questionnaire not supplied on article. | British mothers; child-age subsets as specified 2024-02-21 to 2024-02-22 · 500 mothers; subgroup counts not supplied | Original source [S07] What should you buy … section |
What do the American preference surveys show?
YouGov’s American mother surveys provide separate 2024 and 2025 snapshots. They should be read as dated preferences, with activity questions kept separate from gift questions. YouGov Surveys: Self-serve [S08]; YouGov Surveys: Self-serve [S16].
| ID | Finding and interpretation | Population, actual period and sample | Source and locator |
|---|---|---|---|
| F29 | American mothers wanted time with children (60%), their mother/family (31%), alone (20%), a romantic partner (10%) or friends (10%). Historical preferences. Different sample, market, weighting and field dates from the British survey; comparisons are descriptive, not a harmonized country ranking. | American mothers 2024-04-23 · 500 mothers | Original source [S08] Who does mom want to spend … section |
| F30 | Preferred activities were dining out (42%), staying home (32%), another outing (20%), spa treatment (17%) and doing nothing (17%). Historical preferences. Different sample, market, weighting and field dates from the British survey; comparisons are descriptive, not a harmonized country ranking. | American mothers 2024-04-23 · 500 mothers | Original source [S08] Activities paragraph |
| F31 | Desired gifts included a meal out (36%), flowers (31%), handmade gifts (29%), gift cards (28%), greeting cards (24%) and a spa experience (18%). Historical preferences. Different sample, market, weighting and field dates from the British survey; comparisons are descriptive, not a harmonized country ranking. | American mothers 2024-04-23 · 500 mothers | Original source [S08] What should you buy … section |
| ID | Finding and interpretation | Population, actual period and sample | Source and locator |
|---|---|---|---|
| F60 | In YouGov’s 2025 mother survey, desired gifts included a meal out (38%), flowers (34%), gift cards (29%), spa experiences (25%), handmade gifts (25%), cards (22%), family photos (16%) and no gifts (10%). Separate sample from 2024. Full question instrument/answer options not reproduced. Different activity-versus-gift questions should not be merged. | American mothers 2025-04-04 to 2025-04-05 · 500 mothers | Original source [S16] Dining out leads the gift list—again section |
A historical descriptive contrast is the 19-point greeting-card preference difference between the British and American 2024 samples (43% versus 24%; C22). Different countries, field dates and weighting limit interpretation. In the separate American samples, spa-gift preference was seven points higher in 2025 than 2024 (25% versus 18%; C23), a comparison already noted by YouGov.
What do Australian gift-buying surveys measure?
ARC/Roy Morgan’s 2026 release says 30% of adults planned to mark the occasion by buying a gift. Its flower, food and experience percentages are conditional on knowing what to buy. They are not directly comparable with a broad celebration percentage from another country. Australian Retail Council / Roy Morgan [S09].
| ID | Finding and interpretation | Population, actual period and sample | Source and locator |
|---|---|---|---|
| F32 | 30% of Australian adults planned to mark Mother’s Day 2026 by buying a gift, an estimated 7 million people. Buying a gift is narrower than celebrating in any way. The population count is the publisher’s estimate, not the sample size. | Australians aged 18+; gift-choice results among those who know what they plan to buy 2026-04-09 to 2026-04-13 · 4,764 adults; conditional achieved counts not disclosed | Original source [S09] Release overall participation paragraph |
| F33 | The reported average planned spend was A$144 per person in 2026. Do not treat A$144 as an all-Australian-adult mean or convert it into USD for a country ranking. | Publisher’s per-person spending base; precise eligible denominator not disclosed 2026-04-09 to 2026-04-13 · 4,764 adults; conditional achieved counts not disclosed | Original source [S09] Release spending paragraph |
| F34 | Among those knowing what they planned to buy, 39% selected flowers, 24% food/alcohol and 11% experiences. Conditional gift-choice figures, not percentages of all Australians or all celebrants. | Respondents who know what they plan to buy 2026-04-09 to 2026-04-13 · Full sample 4,764; conditional base not disclosed | Original source [S09] Release first gift-choice paragraph |
| F35 | The release reports 33% participation among adults under 35 and 33% among those aged 35–49 in its 2026 Mother’s Day gift-buying analysis. Age-group participation in the release’s gift-buying context, not a harmonized broad-celebration rate or an effect of aging. | Australian adult age groups under 35 and 35–49 2026-04-09 to 2026-04-13 · Full sample 4,764; age-cell counts not supplied | Original source [S09] Release age-participation paragraph |
| F36 | For 2025, the publisher projected A$1bn total, A$141 per person and 30% participation, equivalent to an estimated 7 million people. Publisher’s gift-spending context, not a harmonized broad-celebration rate. Per-person eligibility not fully printed; nominal AUD. | Australians aged 18+; gift-buying respondents for gift choices 2025-04-10 to 2025-04-23 · 3,115 adults; conditional counts not disclosed | Original source [S10] Release opening spending/participation paragraphs |
| F37 | 2025 reported gift choices included flowers (37%), food/beverages (20%), vouchers (10%), personal care (10%), clothing/shoes (9%) and home-related gifts (7%). Not shares of all Australian adults. Current-year gift table explicitly conditions on knowing what to buy, so a direct popularity trend is not assumed. | Gift-choice respondents; item denominator not fully printed 2025-04-10 to 2025-04-23 · 3,115 adults; conditional counts not disclosed | Original source [S10] Release gift-choice paragraphs |
Australian dollars remain labelled A$. The source’s average-spending eligibility and gift-item routing are not fully disclosed; those limitations remain beside the findings. The 2025 gift-choice base is also less explicit than the 2026 decided-buyer base, so the article does not present a precise gift-popularity trend.
How do Canadians shop for Mother’s Day?
Caddle/RCC’s March 2025 report provides different sample counts for participation, budget, channel and inspiration questions. Its primary-channel question reports 75% doing most purchases in-store; this is not equivalent to every shopper who ever uses a store. Caddle / Retail Council of Canada [S11].
| ID | Finding and interpretation | Population, actual period and sample | Source and locator |
|---|---|---|---|
| F38 | 55% answered yes to normally doing something special for Mother’s Day in 2025, versus the report’s historical 60% for 2024 and 72% for 2023. Question says normally, while summary says plan. Preserve wording. Historical methodology equivalence cannot be fully checked from this report. | All respondents to the normally-do-something-special question March 2025; historical 2023/2024 comparisons as labelled in report · 9,386 for March 2025 item; historical sample details not shown | Original source [S11] Physical PDF p.6, exact question and labelled year bars |
| F39 | In the 2025 budget-change item, 13% planned more spending, 77% the same and 10% less. Full recruitment/weighting not detailed. Question wording sometimes says normally, while summary describes plans. Item counts vary; do not derive one base from another. Source boundary wording differs from spending chart. CAD. | Budget-change question respondents March 2025; historical 2023/2024 comparisons as labelled in report · 5,977 | Original source [S11] Physical PDF p.7, 2025 budget-change bars |
| F40 | Planned spending bands were C$50 or less (44%), C$51–100 (31%), C$101–150 (12%) and more than C$150 (13%). Use chart boundary more than C$150; the narrative’s C$150+ is not identical. Currency is CAD. | Planned-spending question respondents March 2025; historical 2023/2024 comparisons as labelled in report · 5,877 | Original source [S11] Physical PDF p.8, 2025 chart bands |
| F41 | Primary shopping channels were in-store (75%), retailer websites (9%), third-party sellers (4%), mixed store/online (11%) and other (2%). Usually/most-purchases question, not all channels ever used. Rounded categories total 101%; do not normalize or compare as NRF multi-channel market shares. | Primary-channel question respondents March 2025; historical 2023/2024 comparisons as labelled in report · 5,936 | Original source [S11] Physical PDF p.9, How do you usually make most …? |
| F42 | 60% normally made a dedicated shopping trip in 2025, the same as 2024 and above 56% in 2023. Gen Z and millennials were each 63%; boomers 53%. Historical values are quoted by the report; generation groups are cross-sectional. No claim of an individual behavior change. | Dedicated-trip item respondents; generation subsets March 2025; historical 2023/2024 comparisons as labelled in report · 5,936 overall; subgroup sizes not shown | Original source [S11] Physical PDF p.11, normally-make-dedicated-trip chart/callout |
The report’s spending chart says more than C$150; its prose sometimes says C$150 or more. The chart boundary is preserved here. Likewise, its participation question asks what respondents normally do, even though the summary describes plans. Keeping those details visible improves citation accuracy.
How do local and sustainable shopping plans compare?
The Canadian report shows a larger yes percentage for shopping more local/independent than for seeking sustainable options, but almost the same unsure percentage. These questions have equal printed sample sizes and different meanings. Caddle / Retail Council of Canada [S11].
| ID | Finding and interpretation | Population, actual period and sample | Source and locator |
|---|---|---|---|
| F43 | 48% planned to shop more local/independent retailers, 18% did not and 34% were unsure. Stated intention, not observed sales or a verified local-retailer definition. Same overall item count as sustainability question, but no individual cross-tab is supplied. | Local/independent-shopping question respondents March 2025; historical 2023/2024 comparisons as labelled in report · 5,936 | Original source [S11] Physical PDF p.12, local/independent item |
| F44 | Gift inspiration included friends/family (38%), products seen in-store (35%), flyers (29%), social media (22%), retailer sites/apps (17%) and TV ads (9%). Multiple sources can influence one shopper. These are not shares of purchases caused by each marketing channel. | Gift-inspiration question respondents March 2025; historical 2023/2024 comparisons as labelled in report · 5,936 | Original source [S11] Physical PDF p.13, 2025 bars |
| F45 | 25% would seek eco-friendly packaging or sustainable products, 40% would not and 35% were unsure. Yes responses were Gen Z 31%, millennials 29%, Gen X 20% and boomers 20%. Intentions, not audited environmental behavior. A yes/no/unsure response does not establish individual overlap with local shopping. | Sustainability question respondents; generation subgroups March 2025; historical 2023/2024 comparisons as labelled in report · 5,936 overall; subgroup counts not shown | Original source [S11] Physical PDF p.15, sustainability item and generation callouts |
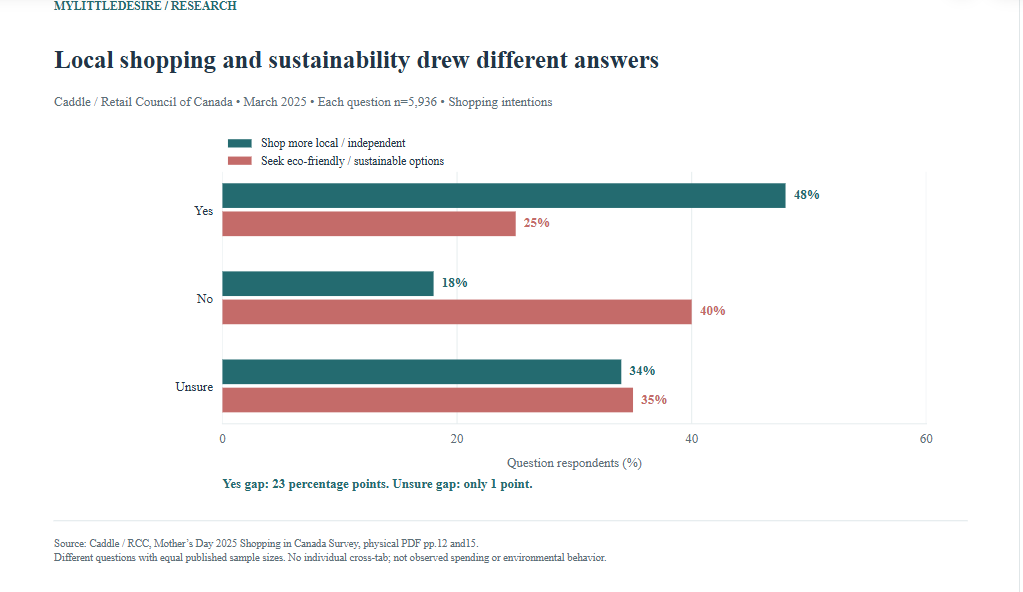
The yes-response gap is 23.0 percentage points; the local-minus-sustainability unsure gap is −1.0 point (C20–C21). Equal base sizes do not provide an individual cross-tab, so this does not identify who would buy both or explain why people were undecided.
Why do other US gift budgets look different?
LendingTree’s 2026 study reports US$153 per gift-giver, using a gift-only question and a different sample from NRF. Both averages can describe their own studies without representing the same shopping basket. LendingTree / QuestionPro [S12].
| ID | Finding and interpretation | Population, actual period and sample | Source and locator |
|---|---|---|---|
| F46 | 66% planned to give a Mother’s Day gift in 2026, compared with 71% in the publisher’s 2025 comparison. New 2026 not-sure option was grouped with no for comparison. The five-point decline is not a fully unchanged-question experiment. | US consumers ages 18–80 2026-04-02 to 2026-04-06; 2025 comparisons quoted in release · 2,000 adults | Original source [S12] Key findings and methodological-update note |
| F47 | Gift-givers planned an average US$153 in 2026, compared with US$148 in 2025. Gift-only giver budget differs from NRF’s gifts-and-celebrations budget among celebrants. The two means are not interchangeable. | Respondents planning to give Mother’s Day gifts 2026-04-02 to 2026-04-06; 2025 comparisons quoted in release · 2,000 overall; achieved gift-giver base not published | Original source [S12] Average planned-spending paragraph |
| F48 | Average gift budgets were US$190 for men and US$113 for women; by generation, Gen Z US$186, millennials US$168, Gen X US$134 and boomers US$114. Source age bands in 2026: Gen Z 18–29, millennials 30–45, Gen X 46–61, boomers 62–80. Cross-sectional, nominal USD; not causal. | Gift-givers within published gender/generation categories 2026-04-02 to 2026-04-06; 2025 comparisons quoted in release · Full survey 2,000; subgroup counts not published | Original source [S12] Average budget demographic paragraph |
| F49 | Planned payment methods included cash/debit (54%), a credit card (25%) and buy now, pay later (9%). Payment intentions, not realized debt, borrowing amounts, default rates or financial advice. Selected categories do not exhaust all options. | Mother’s Day gift-givers; item routing not fully disclosed 2026-04-02 to 2026-04-06; 2025 comparisons quoted in release · Full survey 2,000; conditional base not published | Original source [S12] Payment-method paragraph |
| F50 | 41% reported spending more on Mother’s Day than Father’s Day, 5% more on Father’s Day and 24% on neither. Among those spending more on Mother’s Day, 55% called the difference significant. The 55% figure has a conditional base. Self-reported significant is not a statistical significance test or an amount in dollars. | All surveyed consumers for holiday comparison; conditional Mother’s-Day-more subset for significant gap 2026-04-02 to 2026-04-06; 2025 comparisons quoted in release · 2,000 adults; conditional achieved counts not published | Original source [S12] Consumers spend more on Mother’s Day than Father’s Day |
Its 2026 gift-giving question added a not-sure option, which the publisher groups with no for historical comparison. The reported participation change therefore needs that method note. Planned payment methods are not realized debt or evidence that a certain gift price is appropriate.
What does dining research add?
OpenTable’s March 2026 surveys cover people already celebrating Mother’s Day. Its platform data separately describe observed online-reservation dining activity on Mother’s Day 2025 versus 2024. Survey intentions and platform observations must not be merged into one population rate. OpenTable / Ripple Research [S13]; OpenTable / Ripple Research [S14].
| ID | Finding and interpretation | Population, actual period and sample | Source and locator |
|---|---|---|---|
| F51 | Among Canadian Mother’s Day celebrants in OpenTable’s survey, 37% planned a meal out and 65% considered dining out important to the occasion. Planning and perceived importance are different questions. City quotas are used; weighting details not supplied. | Canadian Mother’s Day celebrants, not all Canadian adults 2026-03-16 to 2026-03-19 · 1,500 celebrants | Original source [S13] OpenTable-authored release opening; methodology note 1 |
| F52 | 41% of the Canadian mother/mother-figure subgroup most wanted a meal out with family. Selected celebrant subgroup, not a national all-mothers estimate. | Mother/mother-figure respondents who are being celebrated and also celebrating others 2026-03-16 to 2026-03-19 · 637 in specified subgroup | Original source [S13] Big tables, shared celebrations paragraph |
| F53 | On OpenTable’s Canadian platform, Mother’s Day seated-diner activity for parties of six or more grew 29% in 2025 versus 2024. Platform-only relative change, not a 29-point participation increase or national restaurant sales growth. Source analyzes seated diners by party size, not a disclosed raw count of bookings. | Online reservations at active Canadian OpenTable restaurants 2025-05-11 compared with 2024-05-12 · Reservation/diner counts not published | Original source [S13] Big tables paragraph; OpenTable Data note 3 |
| F54 | In OpenTable’s mother-figure subgroup, 42% preferred a family meal out versus 4% breakfast in bed. These selected celebrants are not all US mothers. Breakfast preference wording differs from Drive’s multi-gift-wish question; percentages are not contradictory measurements of one item. | US mother/mother-figure respondents being celebrated and celebrating others 2026-03-16 to 2026-03-19 · 669 in specified subgroup | Original source [S14] Opening paragraph and research note 1 |
| F55 | Among surveyed US Mother’s Day celebrants, 62% considered dining out important and 38% planned a multigenerational celebration. Celebrant sample with city quotas; not all US adults. These are different questions and may overlap. | US Mother’s Day celebrants 2026-03-16 to 2026-03-19 · 1,500 celebrants | Original source [S14] Opening paragraph and party-size bullet |
| F56 | US OpenTable platform activity for parties of six or more rose 13%, and 5pm dining rose 14%, on Mother’s Day 2025 versus 2024. Relative platform changes, not percentage-point shifts or industry-wide causal effects. No deduction about restaurant capacity or revenue. | Online reservations at active US OpenTable restaurants 2025-05-11 compared with 2024-05-12 · Platform counts not published | Original source [S14] Party-size and early-dinner bullets; platform note 2 |
Platform growth is a relative change, rather than a percentage-point increase or a measure of every restaurant in the country. The Canada release’s conflicting year wording for solo dining and the US release’s insufficiently documented prior-year booking comparison are omitted from the 60 findings.
Why do Mother’s Day participation estimates differ?
YouGov’s April 2026 survey asked US adult citizens whether they planned to do anything to celebrate and reported 47% yes. NRF reported 84% among its US adult-consumer survey. Different eligibility, questionnaire design and field dates mean these are not a before-and-after series. YouGov [S15]; NRF / Prosper Insights & Analytics [S01].
| ID | Finding and interpretation | Population, actual period and sample | Source and locator |
|---|---|---|---|
| F57 | 47% of US adult citizens planned to do anything for Mother’s Day in YouGov’s April 2026 survey; 34% said no and 20% were unsure. Rounded responses total 101%. Different population, timing and questionnaire from NRF; do not label the 47%/84% difference as change over time. | US adult citizens 18+; celebrants for companion question 2026-04-23 to 2026-04-28 · 1,134 adult citizens; Mother’s Day companion item unweighted n=593 | Original source [S15] Physical PDF p.2 Q9; methodology p.31 |
| F58 | For Father’s Day, 34% said yes, 45% no and 21% unsure. The original researcher’s article reports 32% planning both holidays. These use the adult-citizen base. Both-holiday figure is the researcher’s reported cross-tab result, not a product of separate percentages. | US adult citizens 18+; celebrants for companion question 2026-04-23 to 2026-04-28 · 1,134 adult citizens; Mother’s Day companion item unweighted n=593 | Original source [S15] Physical PDF p.3 Q11; linked original YouGov article for both-holiday figure |
| F59 | Among Mother’s Day celebrants, 64% planned time with their mother, 37% children/stepchildren, 28% a partner, 17% a sibling and 13% a mother-in-law. Multiple people can be selected; these are not shares of all adults or counts of gift recipients. | US adult-citizen respondents planning to celebrate Mother’s Day 2026-04-23 to 2026-04-28 · Unweighted n=593 for Q10 | Original source [S15] Physical PDF p.3 Q10 and p.28 cross-tab (printed p.24) |
No harmonized four-country participation ranking is produced. The Australian figure concerns buying a gift; the Canadian item asks about normally doing something special; OpenTable samples celebrants; YouGov specifies adult citizens. A country label alone does not make the measures comparable.
What comparisons does MyLittleDesire contribute?
MyLittleDesire contributes the source-checked presentation and the reproducible arithmetic below. The underlying surveys and platform records belong to their original researchers. Several simpler contrasts are already visible in their reports; the 24 calculations are not 24 new scientific discoveries.
| ID | Comparison | Reproducible result | Citing qualification |
|---|---|---|---|
| C01 | Mother’s Day total budget increase, 2025–2026 | US$3.9 billion | Planned budgets from published rounded inputs; not actual sales, real growth or a causal explanation. NRF / Prosper Insights & Analytics [S01], NRF / Prosper Insights & Analytics [S02] |
| C02 | Mother’s Day total budget growth, 2025–2026 | 11.4% | Planned budgets from published rounded inputs; not actual sales, real growth or a causal explanation. NRF / Prosper Insights & Analytics [S01], NRF / Prosper Insights & Analytics [S02] |
| C03 | Mother’s Day per-celebrant budget increase | US$25.21 | Planned budgets from published rounded inputs; not actual sales, real growth or a causal explanation. NRF / Prosper Insights & Analytics [S01], NRF / Prosper Insights & Analytics [S02] |
| C04 | Mother’s Day per-celebrant budget growth | 9.7% | Planned budgets from published rounded inputs; not actual sales, real growth or a causal explanation. NRF / Prosper Insights & Analytics [S01], NRF / Prosper Insights & Analytics [S02] |
| C05 | Mother’s Day minus Father’s Day total, 2025 | US$10.1 billion | Planned budgets from published rounded inputs; not actual sales, real growth or a causal explanation. Holiday populations and dates differ. NRF / Prosper Insights & Analytics [S02], NRF / Prosper Insights & Analytics [S05] |
| C06 | Mother’s Day minus Father’s Day total, 2026 | US$10.1 billion | Planned budgets from published rounded inputs; not actual sales, real growth or a causal explanation. Holiday populations and dates differ. NRF / Prosper Insights & Analytics [S01], NRF / Prosper Insights & Analytics [S04] |
| C07 | Change in holiday total-spending gap, 2025–2026 | US$0.0 billion | Unchanged at precision of published rounded totals, not proof of exactly unchanged underlying dollars. NRF / Prosper Insights & Analytics [S01], NRF / Prosper Insights & Analytics [S02], NRF / Prosper Insights & Analytics [S04], NRF / Prosper Insights & Analytics [S05] |
| C08 | Mother’s Day minus Father’s Day average, 2025 | US$59.66 | Planned budgets from published rounded inputs; not actual sales, real growth or a causal explanation. Not spending by the same households on both holidays. NRF / Prosper Insights & Analytics [S02], NRF / Prosper Insights & Analytics [S05] |
| C09 | Mother’s Day minus Father’s Day average, 2026 | US$57.67 | Planned budgets from published rounded inputs; not actual sales, real growth or a causal explanation. Not spending by the same households on both holidays. NRF / Prosper Insights & Analytics [S01], NRF / Prosper Insights & Analytics [S04] |
| C10 | Change in holiday per-celebrant budget gap | US$-1.99 | The difference between two holiday averages narrowed; no paired-household analysis or causal explanation. NRF / Prosper Insights & Analytics [S01], NRF / Prosper Insights & Analytics [S02], NRF / Prosper Insights & Analytics [S04], NRF / Prosper Insights & Analytics [S05] |
| C11 | Mother’s minus Father’s participation, NRF 2026 | 7.0 percentage points | Different field dates and holiday questions. Descriptive, without a new significance test. NRF / Prosper Insights & Analytics [S01], NRF / Prosper Insights & Analytics [S04] |
| C12 | Jewelry share of projected Mother’s Day budget | Approximately 19.7% | Share of projected dollars, not share of gift buyers. Numerator and denominator are rounded. NRF / Prosper Insights & Analytics [S01] |
| C13 | Projected outing spending divided by flower spending | Approximately 2.00× | Spending ratio, not relative popularity or an individual gift price ratio. NRF / Prosper Insights & Analytics [S01] |
| C14 | Greeting-card category budget growth, 2025–2026 | Approximately 18.2% | Based on rounded billion-dollar budgets, not cards sold or inflation-adjusted volume. NRF / Prosper Insights & Analytics [S01], NRF / Prosper Insights & Analytics [S02] |
| C15 | Homemade gifts: mothers’ wishes minus non-mother giver plans | +23.0 percentage points | Unmatched groups, not individual unmet needs. Overall sample-count conflict and unpublished weighting/routing remain attached. Source already discusses several comparisons. Drive Research [S06] |
| C16 | Household-duty break: mothers’ wishes minus non-mother giver plans | +12.0 percentage points | Unmatched groups, not individual unmet needs. Overall sample-count conflict and unpublished weighting/routing remain attached. Source already discusses several comparisons. Drive Research [S06] |
| C17 | Experience gifts: mothers’ wishes minus non-mother giver plans | +16.0 percentage points | Unmatched groups, not individual unmet needs. Overall sample-count conflict and unpublished weighting/routing remain attached. Source already discusses several comparisons. Drive Research [S06] |
| C18 | Gift cards: mothers’ wishes minus non-mother giver plans | +14.0 percentage points | Unmatched groups, not individual unmet needs. Overall sample-count conflict and unpublished weighting/routing remain attached. Source already discusses several comparisons. Drive Research [S06] |
| C19 | Flowers: mothers’ wishes minus non-mother giver plans | -8.0 percentage points | Unmatched groups, not individual unmet needs. Overall sample-count conflict and unpublished weighting/routing remain attached. Source already discusses several comparisons. Drive Research [S06] |
| C20 | Local-shopping yes minus sustainability yes | 23.0 percentage points | Separate questions with equal published base sizes; not an individual-level cross-tab or observed spending. Caddle / Retail Council of Canada [S11] |
| C21 | Local-shopping unsure minus sustainability unsure | -1.0 percentage points | Similar aggregate uncertainty does not prove the same respondents are undecided on both questions. Caddle / Retail Council of Canada [S11] |
| C22 | British minus American greeting-card preference, 2024 | 19.0 percentage points | Separate samples, field dates and weighting; historical descriptive contrast, not a harmonized national ranking or significance claim. YouGov Surveys: Self-serve [S07], YouGov Surveys: Self-serve [S08] |
| C23 | American spa-gift preference change, 2024–2025 | +7.0 percentage points | Already noted by original researcher. No paired-mother trend or newly tested significance. YouGov Surveys: Self-serve [S08], YouGov Surveys: Self-serve [S16] |
| C24 | Primary in-store minus retailer-website channel | 66.0 percentage points | Most/primary channel, not all channel use. Hybrid and third-party options are separate; rounded responses total 101%. Caddle / Retail Council of Canada [S11] |
For related occasion research, see Valentine’s Day spending, gifts and celebration statistics. Broader relationship priorities belong in the relationship satisfaction, trust and communication resource.
What cannot be concluded from these statistics?
- No consumer result here measures what will happen in 2027. A planning-edition title does not change the fieldwork year.
- Projected budgets are not actual sales, and nominal spending increases are not inflation-adjusted growth or evidence that people bought more items.
- Percentages for celebrants, gift buyers, mothers, adult citizens and restaurant-platform users have different denominators.
- Separate gift-giver and recipient groups do not show individual gift disappointment or which specific families failed to match preferences.
- Wanting some alone time does not mean rejecting family time. The selected survey response is not a diagnosis or a judgment about a mother’s relationships.
- Commercially commissioned research and opt-in samples retain limitations. Some full instruments, weights and conditional sample sizes are unavailable.
- Country comparisons are limited by currency, population, wording, timing and shopping basket. No currency-converted league table or pooled world estimate is supplied.
How were the findings selected and verified?
We reviewed original research releases, public reports, questionnaire tables and platform-method notes. Every included finding links to its original published source or author-distributed research release. Source records identify publication and data dates, population, sample size where available, methodology, locator, relevant definitions, caveats and verification status.
Verification means checked as published. It does not independently validate fieldwork, turn every panel into a probability sample or make selected celebrants representative of all adults. The 60 groups contain 234 numeric source inputs. Those cells are not additional independent findings. Sixteen numeric source records come from seven publisher/pollster families: NRF/Prosper, Drive Research, YouGov, ARC/ARA/Roy Morgan, Caddle/RCC, LendingTree/QuestionPro and OpenTable/Ripple. Calendar references are separate.
Related categories stay together. Source conflicts are retained or the affected claim is excluded. The limited-method extract flags Drive’s inconsistent total sample counts. Historical 2024/2025 findings retain their actual dates. The original full publications and survey instruments are linked rather than republished.
Calculations use published rounded inputs. Percentage differences use percentage points; ratios are dimensionless; monetary calculations retain currency and units. No raw microdata, new significance tests, inflation adjustment, pooled prevalence estimate or causal model is used. Static charts reproduce the supplied chart-data file; workbook calculations and chart-data tables link to editable inputs.
Complete original sources
- S01 · NRF / Prosper Insights & Analytics. Mother’s Day Spending Expected to Hit Record $38 Billion. Publication: 2026-04-21. Actual data period: 2026-04-01 to 2026-04-08. Sample: 7,877 adults; item/subgroup counts not published. Annual consumer-intentions survey; public release does not fully describe recruitment or weighting; publisher reports ±1.1-point margin of error, not independently validated here. Planned spending, not audited sales. Dollar values are nominal USD. Categories and shopping destinations may overlap.
- S02 · NRF / Prosper Insights & Analytics. Mother’s Day Spending Expected to Reach $34.1 Billion. Publication: 2025-04-28. Actual data period: 2025-03-31 to 2025-04-07. Sample: 7,948 adults; conditional counts not supplied. Annual consumer-intentions survey; public release does not fully describe recruitment or weighting; publisher reports ±1.1-point margin of error, not independently validated here. Historical intention estimates, not realized retail sales; nominal USD. Separate survey from 2026.
- S03 · NRF / Prosper Insights & Analytics. Consumers Expected to Spend Near-Record $33.5 Billion on Mother’s Day. Publication: 2024 release; original publication day not confirmed on current page. Actual data period: 2024-04-01 to 2024-04-08. Sample: 8,213 adults. Annual consumer-intentions survey; public release does not fully describe recruitment or weighting; publisher reports ±1.1-point margin of error, not independently validated here. Historical plans in nominal USD. Current page metadata has a later 2024 migration timestamp, not used as an original release day.
- S04 · NRF / Prosper Insights & Analytics. Father’s Day Spending to Hit Record $27.9 Billion. Publication: 2026-06-10. Actual data period: 2026-04-30 to 2026-05-06 per release; holiday landing page says May 5. Sample: 7,914 adults. Annual consumer-intentions survey; public release does not fully describe recruitment or weighting; publisher reports ±1.1-point margin of error, not independently validated here. Separate Father’s Day survey, not the same people or field dates as Mother’s Day. End-date discrepancy retained. Plans in nominal USD. Supporting reference: Original supporting material 1.
- S05 · NRF / Prosper Insights & Analytics. Father’s Day Spending to Reach Record $24 Billion. Publication: 2025-05-29. Actual data period: 2025-05-01 to 2025-05-07. Sample: 8,225 adults. Annual consumer-intentions survey; public release does not fully describe recruitment or weighting; publisher reports ±1.1-point margin of error, not independently validated here. Historical plans; separate holiday survey. Nominal USD, not inflation-adjusted or actual transactions.
- S06 · Drive Research. Mother’s Day Statistics 2026: How Moms Want to Be Celebrated. Publication: 2026-04-20. Actual data period: April 2026; retrospective questions refer to Mother’s Day 2025. Sample: Mother subgroup n=753; non-mother celebrants n=304; total conflicts: 1,086 in introduction versus 1,088 in methodology. US online survey; recruitment, weighting and full questionnaire not disclosed. Overall sample totals conflict; subgroup totals need not exhaust all adults. Mother/giver comparisons are unmatched groups. Spending summaries also conflict and are excluded. Verification means as reported, not independently validated fieldwork.
- S07 · YouGov Surveys: Self-serve. What do British mums want for Mother’s Day?. Publication: 2024-02-27. Actual data period: 2024-02-21 to 2024-02-22. Sample: 500 mothers; subgroup counts not supplied. Online; weighted by age, gender, education, region and social grade. Historical preferences, not received gifts. Source describes British mothers; do not silently extend coverage to all UK jurisdictions. Full questionnaire not supplied on article.
- S08 · YouGov Surveys: Self-serve. What do American moms want for Mother’s Day?. Publication: 2024-05-01. Actual data period: 2024-04-23. Sample: 500 mothers. Online; weighted by age, gender, race, political affiliation, education and region. Historical preferences. Different sample, market, weighting and field dates from the British survey; comparisons are descriptive, not a harmonized country ranking.
- S09 · Australian Retail Council / Roy Morgan. Flowers top Mother’s Day gifts as Australians favour simple, meaningful celebrations. Publication: 2026-05-09. Actual data period: 2026-04-09 to 2026-04-13. Sample: 4,764 adults; conditional achieved counts not disclosed. ARC–Roy Morgan Snap SMS survey; described as representative cross-section. Gift-buying participation differs from broad celebration. Average spending eligibility and some meal-item bases are not fully printed. Amounts are AUD.
- S10 · Australian Retailers Association / Roy Morgan. Mother’s Day love: fewer Aussies spending more. Publication: 2025-05-07. Actual data period: 2025-04-10 to 2025-04-23. Sample: 3,115 adults; conditional counts not disclosed. ARA–Roy Morgan Snap SMS, Australian-wide cross-section. Projected budgets, not actual retail turnover. Eligibility for individual gift percentages is not fully disclosed; do not call them shares of all adults. Amounts are AUD. Supporting reference: Original supporting material 1.
- S11 · Caddle / Retail Council of Canada. Mother’s Day 2025 Shopping in Canada Survey. Publication: April 2025 public report; filename April 22, exact release day not printed. Actual data period: March 2025; historical 2023/2024 comparisons as labelled in report. Sample: Methodology lists n=9,386 and n=9,411; item bases 5,877–5,977 where shown. Caddle mobile platform and online panel; publisher describes representative randomized samples; self-commissioned and funded by Caddle. Full recruitment/weighting not detailed. Question wording sometimes says normally, while summary describes plans. Item counts vary; do not derive one base from another. Source boundary wording differs from spending chart. CAD.
- S12 · LendingTree / QuestionPro. Fewer Americans Buying Mother’s Day Gifts, but Those Who Do Spend More. Publication: Updated 2026-05-04. Actual data period: 2026-04-02 to 2026-04-06; 2025 comparisons quoted in release. Sample: 2,000 adults; conditional achieved counts not published. Online non-probability sample with quotas and quality review. Added not-sure option in 2026 is grouped with no for gift-giving comparisons. Gift budget has narrower scope than NRF gifts-and-celebrations budget. Overspending subgroup bases are unclear and excluded. USD.
- S13 · OpenTable / Ripple Research. Table for Mom: OpenTable Launches Mother’s Day Dining Trends and Canada’s Top 100 Brunch and Lunch Restaurants for 2026. Publication: 2026-04-21. Actual data period: Survey 2026-03-16 to 2026-03-19; platform comparison 2025-05-11 versus 2024-05-12. Sample: Survey n=1,500; mother-figure subset n=637; platform counts not disclosed. Online Ripple survey with city quotas; separate OpenTable seated-diner reservation data. Not all Canadians. Survey and platform data are distinct; platform growth is not restaurant-industry-wide growth. Solo-dining paragraph has a year conflict and is excluded. The host is distribution of OpenTable’s own release, not independent editorial verification. Supporting reference: Original supporting material 1.
- S14 · OpenTable / Ripple Research. Why Moms Prefer Reservations Over Breakfast in Bed for Mother’s Day. Publication: 2026-04-21. Actual data period: Survey 2026-03-16 to 2026-03-19; platform comparison 2025-05-11 versus 2024-05-12. Sample: Survey n=1,500; mother-figure subset n=669; platform counts not disclosed. Online Ripple survey with city quotas; separate online-reservation seated-diner records. Not all US adults or all mothers. Mother-figure subset also celebrates other mother figures. Platform growth does not establish national restaurant demand growth.
- S15 · YouGov. YouGov Survey: Mother’s Day and Father’s Day. Publication: Article 2026-05-07; report April 2026. Actual data period: 2026-04-23 to 2026-04-28. Sample: 1,134 adult citizens; Mother’s Day companion item unweighted n=593. Opt-in web panel; demographic and political weighting; methodology physical PDF p.31. Citizens-only population, different questionnaire and timing from NRF. Rounded responses can sum to 101%. Full sample is not the denominator for conditional companion percentages. Supporting reference: Original supporting material 1.
- S16 · YouGov Surveys: Self-serve. What Do American Moms Want for Mother’s Day in 2025?. Publication: 2025-04-08. Actual data period: 2025-04-04 to 2025-04-05. Sample: 500 mothers. Online; weighted by age, gender, race, political affiliation, education and region. Separate sample from 2024. Full question instrument/answer options not reproduced. Different activity-versus-gift questions should not be merged.
- S17 · timeanddate.com. Mother’s Day 2027 country calendars. Publication: Current calendar checked 2026-10-24. Actual data period: 2027 calendar dates; not survey fieldwork. Sample: Not applicable: calendar reference. Country observance calendars checked against 2027 date rows. Calendar dates are known future observances, not future consumer behavior. This source is excluded from the 60 survey-finding count. Supporting reference: Original supporting material 1, Original supporting material 2, Original supporting material 3.
How should this resource be cited?
Credit the original research organization, field year and population when citing its result. Cite MyLittleDesire for the synthesis, charts or calculations you use, and consult the original link to verify the underlying research.
MyLittleDesire. Mother’s Day Statistics 2027: Spending, Gifts & What Mothers Want https://mylittledesire.com/mothers-day-statistics/. Add your actual access date if required by your citation style.