
How satisfied are people with their relationships, and what do they think makes a relationship work? The answer depends on the question. Rating trust as important is different from trusting a current partner. Feeling loved is different from being satisfied with communication.
This resource presents 60 distinct observations from five published survey reports by four organizations: Ipsos, YouGov, Pew Research Center and the American Psychiatric Association. It includes findings for the United States, Great Britain, Canada and Australia where the source provides them. 37 observations use 2025–2026 fieldwork; 23 use historical 2019 fieldwork. The year in the title is the review year, and every finding retains its own data period. MyLittleDesire compiled these results; it did not conduct the surveys.
Key findings
- 94%: U.S. adult citizens assigned the trust question who rated trust very important to a successful romantic relationship. Data: Jan. 28–Feb. 3, 2025. YouGov, 2025-02-07.
- 92%: U.S. adult citizens assigned the honesty question who rated honesty very important. Data: Jan. 28–Feb. 3, 2025. YouGov, 2025-02-07.
- 87%: U.S. adult citizens assigned the communication question who rated open communication very important. Data: Jan. 28–Feb. 3, 2025. YouGov, 2025-02-07.
- 36%: U.S. adult citizens in relationships who rated their current relationship quality excellent. Data: Jan. 28–Feb. 3, 2025. YouGov, 2025-02-07.
- 55%: Married or partnered U.S. respondents ages 18–74 who were very satisfied with their partner/spouse relationship. Data: Dec. 24, 2025–Jan. 9, 2026. Ipsos, 2026-02-12.
- 52%: Married or partnered respondents in Great Britain ages 16–74 who were very satisfied with their partner/spouse relationship. Data: Dec. 24, 2025–Jan. 9, 2026. Ipsos, 2026-02-12.
- 46%: Married or partnered Canadian respondents ages 18–74 who were very satisfied with their partner/spouse relationship. Data: Dec. 24, 2025–Jan. 9, 2026. Ipsos, 2026-02-12.
- 48%: Married or partnered Australian respondents ages 16–74 who were very satisfied with their partner/spouse relationship. Data: Dec. 24, 2025–Jan. 9, 2026. Ipsos, 2026-02-12.
- 43%: Married U.S. adults who were very satisfied with how they communicated with their spouse. Data: June 25–July 8, 2019; historical. Pew Research Center, 2019-11-06.
- 84%: Married U.S. adults who expressed a great deal of trust in their spouse’s faithfulness. Data: June 25–July 8, 2019; historical. Pew Research Center, 2019-11-06.
- 51%: Partnered U.S. adults who reported their partner was often or sometimes distracted by a cellphone during conversations. Data: Oct. 16–28, 2019; historical. Pew Research Center, 2020-05-08.
- 53%: U.S. adults who agreed that technology helps maintain relationships they would otherwise lose touch with. Data: Apr. 13–15, 2026. American Psychiatric Association, 2026-05-12.
Which relationship statistic should a writer use?
Choose the source whose question, population and period match your claim. YouGov measures relationship priorities and self-rated quality. Ipsos measures several kinds of satisfaction. Pew provides clearly dated comparisons of communication, trust and digital behavior. The APA poll measures adults’ perceptions of technology across relationships broadly.
| Source | Measure and population | Data period |
|---|---|---|
| Ipsos, Love Life Satisfaction 2026 | Feeling loved and romantic/sex-life satisfaction; partner satisfaction only among married/partnered respondents. US/Canada ages 18–74; Great Britain/Australia ages 16–74. | Dec. 24, 2025–Jan. 9, 2026 |
| YouGov, Relationship Advice | Very-important ratings among U.S. adult citizens; current quality among those in relationships, including casual relationships. | Jan. 28–Feb. 3, 2025 |
| Pew, Marriage and Cohabitation | Going very well; very satisfied with communication/chores; a great deal of trust. Married and cohabiting U.S. adults. | June 25–July 8, 2019 |
| Pew, Dating and Relationships in the Digital Age | Phone distraction/privacy among partnered U.S. adults; jealousy conditional on a partner using social media. | Oct. 16–28, 2019 |
| American Psychiatric Association, 2026 annual poll | Strongly/somewhat agreeing with technology statements; U.S. adults, relationships broadly. | Apr. 13–15, 2026 |
These rows describe different measurements, not comparable national relationship-success rates. Full provenance, source locations and caveats are recorded in the companion research sheet.
What do people consider important in a successful relationship?
In YouGov’s 2025 poll, 94% rated trust very important, 92% rated honesty very important and 87% rated open communication very important. These answers describe values and expectations, rather than how well respondents’ current relationships function.
Respondents received a random selection of 16 of 32 factors. The eleven selected items below had their own unweighted bases of 1,026–1,112. The full sample of 2,167 does not apply to every item.
Trust, communication and other relationship priorities
| Finding | Percent | Data period |
|---|---|---|
| Rating trust very important to a successful romantic relationship | 94% | Jan. 28–Feb. 3, 2025 |
| Rating honesty very important to a successful romantic relationship | 92% | Jan. 28–Feb. 3, 2025 |
| Rating respect very important to a successful romantic relationship | 91% | Jan. 28–Feb. 3, 2025 |
| Rating open communication very important to a successful romantic relationship | 87% | Jan. 28–Feb. 3, 2025 |
| Rating friendship very important to a successful romantic relationship | 83% | Jan. 28–Feb. 3, 2025 |
| Rating emotional connection very important to a successful romantic relationship | 83% | Jan. 28–Feb. 3, 2025 |
| Rating appreciation very important to a successful romantic relationship | 83% | Jan. 28–Feb. 3, 2025 |
| Rating conflict resolution very important to a successful romantic relationship | 78% | Jan. 28–Feb. 3, 2025 |
| Rating compromise very important to a successful romantic relationship | 71% | Jan. 28–Feb. 3, 2025 |
| Rating quality time very important to a successful romantic relationship | 78% | Jan. 28–Feb. 3, 2025 |
| Rating forgiveness very important to a successful romantic relationship | 78% | Jan. 28–Feb. 3, 2025 |
Source: YouGov, 2025-02-07. Question 3, “Very important” column; individual crosstabs on PDF physical pages 7–17. Population: U.S. adult citizens assigned each factor.
What Do American Value In a Relationship?
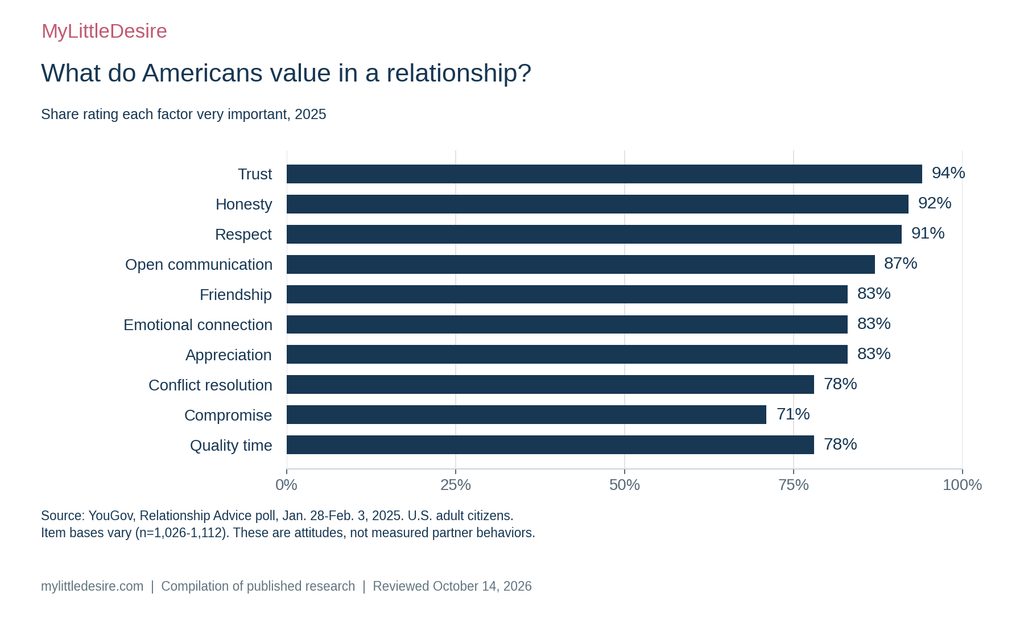
Friendship, emotional connection and appreciation each received an 83% rounded rating. The equal percentages do not show that the same people selected all three. These findings also do not demonstrate that any factor causes a relationship to last.
How do people rate their current relationship quality?
Among U.S. adult citizens in relationships, 36% rated their current relationship excellent and 34% rated it very good in YouGov’s 2025 poll. The question included casual relationships, so its population differs from surveys limited to married or cohabiting couples.
| Finding | Percent | Data period |
|---|---|---|
| Rating current relationship quality excellent | 36% | Jan. 28–Feb. 3, 2025 |
| Rating current relationship quality very good | 34% | Jan. 28–Feb. 3, 2025 |
| Rating current relationship quality good | 19% | Jan. 28–Feb. 3, 2025 |
| Rating current relationship quality fair | 5% | Jan. 28–Feb. 3, 2025 |
| Rating current relationship quality poor | 3% | Jan. 28–Feb. 3, 2025 |
Source: YouGov, 2025-02-07. Question 2; crosstab on PDF physical page 6. Unweighted relationship-quality base: 1,370.
These are five substantive rating categories. The original table also records 2% preferring not to say. Rounded categories including that non-disclosure option sum to 99%, so avoid treating sums of the rounded percentages as exact unrounded estimates.
How satisfied are people with feeling loved and their romantic life?
Ipsos reported a 29-country average of 77% satisfied with feeling loved and 60% satisfied with romantic/sex life in its 2026 survey. Both measures combine “very” and “somewhat” satisfied.
| Finding | Percent | Data period |
|---|---|---|
| Ipsos country average satisfied with feeling loved | 77% | Dec. 24, 2025–Jan. 9, 2026 |
| Ipsos country average satisfied with romantic/sex life | 60% | Dec. 24, 2025–Jan. 9, 2026 |
Source: Ipsos, 2026-02-12. PDF physical pages 5 and 7, published country-average “Satisfied” values.
Each participating country receives equal weight in these averages. They are not world-population prevalence estimates. Some participating country samples cover more connected or urban populations, and these two questions are not restricted to married or partnered respondents.
How does very high satisfaction compare across the US, Great Britain, Canada and Australia?
The share very satisfied with a partner/spouse relationship was 55% in the United States, 52% in Great Britain, 48% in Australia and 46% in Canada. These are the published “very satisfied” responses among married or partnered respondents, not the broader combined satisfied category.
Ipsos’s US and Canadian samples covered ages 18–74; Great Britain and Australia covered ages 16–74. People aged 75 and older are excluded. Great Britain does not include Northern Ireland, so these findings should not be relabeled as covering the entire United Kingdom.
Very satisfied with feeling loved
| Finding | Percent | Data period |
|---|---|---|
| United States: very satisfied with feeling loved | 43% | Dec. 24, 2025–Jan. 9, 2026 |
| Great Britain: very satisfied with feeling loved | 37% | Dec. 24, 2025–Jan. 9, 2026 |
| Canada: very satisfied with feeling loved | 36% | Dec. 24, 2025–Jan. 9, 2026 |
| Australia: very satisfied with feeling loved | 37% | Dec. 24, 2025–Jan. 9, 2026 |
Source: Ipsos, 2026-02-12. PDF physical page 6, country rows, “Very satisfied” column. Base: each age-bounded country sample, not only partnered people.
Very satisfied with romantic or sex life
| Finding | Percent | Data period |
|---|---|---|
| United States: very satisfied with romantic/sex life | 34% | Dec. 24, 2025–Jan. 9, 2026 |
| Great Britain: very satisfied with romantic/sex life | 27% | Dec. 24, 2025–Jan. 9, 2026 |
| Canada: very satisfied with romantic/sex life | 21% | Dec. 24, 2025–Jan. 9, 2026 |
| Australia: very satisfied with romantic/sex life | 26% | Dec. 24, 2025–Jan. 9, 2026 |
Source: Ipsos, 2026-02-12. PDF physical page 8, country rows, “Very satisfied” column. Base: each age-bounded country sample.
Very satisfied with a partner or spouse relationship
| Finding | Percent | Data period |
|---|---|---|
| United States: very satisfied with relationship with partner/spouse | 55% | Dec. 24, 2025–Jan. 9, 2026 |
| Great Britain: very satisfied with relationship with partner/spouse | 52% | Dec. 24, 2025–Jan. 9, 2026 |
| Canada: very satisfied with relationship with partner/spouse | 46% | Dec. 24, 2025–Jan. 9, 2026 |
| Australia: very satisfied with relationship with partner/spouse | 48% | Dec. 24, 2025–Jan. 9, 2026 |
Source: Ipsos, 2026-02-12. PDF physical page 10, country rows, “Very satisfied” column. Base: married or partnered respondents within each age-bounded country sample.
How Many are very Satisfied With their Partner?
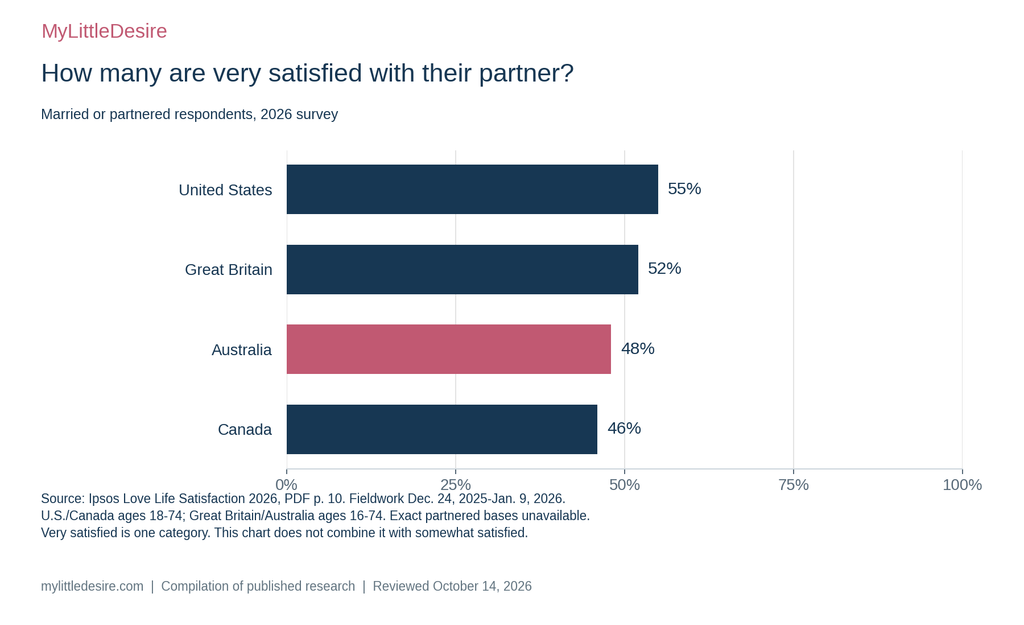
Ipsos surveyed 23,268 people across 29 markets, with approximately 1,000 respondents overall in each of these four markets. Neither the global total nor the approximate country sample is the answering base for every partner-satisfaction percentage. The observed differences should not be interpreted as a precise ranking of all adults in these countries.
What did historical research find about relationship satisfaction and communication?
In Pew’s June–July 2019 survey, 43% of married U.S. adults were very satisfied with communication, compared with 35% of adults living with an unmarried partner. These are historical 2019 findings, retained for context rather than presented as measurements from 2026.
| Finding | Percent | Data period |
|---|---|---|
| Married adults: relationship going very well | 58% | June 25–July 8, 2019 |
| Cohabiting adults: relationship going very well | 41% | June 25–July 8, 2019 |
| Married adults: very satisfied with communication | 43% | June 25–July 8, 2019 |
| Cohabiting adults: very satisfied with communication | 35% | June 25–July 8, 2019 |
| Married adults: very satisfied with division of household chores | 46% | June 25–July 8, 2019 |
| Cohabiting adults: very satisfied with division of household chores | 37% | June 25–July 8, 2019 |
Source: Pew Research Center, 2019-11-06. Full-report PDF physical page 40 for “going very well” and page 42 for communication and household chores. Population: married or cohabiting U.S. adults ages 18 and older.
The full survey included 9,834 adults, with 5,579 married respondents and 880 cohabiting respondents. These are group sample counts, not necessarily the achieved answering base for each item. Differences between the groups are associations; the survey does not establish that marriage causes greater satisfaction.
How much do people trust their partner?
Trust depends on the behavior being asked about. In Pew’s 2019 survey, 84% of married adults expressed a great deal of trust in their spouse’s faithfulness, compared with 56% for handling money responsibly. “A great deal” is a specific threshold and excludes “a fair amount” of trust.
Trust by relationship status and behavior: historical 2019 findings
| Finding | Percent | Data period |
|---|---|---|
| Married adults: a great deal of trust in partner’s faithfulness | 84% | June 25–July 8, 2019 |
| Cohabiting adults: a great deal of trust in partner’s faithfulness | 71% | June 25–July 8, 2019 |
| Married adults: a great deal of trust in partner’s acting in their best interest | 74% | June 25–July 8, 2019 |
| Cohabiting adults: a great deal of trust in partner’s acting in their best interest | 58% | June 25–July 8, 2019 |
| Married adults: a great deal of trust in partner’s always telling the truth | 68% | June 25–July 8, 2019 |
| Cohabiting adults: a great deal of trust in partner’s always telling the truth | 52% | June 25–July 8, 2019 |
| Married adults: a great deal of trust in partner’s handling money responsibly | 56% | June 25–July 8, 2019 |
| Cohabiting adults: a great deal of trust in partner’s handling money responsibly | 40% | June 25–July 8, 2019 |
Source: Pew Research Center, 2019-11-06. Full-report PDF physical page 43 (printed page 42), trust chart. Population: married or cohabiting U.S. adults; “a great deal” of trust only.
Trust In Partner, married vs cohabiting U.S. adults ,2026
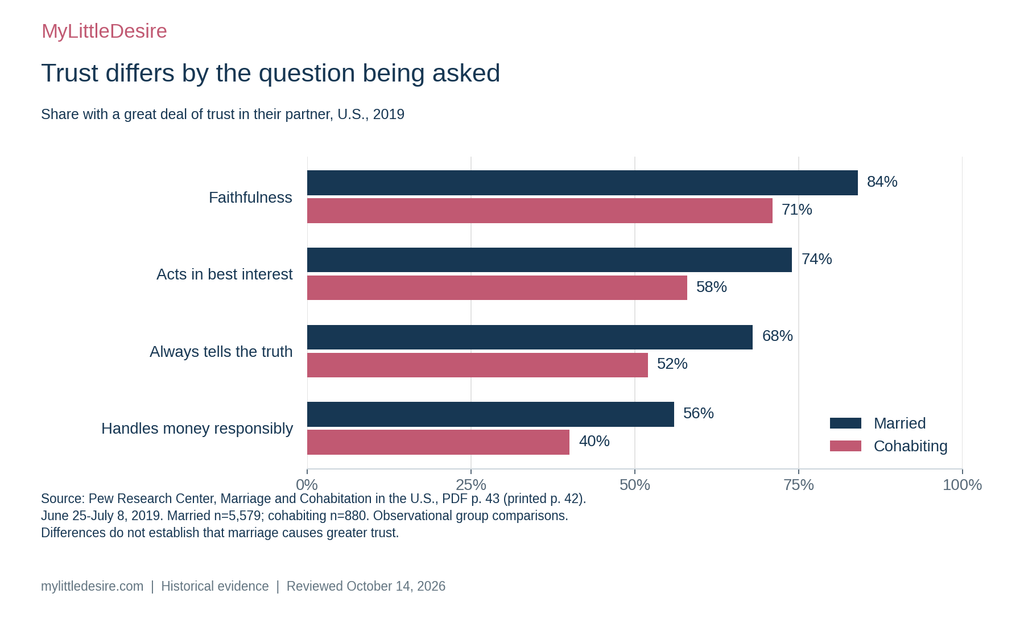
MyLittleDesire’s comparison of the published rounded values gives a 13-percentage-point married–cohabiting gap for faithfulness and 16-point gaps for the other three questions. These subtractions are derived comparisons, not additional survey observations or estimates of what marriage itself changes.
How often do phones distract partners during conversations?
Pew’s October 2019 fieldwork found that 51% of partnered U.S. adults said their partner was often or sometimes distracted by a cellphone during conversations. The reported age comparison was 52% for ages 18–29, 62% for ages 30–49 and 41% for ages 50 and older.
| Finding | Percent | Data period |
|---|---|---|
| Partner at least sometimes distracted by cellphone during conversations | 51% | Oct. 16–28, 2019 |
| Partner at least sometimes distracted by cellphone: respondent ages 18-29 | 52% | Oct. 16–28, 2019 |
| Partner at least sometimes distracted by cellphone: respondent ages 30-49 | 62% | Oct. 16–28, 2019 |
| Partner at least sometimes distracted by cellphone: respondent ages 50+ | 41% | Oct. 16–28, 2019 |
Source: Pew Research Center, 2020-05-08. Full-report PDF physical page 4 (printed page 3), published narrative and age comparison. Partnered means married, cohabiting or in a committed relationship.
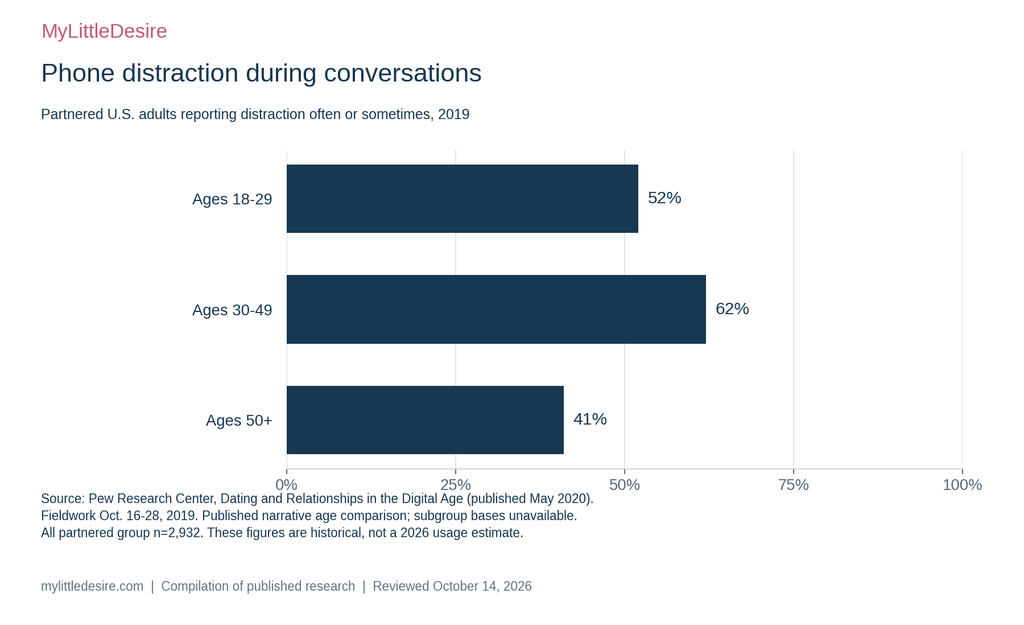
The overall study included 4,860 adults; the partnered group contained 2,932. The conditional questionnaire base for respondents whose partner had a cellphone was 2,850. Its rounded toplines differ from the all-partnered narrative estimates, so this report retains the published narrative values and their stated population instead of substituting that conditional base.
The question measures reported distraction during conversation. It does not show that phones caused breakups, establish an addiction diagnosis or determine how often a particular couple argued.
What does research show about phone privacy and social-media jealousy?
In Pew’s 2019 fieldwork, 34% of partnered U.S. adults reported ever looking through their current partner’s cellphone without the partner’s knowledge. The published narrative reported 42% among women and 25% among men.
Looking through a current partner’s cellphone without their knowledge
| Finding | Percent | Data period |
|---|---|---|
| Ever looked through current partner’s cellphone without their knowledge | 34% | Oct. 16–28, 2019 |
| Women: ever looked through partner’s cellphone without knowledge | 42% | Oct. 16–28, 2019 |
| Men: ever looked through partner’s cellphone without knowledge | 25% | Oct. 16–28, 2019 |
Source: Pew Research Center, 2020-05-08. Full-report PDF physical page 5 (printed page 4), published narrative. “Ever” refers to the current partner; this is not a monthly frequency or a count of cheating incidents.
Jealousy or uncertainty linked to a partner’s social-media interactions
| Finding | Percent | Data period |
|---|---|---|
| Felt jealous or unsure because of partner’s social-media interactions | 23% | Oct. 16–28, 2019 |
| Ages 18-29: felt jealous or unsure because of partner’s social-media interactions | 34% | Oct. 16–28, 2019 |
Source: Pew Research Center, 2020-05-08. Full-report PDF physical page 22 (printed page 21) and questionnaire item SNSFEEL. These estimates apply only to partnered adults whose current partner used social media. The conditional group contained 2,187 respondents; the young-adult item base was not reported in the consulted material.
The 23% overall jealousy finding and 34% young-adult finding use that social-media condition. They should not be described as percentages of all adults. Phone snooping or jealousy is not, by itself, evidence that a partner was unfaithful.
How do people think technology affects their relationships in 2026?
In the American Psychiatric Association’s April 2026 poll, 53% agreed that technology helps maintain relationships they would otherwise lose touch with. At the same time, 40% agreed that technology makes their relationships feel less personal. Benefits and drawbacks can coexist; different statements can be endorsed by the same respondent.
| Finding | Percent | Data period |
|---|---|---|
| Agreeing that technology helps maintain relationships they would otherwise lose touch with | 53% | Apr. 13–15, 2026 |
| Agreeing that technology makes it easier to express thoughts and feelings | 44% | Apr. 13–15, 2026 |
| Agreeing that technology strengthens existing relationships | 40% | Apr. 13–15, 2026 |
| Agreeing that technology helps form new relationships | 40% | Apr. 13–15, 2026 |
| Agreeing that technology makes relationships feel less personal | 40% | Apr. 13–15, 2026 |
| Agreeing that technology causes relationship misunderstandings | 36% | Apr. 13–15, 2026 |
| Agreeing that technology interferes with forming new relationships | 31% | Apr. 13–15, 2026 |
Source: American Psychiatric Association, 2026-05-12. “Impact of Technology” table, “Agree” column; agree combines strongly and somewhat agree. Population: U.S. adults in the APA-commissioned Morning Consult poll.
Morning Consult surveyed 2,201 adults from April 13–15, 2026. APA reports a margin of error of ±2 percentage points, but complete technical methods, weighting details and item-level answering bases were not obtained. This compilation does not independently establish probability representativeness.
These statements concern technology broadly and relationships broadly. They are not specifically about romantic relationships, generative AI or dating apps. They record perceived effects rather than experimentally measured causal effects, and the percentages must not be added.
For broader context on social connection, see MyLittleDesire’s loneliness statistics resource. Loneliness, relationship satisfaction and perceived technology effects remain different measures.
Why can relationship statistics seem to disagree?
Different percentages can be accurate when they answer different questions. Check these distinctions before comparing studies:
- Values versus experience: Calling communication very important does not mean a respondent is satisfied with communication in their own relationship.
- Response thresholds: “Very satisfied,” “very or somewhat satisfied,” “excellent” and “a great deal of trust” are different categories.
- Eligible populations: All adult citizens, age-bounded country samples, married people, cohabiting people and people whose partner uses social media are different groups.
- Collection dates: A report published in 2020 can describe fieldwork from 2019. The 2026 title does not turn that historical evidence into current prevalence.
- Geographic coverage: Great Britain is not the entire United Kingdom. An equal-country average is not a population-weighted global rate.
This report does not calculate a pooled relationship-success rate, infer a trend from unlike studies or treat the difference between YouGov’s 2025 attitudes and Pew’s 2019 experiences as a measured shortfall within the same couples.
Methodology and limitations
MyLittleDesire selected relevant findings from original published survey tables and first-party research releases. Each research-sheet entry records the value, organization, report, direct URL, publication date, fieldwork period, population, available sample information, definition, source location, caveats and verification status. Values and context were checked against the publishers’ text or tables.
The 60 observations are distinct combinations of measure and population within a survey period, not 60 independent studies. The key findings and charts repeat selected observations and do not increase that count. MyLittleDesire’s contribution is the organization, explanation of measurement differences, charts and explicitly labeled comparisons. AI assisted the compilation; underlying respondent microdata were not reanalyzed.
- Scope: Five publications by four organizations; 37 selected observations from 2025–2026 fieldwork and 23 from 2019. This is an editorial compilation, not a systematic review of all relationship research.
- Ipsos: Country samples are age-bounded and weighted; country averages give countries equal weight. Partner satisfaction uses a conditional answering group. Exact achieved country/item bases are unavailable in the consulted report.
- YouGov: A matched and weighted opt-in sample of U.S. adult citizens. Importance questions were randomly assigned, so item bases differ. Do not describe it as a probability sample of all U.S. residents.
- Pew: Weighted probability-recruited survey panels. Full-study, partnered-group and conditional-item sample counts differ. Relationships between demographic groups and responses are descriptive, not causal.
- APA: A commissioned Morning Consult poll with dates, total sample and a reported margin of error. Complete sampling and weighting details were not obtained; reported perceptions do not establish causal effects.
- Uncertainty: Percentages are rounded; unreported bases remain unknown. No new confidence intervals, statistical-significance tests or projected 2026 values were invented.
- Excluded claims: Inconsistent Ipsos aggregate partner-satisfaction figures across source versions and reconstructed Pew conditional phone percentages were kept out of the publishable findings. These issues are recorded in the research audit.
The charts reproduce compatible values within each original survey. Cross-country partner-satisfaction comparisons retain their age-limit differences. None combines unrelated studies into a trend, and none claims to predict an individual relationship’s outcome.
Complete original sources
- Ipsos. Love Life Satisfaction 2026. Published 2026-02-12. Data: 2025-12-24 to 2026-01-09.
- YouGov. YouGov Survey: Relationship Advice. Published 2025-02-07. Data: 2025-01-28 to 2025-02-03; companion survey 2025-01-29 to 2025-02-01.
- Pew Research Center. Marriage and Cohabitation in the U.S.: How married and cohabiting adults see their relationships. Published 2019-11-06. Data: 2019-06-25 to 2019-07-08. Full report PDF. Methodology.
- Pew Research Center. Dating and Relationships in the Digital Age. Published 2020-05-08. Data: 2019-10-16 to 2019-10-28. Full report PDF. Methodology.
- American Psychiatric Association. Annual Mental Health Poll Finds Americans Anxious About Current Events, Personal Finances and Emerging Technology. Published 2026-05-12. Data: 2026-04-13 to 2026-04-15.
How to cite this resource
Suggested citation:
MyLittleDesire. Relationship Satisfaction, Trust & Communication Statistics 2026. https://mylittledesire.com/relationship-statistics/ Add the date you accessed the published page.
Original HTML resource: https://mylittledesire.com/relationship-statistics/.
Cite MyLittleDesire for this compilation, its charts or its labeled derived comparisons. When reporting or verifying an underlying survey result, also cite the original research organization and include its collection period. MyLittleDesire should not be credited as conducting these surveys.