Compiled by MyLittleDesire
Research type: Compilation and analysis of published findings
How common is loneliness? The answer depends on who was surveyed, when the research took place, and what respondents were asked.
Feeling lonely every day, experiencing loneliness yesterday, and scoring above a loneliness-index threshold are different measurements. A useful statistic keeps those distinctions visible.
This report brings together 60 distinct findings about loneliness, friendship, social support, and relationship technology from nine source entries. It covers the United States, England, Canada, and Australia, alongside global context from the World Health Organization.
The year in the title indicates when this resource was reviewed. Each finding retains its actual survey or evidence period.
Key findings
| Finding | Data period | Original source |
|---|---|---|
| 42% of US adults reported loneliness at least weekly. | April 13–15, 2026 | American Psychiatric Association |
| 16% of US adults reported loneliness every day. | April 13–15, 2026 | American Psychiatric Association |
| 15.8% was WHO’s summarized global loneliness estimate. | Evidence from 2014–2023; published in 2025 | World Health Organization |
| 20% of US adults reported loneliness a lot of the previous day in Gallup’s February 2026 observation. | February 2026 | Gallup |
| 16% of US adults felt lonely or isolated all or most of the time in Pew’s survey. | September 3–15, 2024 | Pew Research Center |
| 22% of US adults under 50 felt lonely or isolated all or most of the time. | September 3–15, 2024 | Pew Research Center |
| 9% of US adults aged 50 and over reported that same frequency. | September 3–15, 2024 | Pew Research Center |
| 25% of US men aged 15–34 reported substantial previous-day loneliness in Gallup’s pooled analysis. | 2023–2024 | Gallup |
| 13% of Canadians aged 15 and over felt lonely always or often. | First quarter of 2024 | Statistics Canada |
| 24% of Canadians with virtual-only friend contact felt lonely always or often. | April 11–June 22, 2025 | Statistics Canada |
| 15% of Canadians with both virtual and in-person friend contact reported that same frequency. | April 11–June 22, 2025 | Statistics Canada |
| 7% of people aged 16 and over in England felt lonely often or always. | October 2025–March 2026 | Community and Engagement Survey |
| 15% of Australians aged 15 and over met the HILDA loneliness-index threshold. | 2024 survey wave | Australian Institute of Health and Welfare |
| 15% of Australians aged 15 and over met a separate HILDA social-isolation threshold. | 2024 survey wave | Australian Institute of Health and Welfare |
Reading note: These findings describe different questions and populations. They should not be combined into a single prevalence estimate or used to rank countries.
What is the difference between loneliness and social isolation?
Loneliness describes a perceived shortfall in the connection someone wants or needs. Social isolation concerns the extent of their relationships and social contact. Someone can experience either without experiencing both. who.int
Related measures answer additional questions:
| Concept | What it describes |
|---|---|
| Loneliness | A person’s perceived lack of satisfying connection |
| Social isolation | Limited relationships, roles, or social contact |
| Social support | Whether someone has people they can depend on |
| Friendship satisfaction | How satisfied someone feels with their friendships |
| Relationship technology perceptions | How respondents believe technology affects their relationships |
These distinctions matter when research becomes a headline. Having people to contact does not necessarily mean feeling understood, and dissatisfaction with a friendship is not automatically a measure of loneliness.
Which loneliness statistic should a writer use?
Choose the study whose question, population, and period match the statement you want to make.
For example, a statement about weekly loneliness among US adults should use a weekly-frequency measure. A statement about loneliness among younger men should retain that study’s age range and gender group.
| Source | Appropriate use | Population and period | Sample information |
|---|---|---|---|
| S01: Pew Research Center | Feeling lonely or isolated all or most of the time; frequency and age comparisons | US adults aged 18+; September 2024 | Total sample: 6,204; subgroup bases differ |
| S02: Gallup US trend | Loneliness a lot of the previous day; selected historical observations | US adults; current point labeled February 2026 | Exact achieved sample for the current loneliness row not separately verified |
| S03: Gallup World Poll | Previous-day loneliness among matched age and gender groups | Specified groups aged 15+; pooled 2023–2024 | Exact pooled country and subgroup bases not reported in the article |
| S04: Statistics Canada | Always-or-often loneliness and demographic comparisons | Canadian Social Survey population aged 15+; first quarter of 2024 | Exact achieved bases not stated in the summary |
| S05: Statistics Canada | Associations between friend-contact patterns, loneliness, support, and satisfaction | People aged 15+ in the ten provinces; April–June 2025 | Exact achieved bases not stated in the release |
| S06: England’s Community and Engagement Survey | Direct loneliness frequency and a separate indirect measure | People aged 16+ in England; October 2025–March 2026 | Report cites over 175,000 survey responses overall; analytic bases require the data tables |
| S07: AIHW’s HILDA analysis | Separate loneliness and social-isolation indexes | Australian survey respondents aged 15+; 2024 wave | Exact analytic and subgroup bases not stated on the page |
| S08: APA/Morning Consult | Weekly and daily loneliness; opinions about relationship technology | US adults; April 13–15, 2026 | Total poll sample: 2,201; item-level bases not supplied |
| S09: WHO | Global context from an evidence synthesis | Global estimate using 2014–2023 evidence | Not one survey with a single achieved sample |
Why do published loneliness percentages differ?
A difference between two percentages can reflect several things:
- Different questions or response thresholds.
- Different age groups or target populations.
- Different collection periods.
- Different survey modes and sampling approaches.
- Different definitions of loneliness or isolation.
Before interpreting a difference as a change in society, check whether the studies actually measure the same experience.
How common was weekly and daily loneliness in the US in 2026?
APA’s April 2026 poll found that 42% of adults reported loneliness at least weekly, including 16% who reported it every day. psychiatry.org
| Statistic ID | Frequency | Percentage |
|---|---|---|
| L051 | At least weekly | 42% |
| L052 | Every day | 16% |
Source: American Psychiatric Association: 2026 annual mental health poll
Fieldwork: April 13–15, 2026
Population: US adults
Total sample: 2,201
Published: May 12, 2026
Morning Consult conducted the poll for APA. The release reports a margin of error of ±2 percentage points but does not supply complete sampling and weighting documentation.
The daily group is included within the at-least-weekly group. Adding the two percentages would double-count respondents.
What did Pew find about loneliness and isolation in the US?
Pew found that 16% of US adults felt lonely or isolated all or most of the time in its September 2024 survey. Pew Research Center
How frequently did adults feel lonely or isolated?
| Statistic ID | Frequency | Percentage |
|---|---|---|
| L001 | All or most of the time | 16% |
| L002 | Sometimes | 38% |
| L003 | Hardly ever or never | 47% |
How did frequent loneliness differ by age?
| Statistic ID | Age group | Lonely or isolated all or most of the time |
|---|---|---|
| L004 | Under 50 | 22% |
| L005 | 50 and over | 9% |
Source: Pew Research Center: Men, Women and Social Connections
Fieldwork: September 3–15, 2024
Population: US adults aged 18+
Total sample: 6,204
Published: January 16, 2025
Pew used probability-based panels and weighted the survey to represent the US adult population. Subgroup sample sizes differ from the total sample.
Pew’s question includes feeling isolated as well as lonely. Its findings should retain that wording. The displayed frequency categories total slightly above 100% because of rounding. Pew Research Center
Has previous-day loneliness changed in Gallup’s US trend?
Gallup’s February 2026 observation was 20% for US adults reporting loneliness a lot of the previous day.
The following are selected observations from its published loneliness series.
| Statistic ID | Observation period | Previous-day loneliness |
|---|---|---|
| L007 | March 2021 | 25% |
| L008 | February 2023 | 17% |
| L009 | August 27–September 4, 2024 | 20% |
| L006 | February 2026 | 20% |
Source: Gallup: U.S. Depression Rate Remains Elevated, embedded loneliness trend table
Population: US adults
Published: April 21, 2026
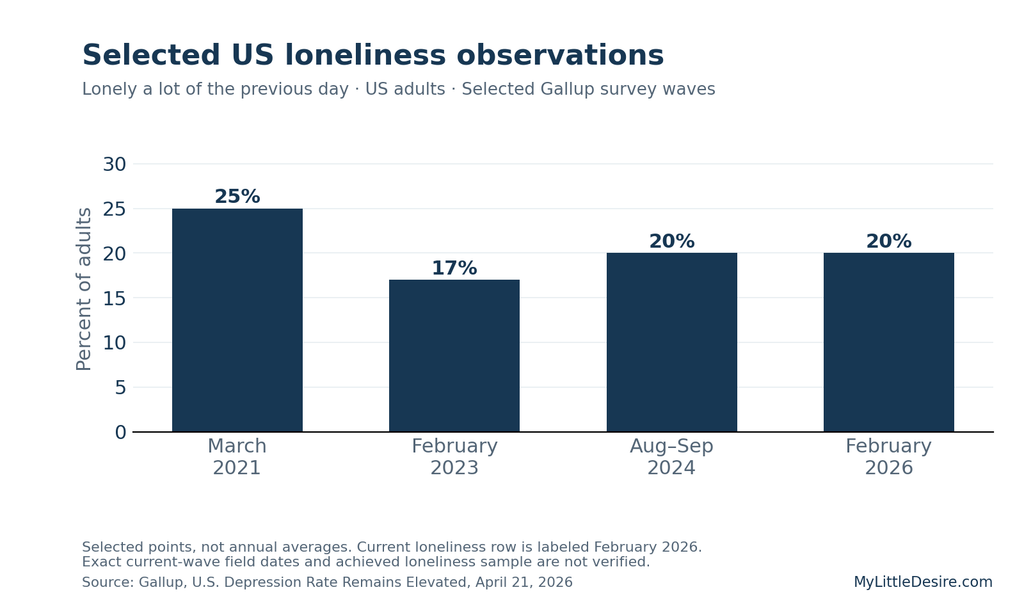
Chart: MyLittleDesire presentation of Gallup’s published observations. These are selected survey points, not annual averages.
How should this trend be interpreted?
The figures provide historical reference points. They do not describe every intervening month or establish that the percentage stayed constant between observations.
The current loneliness row is labeled February 2026. The same Gallup article assigns February 18–March 3 fieldwork and a sample of 5,017 explicitly to its depression results. Those details are not assigned here to the loneliness row. news.gallup.com
What does research show about younger men’s loneliness?
Gallup’s pooled 2023–2024 World Poll analysis found that 25% of US men aged 15–34 reported loneliness a lot of the previous day.
The country comparison below retains the same age and gender group. Separate US female estimates are included as additional findings.
| Statistic ID | Survey group | Previous-day loneliness |
|---|---|---|
| L010 | US men aged 15–34 | 25% |
| L011 | US women aged 15–34 | 18% |
| L012 | UK men aged 15–34 | 21% |
| L013 | Canadian men aged 15–34 | 22% |
| L014 | Australian men aged 15–34 | 20% |
| L015 | US women aged 35–54 | 20% |
Source: Gallup: Younger Men in the U.S. Among the Loneliest in West
Data period: Pooled 2023 and 2024 World Poll data
Population: The specified age and gender groups
Published: May 20, 2025
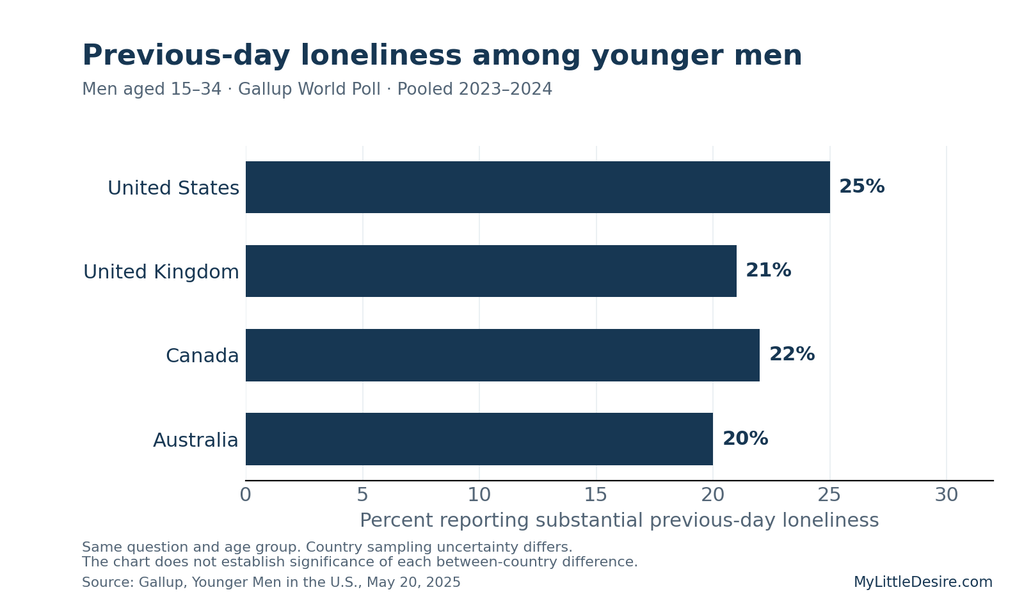
Chart: MyLittleDesire presentation of Gallup World Poll findings. Country sampling uncertainty differs.
This is a descriptive comparison of one population using a shared question and pooled year window. It is not a ranking of loneliness among all adults in these countries.
Exact pooled subgroup bases are not stated in the article. The displayed percentages do not establish statistical significance for every country difference. news.gallup.com
How did loneliness vary across Canadian groups in early 2024?
Statistics Canada reported that 13% of people aged 15 and over felt lonely always or often in the first quarter of 2024.
| Statistic ID | Survey group | Always or often lonely |
|---|---|---|
| L016 | Overall, aged 15+ | 13% |
| L017 | Aged 15–24 | 17% |
| L018 | Aged 25–54 | 14% |
| L019 | Aged 55–64 | 11% |
| L020 | Aged 65+ | 10% |
| L021 | LGBTQ2+ Canadians | 27% |
| L022 | People with a disability, difficulty, or long-term condition | 20% |
Source: Statistics Canada: You’ve got a friend in me
Data period: First quarter of 2024
Population: People aged 15+ in the Canadian Social Survey target population
Published: July 30, 2024
The identity and disability-related groups overlap with age groups. Their percentages cannot be added to estimate a combined population.
These findings provide a dated demographic baseline. They should be described as 2024 observations, even when quoted in a resource reviewed in 2026. Exact achieved subgroup bases are not stated in this summary. Statistics Canada
How were friendship contact and social connection associated in Canada?
In Statistics Canada’s 2025 survey, always-or-often loneliness was 24% among people with virtual-only friend contact and 15% among those with both virtual and in-person contact.
The survey also found differences in perceived support and friendship satisfaction.
| Statistic ID | Finding | Percentage |
|---|---|---|
| L023 | Virtual-only contact: always or often lonely | 24% |
| L024 | Both contact modes: always or often lonely | 15% |
| L025 | Virtual-only contact: always or often someone to count on | 61% |
| L026 | Both contact modes: always or often someone to count on | 79% |
| L027 | Virtual-only contact: satisfied or very satisfied with friendships | 63% |
| L028 | Both contact modes: satisfied or very satisfied with friendships | 87% |
Source: Statistics Canada: Disconnect to reconnect? How technology is reshaping how Canadians connect with friends, 2025
Fieldwork: April 11–June 22, 2025
Population: People aged 15+ in the ten provinces, with survey exclusions
Published: October 24, 2025
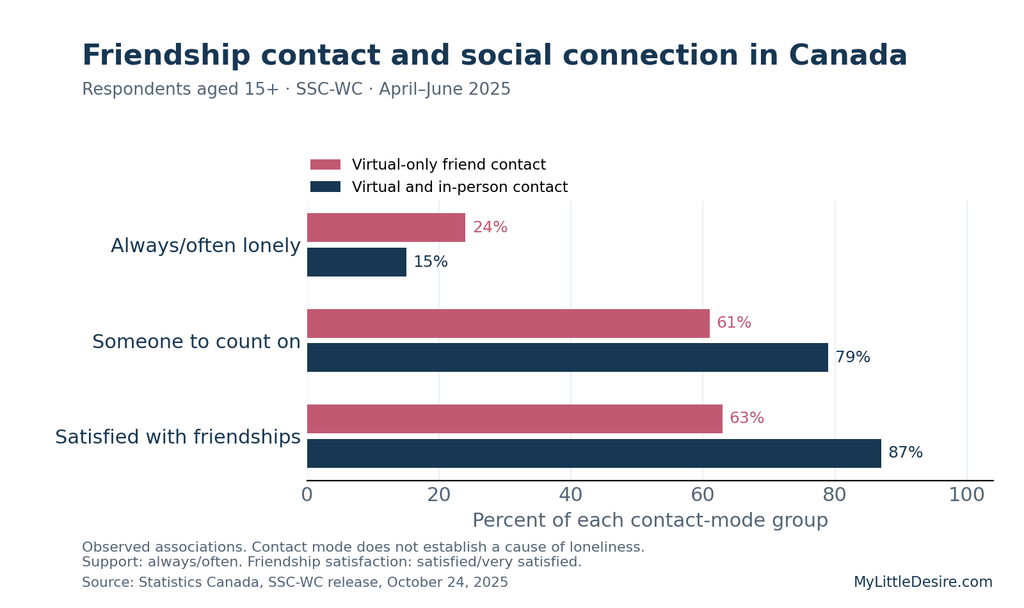
Chart: MyLittleDesire presentation of Statistics Canada findings. Contact patterns describe communication with friends during the preceding month.
What do the differences show?
MyLittleDesire’s subtraction of the published group percentages gives three descriptive differences:
| Outcome | Difference between groups |
|---|---|
| Always-or-often loneliness | 9 percentage points higher in the virtual-only group |
| Always-or-often someone to count on | 18 percentage points higher in the group using both contact modes |
| Friendship satisfaction | 24 percentage points higher in the group using both contact modes |
These calculations use the six observations above. They are not additional survey findings and are excluded from the count of 60.
Does in-person contact cause loneliness to fall?
The survey shows associations between groups. It does not establish that changing an individual’s contact mode would produce the observed differences.
Health, income, geography, and other circumstances can relate to both contact patterns and social connection.
The release does not provide estimates for the small in-person-only group. The survey’s coverage also excludes certain populations, including institutional residents and people living on First Nations reserves and settlements.
What do recent official figures show for England?
England’s Community and Engagement Survey found that 7% of people aged 16 and over felt lonely often or always during October 2025–March 2026.
These are England-specific findings, not estimates for the whole United Kingdom.
How common was direct loneliness?
| Statistic ID | Response | Percentage |
|---|---|---|
| L029 | Often or always lonely | 7% |
| L030 | Never lonely | 20% |
How did loneliness vary by age?
All percentages below refer to feeling lonely often or always.
| Statistic ID | Age group | Percentage |
|---|---|---|
| L031 | 16–24 | 9% |
| L032 | 25–34 | 8% |
| L033 | 35–49 | 7% |
| L034 | 50–64 | 6% |
| L035 | 65–74 | 4% |
| L036 | 75+ | 5% |
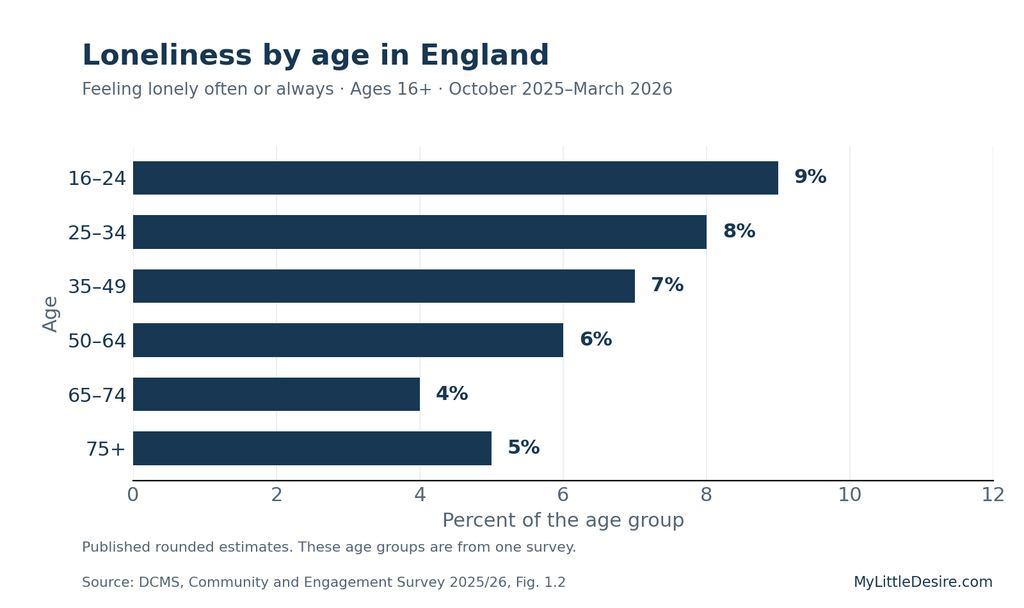
Chart: MyLittleDesire presentation of published, rounded Community and Engagement Survey estimates.
How did direct loneliness vary by disability status and sex?
| Statistic ID | Survey group | Often or always lonely |
|---|---|---|
| L037 | Disabled people | 14% |
| L038 | Non-disabled people | 3% |
| L039 | Females | 7% |
| L040 | Males | 6% |
What did the separate indirect loneliness measure show?
| Statistic ID | Indirect score category | Percentage |
|---|---|---|
| L041 | High: score of 8–9 | 9% |
| L042 | Low: score of 3–4 | 56% |
Source for this section: Community and Engagement Survey 2025/26: Loneliness report
Data period: October 2025–March 2026
Population: People aged 16+ in England
Published: August 14, 2026
The indirect measure combines questions about companionship, exclusion, and isolation. It is separate from the direct frequency question. Percentages are rounded; exact analytic bases require the accompanying data tables. GOV.UK
What do the Australian findings measure?
AIHW’s analysis of the 2024 HILDA survey wave estimated that 15% experienced loneliness under its index definition.
A separate social-isolation index also produced an overall estimate of 15%. Equal rounded percentages do not mean the two indexes identify the same people.
HILDA loneliness-index findings
| Statistic ID | Survey group | Meeting the loneliness threshold |
|---|---|---|
| L043 | Overall, aged 15+ | 15% |
| L044 | Males | 15% |
| L045 | Females | 16% |
| L046 | Aged 35–44 | 17% |
HILDA social-isolation-index findings
| Statistic ID | Survey group | Meeting the social-isolation threshold |
|---|---|---|
| L047 | Overall, aged 15+ | 15% |
| L048 | Males | 18% |
| L049 | Females | 12% |
| L050 | Aged 15–24 | 17% |
Source: Australian Institute of Health and Welfare: Social isolation and loneliness
Data: 2024 HILDA wave
Population: Respondents aged 15+ and the specified subgroups
Page updated: May 12, 2026
HILDA uses responses scored from 1–7. Loneliness uses a three-item index with a median threshold of at least 5; social isolation uses four items with a median threshold of at most 4.
The update date should not be substituted for the survey year. These are AIHW’s published analyses, not MyLittleDesire calculations from respondent microdata. AIHW
What did adults say about technology and relationships in APA’s 2026 poll?
The April 2026 poll found that 53% agreed technology helps preserve relationships that might otherwise lapse.
The following percentages combine strong and moderate agreement with each statement.
| Statistic ID | Perceived effect of technology | Agreement |
|---|---|---|
| L053 | Preserves relationships that might otherwise lapse | 53% |
| L054 | Helps people share thoughts and feelings | 44% |
| L055 | Strengthens existing relationships | 40% |
| L056 | Helps establish new relationships | 40% |
| L057 | Makes relationships less personal | 40% |
| L058 | Contributes to relationship misunderstandings | 36% |
| L059 | Interferes with establishing new relationships | 31% |
Source: American Psychiatric Association: 2026 annual mental health poll
Fieldwork: April 13–15, 2026
Total sample: 2,201 US adults
Respondents could endorse multiple statements. These are perceptions of technology in general, not measured causal effects of a particular platform. psychiatry.org
What does WHO’s global loneliness estimate mean?
WHO summarizes its Commission on Social Connection estimate as 15.8%, or approximately one in six globally.
Its plain-language report identifies a 2014–2023 evidence window. This should not be presented as a new global survey conducted in 2026. who.int
| Statistic ID | Finding | Estimate |
|---|---|---|
| L060 | Global loneliness estimate summarized by WHO, using 2014–2023 evidence | 15.8% |
Sources:
- WHO: Social connection questions and answers, published June 30, 2025.
- WHO Commission report: Plain-language summary, physical PDF pages 4 and 6, corresponding to printed pages 2 and 4.
These are two presentations of the same Commission research and count as one source entry.
The full technical report was inaccessible during verification. Detailed age coverage and modelling methods were not independently checked. This estimate should therefore remain attributed to WHO’s global summary rather than being relabeled as an all-ages census, a US adult rate, or a comparable national ranking.
Which findings can be compared responsibly?
The safest comparisons retain the same instrument, target population, and collection period.
| Comparison | Appropriate interpretation |
|---|---|
| Pew’s younger and older US adults | An age-group comparison within one survey |
| England’s age groups | A comparison using the same direct loneliness question |
| Canada’s friend-contact groups | Associations within one survey; causal effects are not established |
| Gallup’s younger men across countries | A descriptive comparison using a shared question and pooled period |
| Selected Gallup US observations | Historical reference points; not annual averages |
| APA weekly loneliness versus Pew frequent loneliness | Different thresholds; not a direct trend comparison |
| Australian indexes versus Canadian direct frequency | Different measures; not a country ranking |
| WHO global estimate versus a national survey | Different coverage and evidence construction |
Why percentage points matter
Subtracting two percentages gives a percentage-point difference.
For example, the Canadian contact groups’ loneliness estimates were 24% and 15%. Their difference is nine percentage points.
Describing that as a “9% reduction” would change the meaning. Claiming an intervention reduced loneliness would go further still: the survey did not establish that causal effect.
What do these findings mean for relationships and friendship?
The studies cover several dimensions of social connection: perceived loneliness, access to support, friendship satisfaction, and how people communicate.
Those dimensions should stay separate when discussing practical relationship questions. A population statistic cannot determine whether one individual should end a friendship, change a relationship, or alter how they communicate.
For related practical reading, see:
- 10 signs it’s time to end a friendship
- 16 fun things to do at sleepovers with your best friend
- 3 harsh facts about long-distance relationships
These articles provide relationship advice. The research findings in this report come from the original organizations credited beside each table.
How were these statistics selected and verified?
Source selection
This compilation prioritizes original survey releases, government statistics, and official analyses of established datasets.
It includes research from:
- Pew Research Center.
- Gallup.
- Statistics Canada.
- The departments responsible for England’s Community and Engagement Survey.
- The Australian Institute of Health and Welfare.
- The American Psychiatric Association.
- The World Health Organization.
Verification process
Each research record identifies:
- A unique statistic ID.
- The published value and units.
- The original organization and report.
- A direct source URL.
- Publication or update information.
- The collection or evidence period.
- Geography and population coverage.
- Available sample and methodology information.
- A source passage, table, or figure reference.
- Definitions, caveats, and verification status.
Values and context were checked against published source material. Missing analytic or subgroup bases remain unreported rather than being replaced with assumptions.
How the count of 60 was calculated
The count refers to 60 distinct combinations of measure, population, and period.
It does not refer to 60 independent studies.
The key-findings block and charts repeat selected observations for accessibility. They do not increase the count. MyLittleDesire’s three Canadian percentage-point calculations are also excluded from that count.
WHO’s Q&A and plain-language summary are treated as two formats of one source entry.
What MyLittleDesire contributed
MyLittleDesire contributed:
- Organization of findings into accessible topic sections.
- Explanations of measurement differences.
- A comparison guide for selecting an appropriate statistic.
- Four charts based on published observations.
- Clearly labeled arithmetic comparisons.
- A structured provenance database.
MyLittleDesire did not conduct the underlying surveys or independently reproduce their estimates from respondent microdata.
AI assisted research organization and drafting.
Limitations
This is a curated research resource, not a systematic review of every study on loneliness.
Some limitations remain:
- APA’s complete sampling and weighting documentation was unavailable.
- Exact analytic or subgroup samples were not supplied in some public summaries.
- Gallup’s current loneliness row did not separately establish exact field dates and achieved sample.
- WHO’s full technical report was inaccessible during verification.
- Different instruments and survey populations limit comparisons.
- Rounded percentages and sampling uncertainty require careful interpretation.
Older findings remain explicitly dated. A publication’s update year does not turn historical data into a new measurement.
Complete sources
S01 — Pew Research Center
Report: Men, Women and Social Connections
Published: January 16, 2025
Fieldwork: September 3–15, 2024
Coverage: US adults aged 18+
Used for: Frequency categories and age comparisons.
S02 — Gallup
Report: U.S. Depression Rate Remains Elevated
Published: April 21, 2026
Used for: The embedded previous-day loneliness trend table.
Periods used: Selected 2021, 2023, 2024, and February 2026 observations.
S03 — Gallup
Report: Younger Men in the U.S. Among the Loneliest in West
Published: May 20, 2025
Data: Pooled 2023–2024 World Poll findings
Used for: Specified age and gender groups in the US, UK, Canada, and Australia.
S04 — Statistics Canada
Report: You’ve got a friend in me
Published: July 30, 2024
Data: First quarter of 2024 for the loneliness observations
Used for: Canadian demographic comparisons.
S05 — Statistics Canada
Report: Disconnect to reconnect? How technology is reshaping how Canadians connect with friends, 2025
Published: October 24, 2025
Fieldwork: April 11–June 22, 2025
Used for: Friend-contact patterns, loneliness, support, and satisfaction.
S06 — Community and Engagement Survey
Report: Community and Engagement Survey 2025/26: Loneliness report
Published: August 14, 2026
Data: October 2025–March 2026
Coverage: England, aged 16+
Used for: Direct frequency, demographic comparisons, and indirect scores.
S07 — Australian Institute of Health and Welfare
Report: Social isolation and loneliness
Page updated: May 12, 2026
Data used: 2024 HILDA wave
Used for: Separate loneliness and social-isolation indexes.
S08 — American Psychiatric Association
Report: 2026 annual mental health poll
Published: May 12, 2026
Fieldwork: April 13–15, 2026
Used for: Weekly and daily loneliness and relationship-technology perceptions.
S09 — World Health Organization
Research: Commission on Social Connection
Official summary: Social connection questions and answers
Published: June 30, 2025
Supporting format: Plain-language report
Evidence window: 2014–2023
Used for: The summarized global loneliness estimate.
How to cite this report
Suggested citation
MyLittleDesire. Loneliness Statistics 2026: Research-Backed Facts and Trends. Last source review October 14, 2026. https://mylittledesire.com/loneliness-statistics/. Accessed.