
2027 consumer results are not yet available in the sources checked for this edition. Valentine’s Day 2027 is still ahead. This page prepares readers for that holiday using explicitly dated earlier research; none of the figures below is presented as measured 2027 spending or participation. We have not created our own 2027 forecast.
The resource organizes 60 observations from ten original studies and data releases across six research programs, with four sourced charts and a downloadable calculation ledger. It covers spending plans, gift choices, celebration expectations and restaurant transactions. MyLittleDesire contributed source checking, descriptive comparisons and visual presentation; the underlying surveys were conducted by the named original researchers.
What are the most useful Valentine’s Day findings?
- NRF projected US$29.1 billion in total spending for 2026, compared with US$27.5 billion for 2025. These were pre-holiday intentions, not sales receipts. National Retail Federation / Prosper Insights & Analytics.
- Within the same annual series, projected spending on significant others was US$14.5 billion in 2026, slightly below US$14.6 billion in 2025. National Retail Federation / Prosper Insights & Analytics; National Retail Federation / Prosper Insights & Analytics.
- Subtracting the partner category from total planned spending gives US$14.6 billion outside that category in 2026, compared with US$12.9 billion in 2025. This is MyLittleDesire’s residual calculation, not a newly fielded survey. National Retail Federation / Prosper Insights & Analytics; National Retail Federation / Prosper Insights & Analytics.
- NRF’s published average planned gift budget was US$199.78 per person in 2026. It should not be relabeled as a per-household figure. National Retail Federation / Prosper Insights & Analytics.
- 56% of intended celebrators planned candy purchases, 41% flowers and 25% jewelry in NRF’s 2026 research. Yet jewelry had the largest published category budget, US$7 billion. National Retail Federation / Prosper Insights & Analytics.
- In YouGov’s January–February 2026 survey, 59% of adult U.S. citizens viewed the holiday as covering both romantic and platonic relationships. YouGov.
- 45% of partnered adult citizens said they and their partner shared Valentine’s planning equally. YouGov.
- Ipsos found 27% of U.S. adults planned to buy a gift and 26% planned to go on a date in January 2026. Multiple activities could be selected. Ipsos.
- In CIBC’s January 2026 Ipsos poll, 69% of Canadian adults planned to celebrate in some way, while 56% planned to spend money. The 13-point difference compares measures, not an identified group of non-spenders. Ipsos, commissioned by CIBC.
- Among intended Australian gift buyers in a January 2025 survey, men’s published average budget was A$162 and women’s A$110. These are Australian dollars and buyer-group means. Roy Morgan / Australian Retailers Association.
- Toast reported 34% higher restaurant GMV on February 14, 2025 than the average Friday in 2025 among its covered full-service restaurants. This is observed platform activity, rather than a consumer intention. Toast.
- In YouGov’s post-holiday 2024 UK survey, 51% reported they had not celebrated. That snapshot should not be treated as a directly comparable 2026 U.S. or Canadian rate. YouGov.
ALSO READ:-
Relationship Satisfaction, Trust & Communication Statistics 2027
Loneliness Statistics 2027: Data, Sources and Trends
How much did U.S. consumers plan to spend?
The most recent selected NRF release projected US$29.1 billion for Valentine’s Day 2026. Its annual series reported US$27.5 billion for 2025 and US$25.8 billion for 2024.
| ID | Finding | Value | Data period | Original source |
|---|---|---|---|---|
| V020 | Projected total Valentine’s spending in 2024 | 25.8 USD billion | January 2–8, 2024 | National Retail Federation / Prosper Insights & Analytics |
| V015 | Projected total Valentine’s spending in 2025 | 27.5 USD billion | January 2–7, 2025 | National Retail Federation / Prosper Insights & Analytics |
| V001 | Projected total Valentine’s Day spending in 2026 | 29.1 USD billion | January 2–8, 2026 | National Retail Federation / Prosper Insights & Analytics |
| V016 | Published average planned spending per person in 2025 | 188.81 USD per person | January 2–7, 2025 | National Retail Federation / Prosper Insights & Analytics |
| V002 | Published average planned gift spending per person in 2026 | 199.78 USD per person | January 2–8, 2026 | National Retail Federation / Prosper Insights & Analytics |
| V022 | Consumers planning to celebrate in 2024 | 53 percent | January 2–8, 2024 | National Retail Federation / Prosper Insights & Analytics |
| V017 | Consumers planning to celebrate in 2025 | 56 percent | January 2–7, 2025 | National Retail Federation / Prosper Insights & Analytics |
| V003 | Consumers planning to celebrate in 2026 | 55 percent | January 2–8, 2026 | National Retail Federation / Prosper Insights & Analytics |
NRF and Prosper surveyed 8,329 adults in January 2024, 8,020 in January 2025 and 7,791 in January 2026. The observed change in the rounded total projections was US$1.6 billion, or approximately 5.8%, from 2025 to 2026. The published per-person budget rose US$10.97. These comparisons are nominal and do not remove inflation or population changes.
NRF’s public releases provide full sample sizes and report a margin of error, but the consulted summaries do not disclose detailed recruitment, weighting or all item bases. Published averages and national totals should be retained with their original units. Do not multiply a survey percentage by a spending average without a compatible population and methodology.
Did the growth come from romantic partners?
The rounded partner-category budget declined slightly while the overall projection rose. This makes the distinction between total spending and partner spending useful to explain.
| ID | Finding | Value | Data period | Original source |
|---|---|---|---|---|
| V021 | Projected spending on significant others in 2024 | 14.2 USD billion | January 2–8, 2024 | National Retail Federation / Prosper Insights & Analytics |
| V018 | Projected spending on significant others in 2025 | 14.6 USD billion | January 2–7, 2025 | National Retail Federation / Prosper Insights & Analytics |
| V004 | Projected spending on significant others in 2026 | 14.5 USD billion | January 2–8, 2026 | National Retail Federation / Prosper Insights & Analytics |
| V005 | Celebrators planning a gift for a significant other | 83 percent | January 2–8, 2026 | National Retail Federation / Prosper Insights & Analytics |
| V006 | Celebrators planning a gift for a pet | 35 percent | January 2–8, 2026 | National Retail Federation / Prosper Insights & Analytics |
| V019 | Projected spending on pets in 2025 | 1.7 USD billion | January 2–7, 2025 | National Retail Federation / Prosper Insights & Analytics |
| V007 | Projected spending on pets in 2026 | 2.1 USD billion | January 2–8, 2026 | National Retail Federation / Prosper Insights & Analytics |
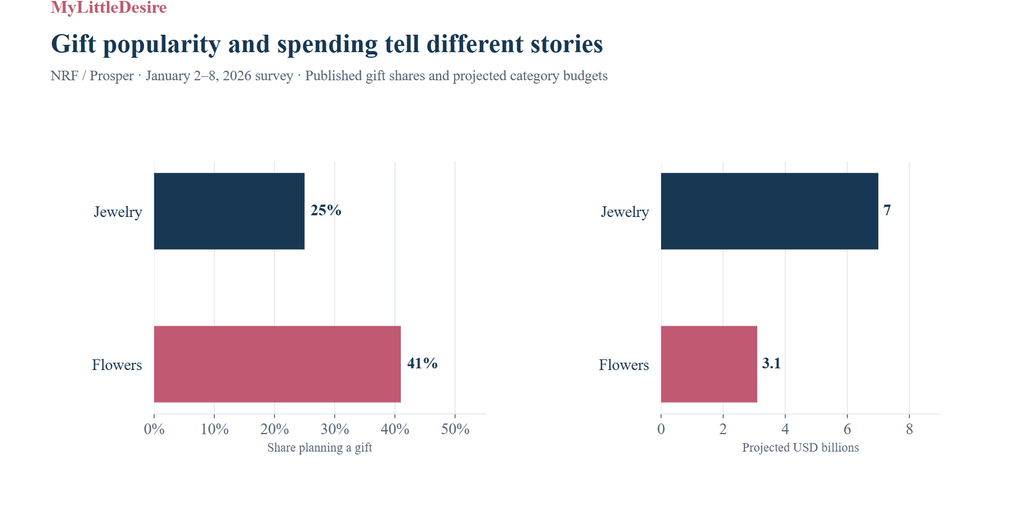
Source: NRF 2026 Valentine’s Day release; full survey n=7,791. Gift shares relate to intended celebrators.
The panels have different units. Do not divide budgets by shares to infer spending per buyer.
Projected category totals are not receipts or 2027 results.
MyLittleDesire presentation of published data.
mylittledesire.com/valentines-day-statistics/
Source: NRF 2026 Valentine’s Day release; full survey n=7,791. Gift shares relate to intended celebrators. The panels have different units. Do not divide budgets by shares to infer spending per buyer. Projected category totals are not receipts or 2027 results. MyLittleDesire presentation of published data. Original sources: National Retail Federation / Prosper Insights & Analytics.
MyLittleDesire calculates total minus partner-category spending as US$12.9 billion for 2025 and US$14.6 billion for 2026. That residual increased by US$1.7 billion, while the partner category changed by approximately −US$0.1 billion. The partner share of the total consequently moved from approximately 53.1% to 49.8%, a difference of about −3.3 percentage points.
“Outside the partner category” is a calculated residual that includes other or unlisted categories and rounding. It should not be renamed “spending on friends and pets.” Nor does it show which individuals redirected their budgets or why they did so. The annual samples are different and these estimates do not establish a statistically significant partner-spending decline.
NRF already describes the broader reach of Valentine’s gifting. Our contribution is the reproducible category arithmetic and its presentation in one chart. We do not claim an exclusive discovery or original fieldwork.
Which gifts are popular, and which account for the largest budgets?
Candy was the most widely planned gift among the selected NRF categories, while jewelry accounted for the largest published dollar budget. A purchase rate and a category spending total answer different questions.
| ID | Finding | Value | Data period | Original source |
|---|---|---|---|---|
| V008 | Celebrators planning to buy candy | 56 percent | January 2–8, 2026 | National Retail Federation / Prosper Insights & Analytics |
| V009 | Celebrators planning to buy flowers | 41 percent | January 2–8, 2026 | National Retail Federation / Prosper Insights & Analytics |
| V010 | Celebrators planning to buy jewelry | 25 percent | January 2–8, 2026 | National Retail Federation / Prosper Insights & Analytics |
| V011 | Projected spending on jewelry | 7 USD billion | January 2–8, 2026 | National Retail Federation / Prosper Insights & Analytics |
| V012 | Celebrators planning an evening out | 39 percent | January 2–8, 2026 | National Retail Federation / Prosper Insights & Analytics |
| V013 | Projected spending on an evening out | 6.3 USD billion | January 2–8, 2026 | National Retail Federation / Prosper Insights & Analytics |
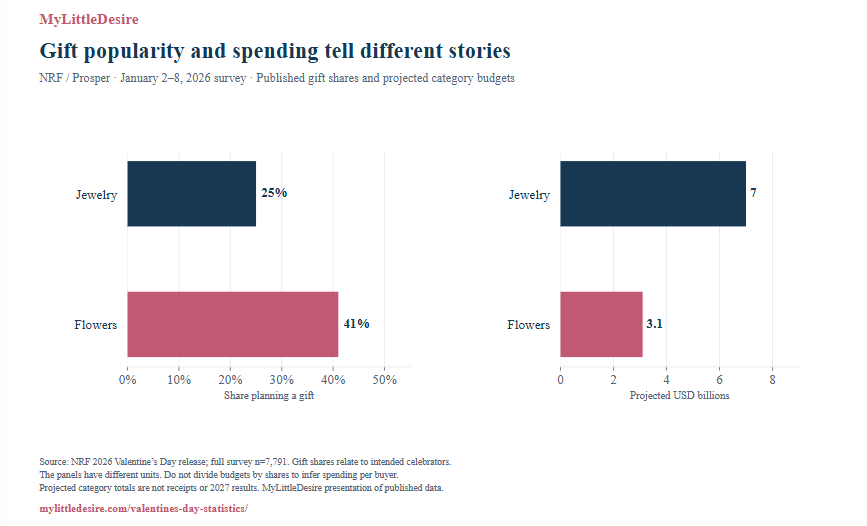
NRF also projected US$3.1 billion for flowers, retained as supporting input I002 in the calculation files. Jewelry’s 25% planned-purchase share was smaller than flowers’ 41%, even as its projected category total was larger. Neither panel gives spending per jewelry or flower buyer: the public data do not supply the compatible item-level counts needed for that calculation.
For readers choosing a present, spending totals are context rather than a suggested budget. They do not measure how much a partner expects, how much someone should spend, or how thoughtful a gift is.
How do Americans plan to celebrate?
Different original surveys provide different views of participation. YouGov’s 2026 adult-citizen survey found 37% planned to celebrate; its partnered subset was more likely to say so. Ipsos asked about specific activities and allowed multiple selections.
| ID | Finding | Value | Data period | Original source |
|---|---|---|---|---|
| V023 | Adult citizens planning to celebrate Valentine’s Day | 37 percent | January 29–February 1, 2026 | YouGov |
| V024 | Partnered adult citizens planning to celebrate | 52 percent | January 29–February 1, 2026 | YouGov |
| V030 | Adults planning to give or receive a gift | 24 percent | January 29–February 1, 2026 | YouGov |
| V033 | Adults planning to buy a gift | 27 percent | January 27–28, 2026 | Ipsos |
| V034 | Adults planning to go out on a date | 26 percent | January 27–28, 2026 | Ipsos |
| V035 | Adults planning a romantic night in | 24 percent | January 27–28, 2026 | Ipsos |
| V036 | Adults planning to buy a card | 16 percent | January 27–28, 2026 | Ipsos |
| V037 | Adults planning to celebrate with friends | 8 percent | January 27–28, 2026 | Ipsos |
| V038 | Adults planning to make a homemade gift | 8 percent | January 27–28, 2026 | Ipsos |
| V039 | Adults selecting they do not plan to celebrate | 31 percent | January 27–28, 2026 | Ipsos |
| V014 | Non-celebrators still planning to mark the occasion in some way | 31 percent | January 2–8, 2026 | National Retail Federation / Prosper Insights & Analytics |
YouGov fielded its survey among 1,114 adult U.S. citizens from January 29 to February 1, 2026. Ipsos Consumer Tracker Wave 133 included 1,085 U.S. adults on January 27–28, 2026, interviewed online in English. NRF’s shopping-focused study used a separate sample and question set.
These samples, eligibility rules and answer options differ. The percentages cannot be pooled or arranged as a trend. Giving or receiving a gift is broader than buying one. Ipsos’s “not planning to celebrate” choice is not automatically the complement of any specific activity, and overlapping activities should not be added together.
Is the holiday only about romantic relationships?
Most adult U.S. citizens in the selected YouGov survey considered the holiday relevant to both romantic and platonic relationships. Its planning and disappointment questions also show why expectations need explicit definitions.
| ID | Finding | Value | Data period | Original source |
|---|---|---|---|---|
| V025 | Adult citizens saying the holiday covers romantic and platonic ties | 59 percent | January 29–February 1, 2026 | YouGov |
| V026 | Women saying the holiday covers romantic and platonic ties | 67 percent | January 29–February 1, 2026 | YouGov |
| V027 | Men saying the holiday covers romantic and platonic ties | 52 percent | January 29–February 1, 2026 | YouGov |
| V028 | Partnered adults reporting equally shared Valentine’s planning | 45 percent | January 29–February 1, 2026 | YouGov |
| V029 | Adults ever disappointed by a partner doing too little for Valentine’s Day | 26 percent | January 29–February 1, 2026 | YouGov |
The women–men difference in the romantic-and-platonic response was 15 percentage points. YouGov already discusses that pattern; this page records the arithmetic for reuse. Equal planning responsibility was measured only among people currently in a romantic or sexual relationship.
The 26% disappointment figure asks about ever having felt let down by a partner, not an event count for Valentine’s Day 2026. A 2021 version of the question lacked a response option included in 2026, so the two should not be presented as a clean historical trend. This hub keeps the focus on Valentine’s expectations; broader relationship satisfaction belongs in a separate relationship research resource.
What do Canadian surveys show about celebration and spending?
CIBC’s Ipsos survey found more people planned to celebrate in some way than planned to spend money. Home meals and quiet evenings were among the reported options.
| ID | Finding | Value | Data period | Original source |
|---|---|---|---|---|
| V040 | Canadians planning to spend money for Valentine’s Day | 56 percent | January 22–26, 2026 | Ipsos, commissioned by CIBC |
| V041 | Dating Canadians planning to spend money | 85 percent | January 22–26, 2026 | Ipsos, commissioned by CIBC |
| V042 | Canadians intending to support local businesses with Valentine purchases | 80 percent | January 22–26, 2026 | Ipsos, commissioned by CIBC |
| V043 | Canadians planning to spend more than the previous year | 12 percent | January 22–26, 2026 | Ipsos, commissioned by CIBC |
| V044 | Canadians planning to celebrate in some way | 69 percent | January 22–26, 2026 | Ipsos, commissioned by CIBC |
| V045 | Canadians planning home-cooked meals | 34 percent | January 22–26, 2026 | Ipsos, commissioned by CIBC |
| V046 | Canadians planning a quiet night in | 33 percent | January 22–26, 2026 | Ipsos, commissioned by CIBC |
| V047 | Canadians planning special dinners or events out | 32 percent | January 22–26, 2026 | Ipsos, commissioned by CIBC |
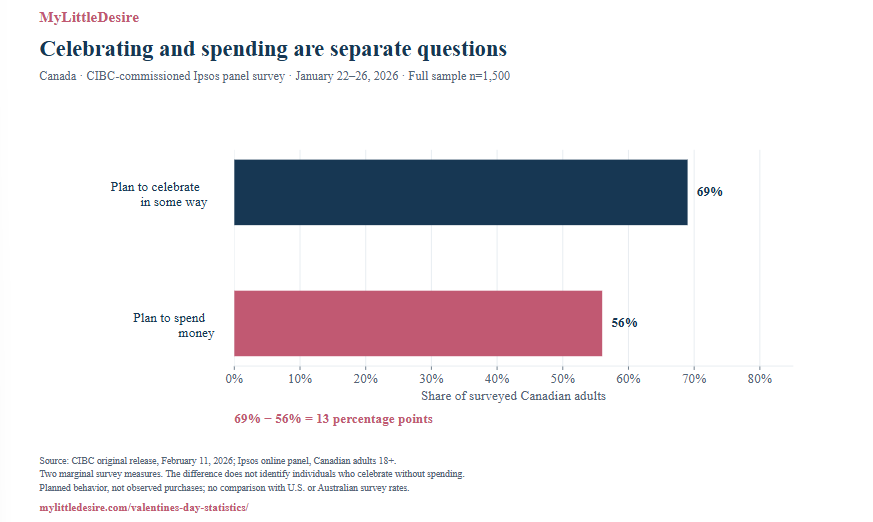
The original CIBC release reports 1,500 Canadian adults, interviewed online from January 22–26, 2026. It discloses Ipsos as the researcher and CIBC as the commissioning organization. Dating respondents had a different spending-intention rate; their achieved subgroup size was not supplied in the release.
Subtracting 56% spending intentions from 69% celebration intentions gives 13 percentage points. Without a cross-tabulation, it does not identify the exact share who planned to celebrate without spending. The release’s local-business and activity percentages also concern intentions; they are not actual retail transaction shares.
What does a Canadian shopper sample add?
A separate Field Agent survey reported higher gifting and dining intentions among its surveyed shoppers. It is useful as shopper context, with narrower generalizability than an adult-population poll.
| ID | Finding | Value | Data period | Original source |
|---|---|---|---|---|
| V059 | Surveyed Canadian shoppers planning to buy Valentine’s items | 78 percent | Not disclosed; published February 2, 2026 | Field Agent Canada |
| V060 | Surveyed Canadian shoppers planning to dine out for a special meal | 51 percent | Not disclosed; published February 2, 2026 | Field Agent Canada |
Field Agent’s February 2, 2026 article reports 2,264 Canadian shoppers. It does not disclose fieldwork dates, detailed recruitment, weights or a full questionnaire. These percentages describe that sample, and are not presented here as national Canadian prevalence.
The same summary reports 44% recalling a dinner out in the prior year. Its 51% dining intention for 2026 is 7 percentage points higher, but this compares a plan with recalled behavior. It is not proof of realized growth, nor a comparison of independently fielded annual surveys. The 44% input is kept separately rather than counted as an extra main statistic.
What did Australian gift buyers plan to spend?
The selected Australian evidence is the 2025 ARA–Roy Morgan survey. It projected A$535 million in gift spending and reported different buyer budgets for men and women.
| ID | Finding | Value | Data period | Original source |
|---|---|---|---|---|
| V048 | Projected Australian spending on Valentine’s gifts in 2025 | 535 AUD million | January 16–23, 2025 | Roy Morgan / Australian Retailers Association |
| V049 | Australians planning to buy Valentine’s gifts in 2025 | 3.8 million people | January 16–23, 2025 | Roy Morgan / Australian Retailers Association |
| V050 | Average planned spend among male gift buyers | 162 AUD per buyer | January 16–23, 2025 | Roy Morgan / Australian Retailers Association |
| V051 | Average planned spend among female gift buyers | 110 AUD per buyer | January 16–23, 2025 | Roy Morgan / Australian Retailers Association |
| V052 | Projected total spending by men | 375 AUD million | January 16–23, 2025 | Roy Morgan / Australian Retailers Association |
| V053 | Projected total spending by women | 160 AUD million | January 16–23, 2025 | Roy Morgan / Australian Retailers Association |
| V054 | Projected Valentine’s gift spending in New South Wales | 210 AUD million | January 16–23, 2025 | Roy Morgan / Australian Retailers Association |
The survey covered 4,361 Australians ages 18+ from January 16–23, 2025, including 480 intended gift buyers. Male and female buyer means differed by A$52, with a descriptive ratio of approximately 1.47×. The subgroup Ns and uncertainty for that comparison were not supplied. The projected male spending total was approximately 70.1% of the overall projected total; that is a budget share, not a participation rate.
Why retain 2025 data? The newer 2026 release and its original PDF contain an unresolved fieldwork-year inconsistency. Its rounded buyer count, mean and total also do not reconcile with simple multiplication, and the source does not supply the adjustments needed to explain the difference. Those figures are withheld rather than silently corrected. This does not establish that the source’s estimates are false; it identifies what could not be verified consistently.
Australian dollars, U.S. dollars, survey spending definitions and age rules differ. This page does not rank national generosity or convert unmatched means into a country comparison.
What do the selected UK observations show?
YouGov’s post-holiday 2024 survey found that 51% of respondents did not celebrate. Among celebrators, 43% reported giving or receiving a card.
| ID | Finding | Value | Data period | Original source |
|---|---|---|---|---|
| V031 | Respondents reporting they did not celebrate Valentine’s Day 2024 | 51 percent | February 19–20, 2024 | YouGov |
| V032 | Celebrators reporting giving or receiving cards in 2024 | 43 percent | February 19–20, 2024 | YouGov |
The online study covered 2,123 adults on February 19–20, 2024. The article describes Britain while its method note says UK; the consulted publication does not include full question tables or the celebrator subgroup size. These older observations are retained with those limits and are not labeled as 2027 or directly compared with U.S. activity questions. Giving or receiving a card is also different from buying one.
What did restaurant transactions actually show?
Toast reported higher full-service restaurant GMV, ticket size and transaction counts on February 14, 2025 than on the average Friday in 2025 within its covered data.
| ID | Finding | Value | Data period | Original source |
|---|---|---|---|---|
| V055 | Full-service restaurant GMV increase on Valentine’s Day 2025 | 34 percent change vs average Friday | February 14, 2025, versus average Friday in 2025 | Toast |
| V056 | Average restaurant ticket size increase | 17 percent change vs average Friday | February 14, 2025, versus average Friday in 2025 | Toast |
| V057 | Restaurant transaction increase | 15 percent change vs average Friday | February 14, 2025, versus average Friday in 2025 | Toast |
| V058 | Restaurant takeout order increase | 19 percent change vs average Friday | February 14, 2025, versus average Friday in 2025 | Toast |
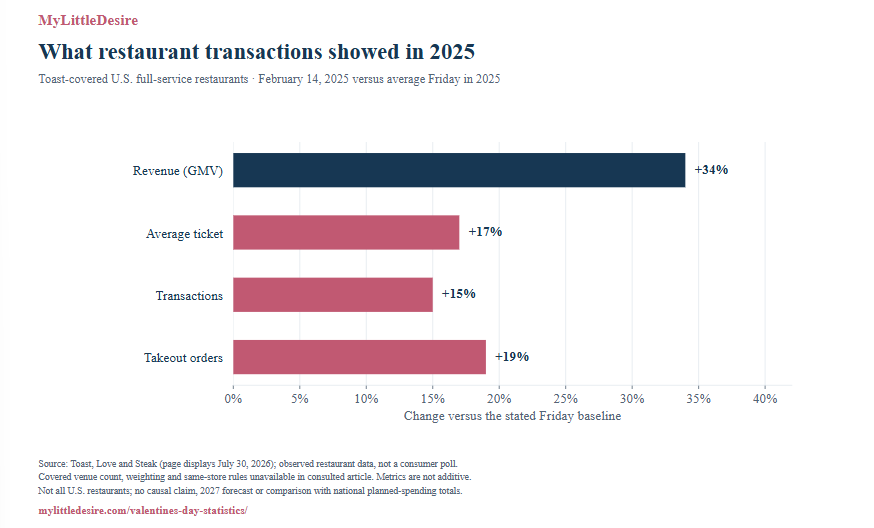
This is a different evidence type from pre-holiday consumer plans. GMV rose 34%, the average ticket 17%, transactions 15% and takeout orders 19% relative to the source’s stated baseline. The metrics are not additive, and rounded aggregate changes need not multiply into an exact decomposition.
The consulted article does not supply the covered venue count, same-store selection or complete weighting rules. These are not estimates for every U.S. restaurant, and they do not identify why individual diners spent more. They should not be combined with NRF’s national spending intentions as if the datasets measure the same outcome.
Which comparisons can publishers reuse?
The calculation ledger includes formulas, input IDs, units, rounding and caveats. The most useful comparisons preserve the original survey or transaction context.
| Comparison | Result | Interpretation |
|---|---|---|
| Overall U.S. planned-spending change | +US$1.6 billion; about +5.8% | 2025 versus 2026 NRF intentions |
| Outside-partner-category change | +US$1.7 billion | Residual: total minus partner category; includes unlisted categories/rounding |
| Partner share change | About −3.3 percentage points | Rounded annual category shares; no individual budget-switching claim |
| Canada celebration/spending measures | 13 percentage points | Different marginal intentions, not an identified no-spend segment |
| Australian male/female buyer budgets | A$52; approximately 1.47× | 2025 intended buyers; subgroup Ns unavailable |
| Shopper dining plan versus prior-year recall | 7 percentage points | Plans and recalled behavior differ; not national realized growth |
These are descriptive comparisons of published estimates. Some components and contrasts were already discussed by the original researchers. MyLittleDesire’s added value is careful selection, a consistent definition table, reproducible calculations and reusable visualizations—not a claim that the underlying facts are exclusive.
How was this research resource compiled?
We prioritized original survey publishers, publicly available question tables and an original transaction-data provider. Each of the 60 research rows records a value, units, source, publication and data period, geography, eligible population, sample information where available, source section/table and caveats. Two supporting inputs and 16 calculations are separated from the 60 main observations.
| Research program | Main observations | Original studies / data releases |
|---|---|---|
| NRF / Prosper annual survey | 22 | 3 |
| YouGov | 10 | 2 |
| Ipsos | 15 | 2 |
| Roy Morgan / ARA | 7 | 1 |
| Toast | 4 | 1 |
| Field Agent Canada | 2 | 1 |
The source mix is transparent: NRF/Prosper contributes 22 observations (36.7%); YouGov contributes 10; Ipsos, including its separate CIBC-commissioned study, contributes 15; Roy Morgan/ARA contributes seven; Toast four; and Field Agent two. Multiple observations are not independent research studies. Sources commissioned by different publishers are not counted as different research organizations when the underlying researcher is the same.
Evidence strength varies. Nonprobability survey weighting is not the same as probability sampling. Ipsos’s tracker describes credibility intervals, including a design-effect adjustment; these are not confidence intervals for our calculated gaps. The Field Agent shopper sample and Toast restaurant coverage have narrower populations than a general adult survey. Original methods should be consulted when reusing a finding.
Complete original sources
National Retail Federation / Prosper Insights & Analytics. Valentine’s Day Spending Expected to Reach New Records. Published: 2026-01-27. Data period: January 2–8, 2026.
National Retail Federation / Prosper Insights & Analytics. NRF Survey: Valentine’s Day Spending Reaches Record $27.5 Billion. Published: 2025-01-28. Data period: January 2–7, 2025.
National Retail Federation / Prosper Insights & Analytics. Valentine’s Day Spending on Significant Others to Reach New Record, NRF Survey Shows. Published: 2024-01-29. Data period: January 2–8, 2024.
YouGov. What Americans think about Valentine’s Day in 2026. Published: 2026; page/article date not extracted in this review. Data period: January 29–February 1, 2026.
Original report / question tables.
YouGov. 6 key takeaways from post Valentine’s Day survey in Britain. Published: 2024; exact publication date not extracted. Data period: February 19–20, 2024.
Ipsos. Ipsos Consumer Tracker, Wave 133 — Valentine’s Day plans. Published: 2026-02-04. Data period: January 27–28, 2026.
Original report / question tables.
Ipsos, commissioned by CIBC. CIBC poll: Valentine’s Day plans and local businesses. Published: 2026-02-11. Data period: January 22–26, 2026.
Roy Morgan / Australian Retailers Association. Love-struck Aussies ready for romance this Valentine’s Day. Published: 2025-02-06. Data period: January 16–23, 2025.
Toast. Love and Steak: How Valentine’s Day 2025 Supercharged Restaurant Revenue. Published: 2026-07-30 as displayed on source. Data period: February 14, 2025, versus average Friday in 2025.
Field Agent Canada. Valentines 2026 Survey. Published: 2026-02-02. Data period: Not disclosed; published February 2, 2026.
How to cite this page
Suggested citation after publication: MyLittleDesire. “Valentine’s Day Statistics 2027: Spending, Gifts and Celebration.” 2027 planning edition. https://mylittledesire.com/valentines-day-statistics/
For a derived calculation, identify it as MyLittleDesire’s descriptive analysis of the named original source. Readers checking an underlying survey should also cite that original researcher.