
How many friends people have, how close those friendships feel, and how much time people can spend together are different questions. This resource brings those measures together while preserving the population, question and fieldwork date behind each finding.
The database contains 60 selected published estimates from eight studies conducted by seven independent research organizations, with four sourced charts and reproducible calculations. YouGov contributes 10 of the 60 main observations; its complete count distributions are supporting inputs rather than additional headline statistics. MyLittleDesire’s contribution is source selection, comparisons and presentation, not original survey fieldwork.
2026 is the review year. Ten selected estimates use 2026 fieldwork; eight use 2025, 22 use 2024 and 20 use 2023. Earlier findings retain their dates. The evidence covers the United States, Canada and the United Kingdom; it does not support a comparable four-country ranking.
What are the key friendship findings?
- 95% of U.S. adults said friendship is essential to a happy and healthy life in AARP’s October–November 2025 survey, published in March 2026. This is a stated belief. AARP Research.
- 54% reported a friend at least 15 years older or younger. This includes intergenerational friends, not only closest friends. AARP Research.
- In the American Friendship Project’s 2023 adult quota sample, 76.2% were satisfied with their friend count and 56.6% with the time available for friends. The descriptive difference is 19.6 percentage points. The sample is not nationally representative. American Friendship Project.
- 47.3% of that friendship-holding sample wanted greater closeness with their friends. Number, time and closeness are separate measures. American Friendship Project.
- 48.9% found making new friends difficult, while 36% found maintaining friendships difficult at that point in life. These are distinct agreement items. American Friendship Project.
- In June 2026, 17% of U.S. adult citizens reported no close friends; 5% preferred none in an ideal world. These are separate distributions, not matched individual responses. YouGov.
- From YouGov’s rounded cells, approximately 24% reported at least five close friends and 42% preferred at least five: an approximate 18-point distribution difference. YouGov.
- 72% of U.S. adults with a close friend outside family were completely or very satisfied with friendship quality in Pew’s July 2023 survey. Pew Research Center.
- 74% of adults with a close friend communicated frequently through any of four modes in Pew’s September 2024 survey; 29% did so in person. Frequent means daily or a few times a week. Pew Research Center.
- 54% of women and 38% of men were extremely or very likely to turn to a friend for emotional support in that survey. This item used all adults, not only friendship holders. Pew Research Center.
- 24% of U.S. adults with high school education or less reported no close friends, compared with 10% of college graduates, in the 2024 American Social Capital Survey. The original researchers already discuss this education gap. Survey Center on American Life.
- 87% of Canadian respondents with mixed virtual/in-person friend contact were satisfied with friendships, versus 63% with virtual-only contact in 2025. This is an association between groups, not an effect of contact. Statistics Canada.
How important are friendships, and how common are cross-generation friends?
AARP’s study found that 95% of U.S. adults regarded friendship as essential to a happy and healthy life, and 54% reported an intergenerational friend.
| ID | Finding | Percent | Fieldwork | Original source |
|---|---|---|---|---|
| F011 | Adults saying friends are essential to a happy and healthy life | 95% | October 23–November 10, 2025 | AARP Research |
| F012 | Adults reporting a friend at least 15 years older or younger | 54% | October 23–November 10, 2025 | AARP Research |
AARP surveyed 1,488 adults ages 18+ from October 23 to November 10, 2025. The research was first published March 6, 2026; its summary was updated June 19. The publisher describes a nationally representative online survey weighted by generation. Only the two explicit percentages verified in its original research summary are used here; the full questionnaire and report were not retrieved.
A friend at least 15 years older or younger is different from a closest friend outside one’s age group. Neither percentage measures a medical benefit or establishes that a particular friendship causes better health.
How many close friends do adults have, and how many would they prefer?
YouGov’s June 2026 U.S. citizen survey found 17% had no close friends, while 5% ideally preferred none. In separate U.S. surveys with different methods, Pew and the Survey Center on American Life found different no-friend percentages.
| ID | Finding | Percent | Fieldwork | Original source |
|---|---|---|---|---|
| F001 | Adults reporting no close friends | 17% | June 5–9, 2026 | YouGov |
| F002 | Adults preferring no close friends in an ideal world | 5% | June 5–9, 2026 | YouGov |
| F023 | Adults reporting no close friends outside family | 8% | July 17–23, 2023 | Pew Research Center |
| F024 | Adults reporting one to four close friends outside family | 53% | July 17–23, 2023 | Pew Research Center |
| F025 | Adults reporting five or more close friends outside family | 38% | July 17–23, 2023 | Pew Research Center |
| F043 | Adults reporting no close friends outside relatives | 17% | March 29–April 15, 2024 | Survey Center on American Life |
| F044 | Adults reporting six or more close friends outside relatives | 25% | March 29–April 15, 2024 | Survey Center on American Life |
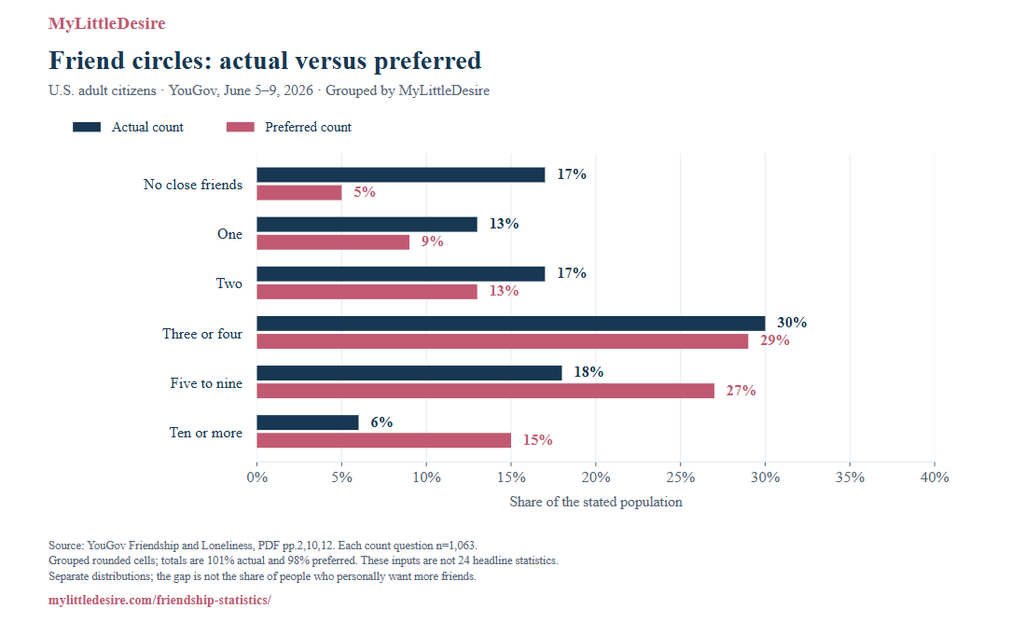
The chart groups YouGov’s original response categories into practical count bands. Adding the rounded cells gives approximately 24% with five or more close friends and 42% preferring five or more, a difference of about 18 percentage points. Both count questions had 1,063 responding participants; the full survey had 1,066. The detailed distributions total 101% actual and 98% preferred because of rounding.
This calculation compares two population distributions. It does not establish that 18% of individuals want more friends, and it does not permit a reliable average friend count because the highest category is open-ended. The complete 24 count cells are available in the separate calculation-input CSV and are excluded from the count of 60 main statistics.
Why do the U.S. no-friend estimates differ?
| Study | Population and definition | Fieldwork | No close friends |
|---|---|---|---|
| Pew | U.S. adults; close friends outside family | July 2023 | 8% |
| Survey Center on American Life | U.S. adults; close friends outside relatives | March–April 2024 | 17% |
| YouGov | U.S. adult citizens; self-reported close friends | June 2026 | 17% |
The sampling frames, panels, exact wording and responding bases differ. These are survey snapshots; their percentages should not be joined into a trend line or averaged into a single national estimate. The Survey Center’s published six-plus estimate is 25%; adding its separately rounded questionnaire categories can produce 26%, so this article preserves the published combined estimate.
Are people satisfied with the number, quality and time in their friendships?
Satisfaction with friend counts exceeded satisfaction with time available in the American Friendship Project. Pew separately found that most adults with a close friend were highly satisfied with friendship quality.
| ID | Finding | Percent | Fieldwork | Original source |
|---|---|---|---|---|
| F013 | Participants wanting greater closeness with their friends | 47.3% | June 9–24, 2023 | American Friendship Project |
| F014 | Participants reporting they and their friends are not getting along | 6.7% | June 9–24, 2023 | American Friendship Project |
| F015 | Participants agreeing that friends celebrate their good news | 86.7% | June 9–24, 2023 | American Friendship Project |
| F017 | Participants satisfied with their number of friends | 76.2% | June 9–24, 2023 | American Friendship Project |
| F018 | Participants satisfied with the time they can spend with friends | 56.6% | June 9–24, 2023 | American Friendship Project |
| F026 | Adults with a close friend completely or very satisfied with friendship quality | 72% | July 17–23, 2023 | Pew Research Center |
| F027 | Friendship holders ages 50+ completely or very satisfied with quality | 77% | July 17–23, 2023 | Pew Research Center |
| F028 | Friendship holders under 50 completely or very satisfied with quality | 67% | July 17–23, 2023 | Pew Research Center |
| F029 | Adults with five or more close friends highly satisfied with friendship quality | 81% | July 17–23, 2023 | Pew Research Center |
| F030 | Adults with one to four close friends highly satisfied with friendship quality | 65% | July 17–23, 2023 | Pew Research Center |
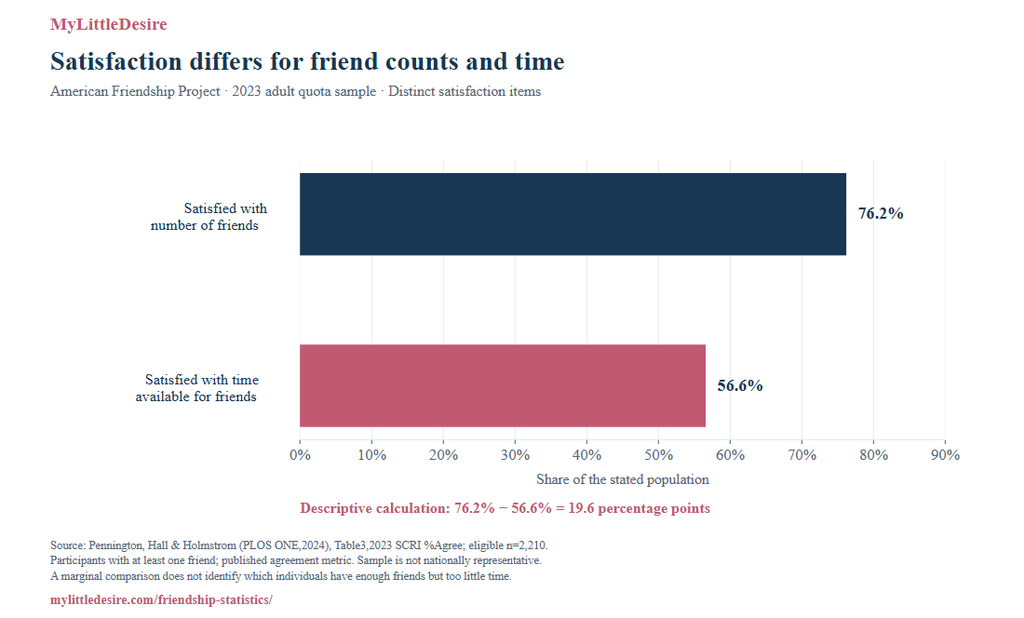
In Table 3’s 2023 adult quota sample of 2,210 friendship holders, agreement with number satisfaction was 76.2%, versus 56.6% for time satisfaction: 76.2 − 56.6 = 19.6 percentage points. Meanwhile, 47.3% agreed that they wanted more closeness, and 86.7% said friends celebrated their good news. These findings cover different parts of friendship quality.
The authors explicitly caution that this quota sample is not representative of all Americans. They report percent agreement on a seven-point scale; the exact combined agreement cutoff is not specified in the consulted table. These are their published agreement percentages, not newly calculated response categories.
The 19.6-point contrast is a difference between marginal item percentages. Without respondent-level data, it cannot show how many people personally have enough friends but too little time. It also does not establish a statistically significant gap. MyLittleDesire supplies the arithmetic, source definitions and reusable chart.
Pew’s quality-satisfaction item had 4,618 eligible respondents with at least one close friend outside family. Older friendship holders reported higher satisfaction than younger adults, and people with more close friends reported higher satisfaction than those with fewer. Pew already describes these associations; they are not evidence that gaining friends necessarily increases satisfaction.
How difficult is it to make and maintain friends?
In the American Friendship Project, 48.9% of eligible 2023 participants agreed that making new friends was difficult and 36% said maintaining friendships was difficult at that point in life. YouGov’s 2026 survey used a different difficulty question.
| ID | Finding | Percent | Fieldwork | Original source |
|---|---|---|---|---|
| F003 | Making new friends: very easy | 15% | June 5–9, 2026 | YouGov |
| F004 | Making new friends: somewhat easy | 23% | June 5–9, 2026 | YouGov |
| F005 | Making new friends: somewhat difficult | 20% | June 5–9, 2026 | YouGov |
| F006 | Making new friends: very difficult | 14% | June 5–9, 2026 | YouGov |
| F007 | Ages 30–44: making new friends is very difficult | 21% | June 5–9, 2026 | YouGov |
| F008 | Ages 65+: making new friends is very difficult | 6% | June 5–9, 2026 | YouGov |
| F016 | Participants finding it difficult to maintain friendships at this point in life | 36% | June 9–24, 2023 | American Friendship Project |
| F019 | Participants finding it difficult to make new friends | 48.9% | June 9–24, 2023 | American Friendship Project |
| F020 | Participants saying it was easier to make friends at another point in life | 65.6% | June 9–24, 2023 | American Friendship Project |
| F021 | Participants finding close-relationship maintenance difficult or frustrating in the past year | 37.1% | June 9–24, 2023 | American Friendship Project |
| F022 | Participants satisfied with how they maintained friendships in the past year | 62.9% | June 9–24, 2023 | American Friendship Project |
YouGov’s ease/difficulty categories describe all surveyed adult citizens, including people without close friends. “Very difficult” was reported by 21% of ages 30–44 and 6% of ages 65+. The AFP percentages are agreement items among people with a friend in a nonrepresentative quota sample. The two studies should not be combined into a trend or treated as the same scale.
For publishers, friend formation and maintenance can be discussed separately: starting a new relationship, keeping contact going and feeling satisfied with maintenance are not interchangeable outcomes. Cross-sectional age differences do not prove that an individual will find friendships easier as they age.
Does preferred closeness differ by age?
YouGov found a preference for very close friendships among 41% of U.S. adult citizens ages 18–29 and 16% of those ages 65+ in June 2026.
| ID | Finding | Percent | Fieldwork | Original source |
|---|---|---|---|---|
| F009 | Ages 18–29: prefer very close friendships | 41% | June 5–9, 2026 | YouGov |
| F010 | Ages 65+: prefer very close friendships | 16% | June 5–9, 2026 | YouGov |
This is a preference question, not a measurement of current intimacy or a count of people whose needs are unmet. The source supplies age-group responding bases in its tables; the research download preserves them. The age contrast is 25 percentage points, calculated from the two published estimates.
How often do friends communicate, and through which channels?
Pew found that 74% of U.S. adults with a close friend communicated frequently through at least one of four modes, compared with 61% by text and 29% in person.
| ID | Finding | Percent | Fieldwork | Original source |
|---|---|---|---|---|
| F035 | Men with close friends: frequent phone/video contact | 32% | September 3–15, 2024 | Pew Research Center |
| F036 | Women with close friends: frequent phone/video contact | 38% | September 3–15, 2024 | Pew Research Center |
| F037 | Men with close friends: frequent in-person contact | 31% | September 3–15, 2024 | Pew Research Center |
| F038 | Women with close friends: frequent in-person contact | 28% | September 3–15, 2024 | Pew Research Center |
| F039 | Adults with close friends: frequent contact through at least one of four contact modes | 74% | September 3–15, 2024 | Pew Research Center |
| F040 | Adults with close friends: frequent contact through text messages | 61% | September 3–15, 2024 | Pew Research Center |
| F041 | Adults with close friends: frequent in-person contact | 29% | September 3–15, 2024 | Pew Research Center |
| F042 | Adults with a close friend communicating by phone or video at least a few times a week | 35% | September 3–15, 2024 | Pew Research Center |
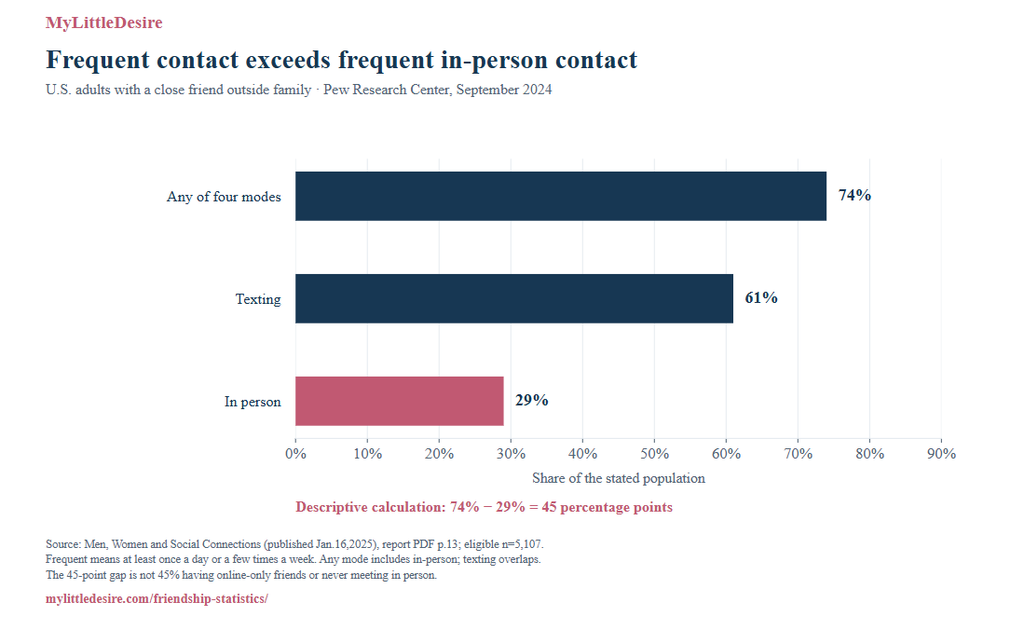
The survey took place September 3–15, 2024 and was published January 16, 2025. Its contact questions had 5,107 eligible respondents. “Frequent” combines at least once a day with a few times a week; the four modes were text messages, social media, phone/video and in-person meetings.
The difference between frequent any-mode and frequent in-person communication is 74 − 29 = 45 percentage points. Any-mode includes in-person contact, while texting and phone/video can overlap. The gap does not measure online-only friendships, people who never meet, or time spent together. Preserve Pew’s published 61% texting estimate rather than replacing it with a sum of separately rounded categories.
What do friendship conversations reveal about emotional support?
Pew’s September 2024 survey found that women were more likely than men to say they would turn to a friend for emotional support. Its July 2023 survey separately found women more likely to discuss mental health frequently with friends.
| ID | Finding | Percent | Fieldwork | Original source |
|---|---|---|---|---|
| F031 | Women with a close friend discussing mental health extremely often or often | 31% | July 17–23, 2023 | Pew Research Center |
| F032 | Men with a close friend discussing mental health extremely often or often | 15% | July 17–23, 2023 | Pew Research Center |
| F033 | Men: extremely/very likely to turn to a friend for emotional support | 38% | September 3–15, 2024 | Pew Research Center |
| F034 | Women: extremely/very likely to turn to a friend for emotional support | 54% | September 3–15, 2024 | Pew Research Center |
| F053 | Adults who would first turn to a close friend with a personal problem | 11% | March 29–April 15, 2024 | Survey Center on American Life |
The emotional-support likelihood item used all adult respondents in 2024. The mental-health conversation item used adults who had a close friend in 2023. The Survey Center’s 2024 question asked whom someone would turn to first for a personal problem: 11% selected a close friend. “First choice,” willingness to seek help and actual conversation frequency answer different questions.
Pew already reports the gender patterns. Their inclusion here makes the definitions and source dates convenient to cite; it does not establish an explanation for the differences or imply that men’s friendships lack support.
How do education and proximity relate to friendship networks?
The 2024 American Social Capital Survey found fewer close friends among adults with high school education or less than among college graduates. It also found that many adults’ friends did not live nearby.
| ID | Finding | Percent | Fieldwork | Original source |
|---|---|---|---|---|
| F045 | Adults with high school education or less reporting no close friends | 24% | March 29–April 15, 2024 | Survey Center on American Life |
| F046 | College graduates reporting no close friends | 10% | March 29–April 15, 2024 | Survey Center on American Life |
| F047 | Adults with high school education or less reporting at least six close friends | 17% | March 29–April 15, 2024 | Survey Center on American Life |
| F048 | College graduates reporting at least six close friends | 33% | March 29–April 15, 2024 | Survey Center on American Life |
| F049 | Adults reporting most or all close friends live nearby | 25% | March 29–April 15, 2024 | Survey Center on American Life |
| F050 | Adults reporting few or none of their close friends live nearby | 44% | March 29–April 15, 2024 | Survey Center on American Life |
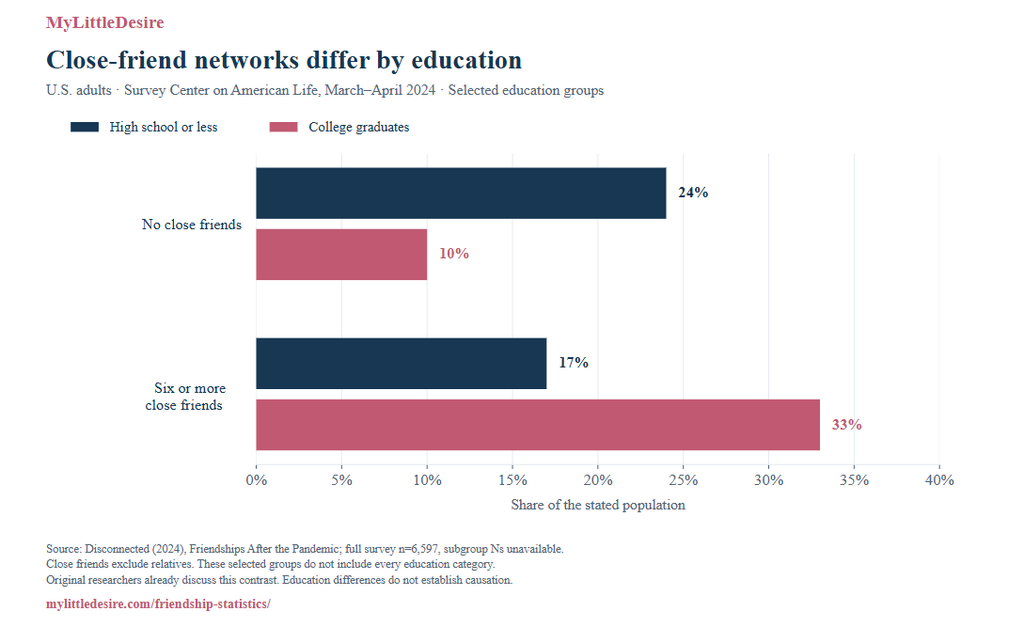
The study interviewed 6,597 U.S. adults from March 29 to April 15, 2024, using Ipsos KnowledgePanel probability sampling. No-close-friend prevalence differed by 14 points between the two selected education groups; six-plus-friend prevalence differed by 16 points in the opposite direction. The researchers already discuss these contrasts.
These are high school or less versus college graduates, not every person without a college degree versus every graduate. Some-college respondents are not represented by either label. Education-specific sample sizes were unavailable in the consulted materials, and education is associated with many other circumstances; no causal schooling effect is inferred.
The nearby-friend question was asked of all respondents, including those reporting no close friends. The 25% “most or all nearby” and 44% “few or none nearby” estimates should therefore not be re-labeled as percentages among friendship holders only.
What support is available beyond friends alone?
The American Social Capital Survey found that 66% of adults had at least a couple people available to listen and support them, 50% had people who could care for them when sick and 57% had people who could lend them $200.
| ID | Finding | Percent | Fieldwork | Original source |
|---|---|---|---|---|
| F051 | Adults with at least a couple people available for emotional support | 66% | March 29–April 15, 2024 | Survey Center on American Life |
| F052 | Adults with at least a couple people who could care for them if sick | 50% | March 29–April 15, 2024 | Survey Center on American Life |
| F054 | Adults with at least a couple people who could lend them $200 | 57% | March 29–April 15, 2024 | Survey Center on American Life |
These questions concerned people in the respondent’s life, which can include partners, relatives and friends. They offer context about practical support networks; they do not measure support from friends alone. Availability of help, friendship count and friendship quality should remain separate in any quotation or chart.
What does Canadian research show about friendship quality?
Statistics Canada found higher friendship satisfaction among people who had both virtual and in-person friend contact than among those with virtual-only contact in the preceding month.
| ID | Finding | Percent | Fieldwork | Original source |
|---|---|---|---|---|
| F055 | Mixed-contact group: satisfied/very satisfied with friendships | 87% | April 11–June 22, 2025 | Statistics Canada |
| F056 | Virtual-only group: satisfied/very satisfied with friendships | 63% | April 11–June 22, 2025 | Statistics Canada |
| F057 | Mixed-contact group: always/often has people to depend on | 79% | April 11–June 22, 2025 | Statistics Canada |
| F058 | Virtual-only group: always/often has people to depend on | 61% | April 11–June 22, 2025 | Statistics Canada |
The April 11–June 22, 2025 survey covered people ages 15+ in Canada’s ten provinces, with exclusions for institutional residents and residents of First Nations reserves or settlements. Territories were excluded. Virtual contact includes telephone and Internet communication; it is broader than app use. Achieved outcome-group sample sizes were not supplied in the consulted release.
The friendship-satisfaction difference was 24 percentage points; the dependable-support difference was 18 points. Support can come from anyone, and these are cross-sectional associations. The original release already presents the pairs; no contact intervention or causal benefit is demonstrated.
For loneliness prevalence, demographic differences and associated factors, see our Loneliness Statistics research. This Friendship Hub focuses on friends, quality, contact and support rather than repeating that hub’s loneliness outcome comparisons.
What does recent UK research show about having no close friends?
The Belonging Forum’s 2026 release reported no close friends among 15% of adults ages 45–64 and 5% of ages 18–34.
| ID | Finding | Percent | Fieldwork | Original source |
|---|---|---|---|---|
| F059 | UK adults ages 18–34: no close friends | 5% | December 1–17, 2025 | Belonging Forum / Opinium |
| F060 | UK adults ages 45–64: no close friends | 15% | December 1–17, 2025 | Belonging Forum / Opinium |
The Opinium study surveyed 10,001 UK adults in December 1–17, 2025. The original release already describes the three-times age contrast. Exact age-question bases and full item wording were unavailable in the consulted release; ages 18–34 are an age group and should not be relabeled exclusively as Gen Z.
The study’s friendship-satisfaction values were omitted because the report and press release gave conflicting overall figures without enough information to reconcile them. The UK estimates should not be ranked against U.S. percentages from different instruments and sampling frames.
What does MyLittleDesire’s comparison work add?
The useful addition is a reproducible collection of definitions, inputs and visual comparisons that publishers can check in one place. It is not a set of new survey discoveries.
| Comparison | Calculation | Interpretation | Contribution |
|---|---|---|---|
| Number versus time satisfaction | 76.2 − 56.6 = 19.6 percentage points | Same AFP eligible sample; different items; no individual shortfall identified | Descriptive cross-item synthesis and chart |
| Actual versus preferred five-plus share | About 24% versus 42%; about 18 points | Grouped rounded YouGov cells; separate distributions | Reproducible grouping and presentation |
| Frequent any-mode versus in-person contact | 74 − 29 = 45 percentage points | Pew contact base and same frequency threshold; modes overlap | Arithmetic and source-aligned visualization |
| Education and no close friends | 24 − 10 = 14 percentage points | Selected education groups; no causal interpretation | Already discussed by original researchers; reuse table/chart |
| Education and six-plus close friends | 33 − 17 = 16 percentage points | Selected education groups; subgroup uncertainty unavailable | Already discussed by original researchers; reuse table/chart |
The calculations download also preserves the requested Canadian immigration precision checks as context-only appendix rows: 15.6 − 8.4 = 7.2 percentage points, and 15.6 ÷ 8.4 is approximately 1.86×. They are not promoted as headline friendship discoveries. Their underlying one-decimal inputs come from Statistics Canada’s original Table 1.
How were the sources selected and verified?
We selected original research relevant to friend counts, quality, forming and maintaining friendships, communication and support. Government releases, original survey reports and a peer-reviewed study were checked against their available tables or question documents. AARP’s two estimates were checked in its own publisher summary; its full report was unavailable. Each research row includes a direct source, publication and fieldwork dates, geographic and population coverage, sample information where available, a source passage/table reference and caveats.
| Organization | Main statistics | Studies | Fieldwork used |
|---|---|---|---|
| YouGov | 10 | 1 | 2026 |
| AARP Research | 2 | 1 | 2025 |
| American Friendship Project | 10 | 1 | 2023 |
| Pew Research Center | 20 | 2 | 2023 and 2024 |
| Survey Center on American Life | 12 | 1 | 2024 |
| Statistics Canada | 4 | 1 | 2025 |
| Belonging Forum / Opinium | 2 | 1 | 2025 |
The 27-row input file contains YouGov’s 24 complete count cells and three Canadian immigration contact cells. Those supporting rows are not counted again as headline observations. The 24 calculations are recorded separately, rounded for readers and labeled by their contribution. Some reproduce differences already discussed by the original researchers. No new nationally representative fieldwork, scientific discovery or exclusivity is claimed.
What are the main limitations?
- Dates, target populations, friend definitions and question scales differ. Do not average studies, build unmatched country rankings or label separate survey snapshots as a trend.
- AFP uses a quota sample and is not nationally representative. AARP’s original summary describes national representation; the underlying recruitment protocol and question bases were not retrieved.
- Canada achieved group Ns, UK age-question bases and some U.S. subgroup Ns were unavailable. Full-sample margins of error are not uncertainty intervals for calculated differences.
- Marginal item differences do not identify individual unmet needs. Most evidence is self-reported and observational; association does not establish causation.
- Whole-percent rounding affects summed categories. Ratios are descriptive prevalence ratios; they are not prospective risks.
- Australia is a target readership market, but no sufficiently comparable Australian observation was selected for this edition. No guaranteed backlink, ranking or AI citation outcome is implied.
Download the research and charts
The research files provide published estimates and calculation inputs in machine-readable form. The comparison CSV includes readable results, formulas and novelty labels. Original reports remain the authority for their own data.
Publishers may reuse MyLittleDesire’s charts with attribution, a link to this resource and the original-source credit retained. Please preserve the population, fieldwork and caveat notes. This permission applies to our visual presentation; original researchers retain rights to their reports and graphics.
Complete original sources
FS06 — AARP Research. The Friendship Study. Publication: 2026-03-06; original publisher summary updated 2026-06-19. Fieldwork: October 23–November 10, 2025.
FS07 — American Friendship Project (Pennington, Hall and Holmstrom). The American Friendship Project: A report on the status and health of friendship in America. Publication: 2024-07-30. Fieldwork: June 9–24, 2023; selected estimates from 2023 SCRI sample only.
FS08 — Pew Research Center. What does friendship look like in America?. Publication: 2023-10-12. Fieldwork: July 17–23, 2023.
FS02 — Pew Research Center. Men, Women and Social Connections: emotional support and communication. Publication: 2025-01-16. Fieldwork: September 3–15, 2024.
Original report PDF · Questionnaire / topline.
FS01 — YouGov. Friendship and Loneliness: June 5–9, 2026 poll results. Publication: 2026; exact publication date not stated in PDF. Fieldwork: June 5–9, 2026.
FS09 — Survey Center on American Life (AEI). Disconnected: The Growing Class Divide in American Civic Life. Publication: 2024-08-22. Fieldwork: March 29–April 15, 2024.
FS03 — Statistics Canada. Disconnect to reconnect? How technology is reshaping how Canadians connect with friends, 2025. Publication: 2025-10-24. Fieldwork: April 11–June 22, 2025.
FS04 — Belonging Forum; survey conducted by Opinium. 2026 Belonging Barometer: midlife friendship press release and methodology. Publication: 2026-03-13. Fieldwork: December 1–17, 2025.
How to cite this resource
Suggested citation after publication: MyLittleDesire. “Friendship Statistics 2026: Friend Counts, Quality and Connection.” https://mylittledesire.com/friendship-statistics/. If citing a derived comparison or chart, identify it as MyLittleDesire’s calculation or presentation of the named original study. Readers verifying an underlying survey should also cite and consult its original source.