Online dating statistics describe different things: trying an app at any point, using it now, visiting a service in a particular month, or forming a relationship with someone met online. A percentage is useful only when its population, question and date are clear.
This report brings together 60 distinct observations from six original research publications, with four charts and links to the underlying sources. 36 observations use 2026 fieldwork, 11 use May 2025 audience measurement, four use January 2024 fieldwork, seven use July 2022 fieldwork and two use a selected 2018 Canadian survey sample. The year in the title is the review year. MyLittleDesire compiled published findings and did not conduct these surveys.
Key findings
- 37% of U.S. adults had ever used a dating site or app. Data: January 2026. SSRS, 2026-02-02.
- 6% of U.S. adults were currently using a dating site or app. Data: January 2026. SSRS, 2026-02-02.
- 51% of U.S. adults ages 18–29 had ever used dating sites/apps. Data: January 2026. SSRS, 2026-02-02.
- 10% of U.S. adults ages 18–29 were currently using dating sites/apps. Data: January 2026. SSRS, 2026-02-02.
- 48% of U.S. online-dating ever-users had tried Tinder. This is lifetime brand use. Data: January 2026. SSRS, 2026-02-02.
- 51% of U.S. ever-users rated shared family values very important in an online match. Data: January 2026. SSRS, 2026-02-02.
- 58% of U.S. ever-users named finding an exclusive romantic partner as their main reason for using dating sites/apps. Data: January 2026. SSRS, 2026-02-02.
- 50% of U.S. ever-users had at some point formed a committed relationship with someone met through a dating site/app. Data: January 2026. SSRS, 2026-02-02.
- 47% of U.S. ever-users described apps’ overall effect on their dating and relationships as neither positive nor negative. Data: January 2026. SSRS, 2026-02-02.
- 57% of U.S. adults believed meeting a dating-site/app contact in person was very or somewhat safe. This measures perception. Data: January 2026. SSRS, 2026-02-02.
- 11% of UK online adults visited a measured dating service during the month. Data: May 2025. Ofcom / Ipsos iris, 2025-12-10.
- 11% of GB adults with relationship experience met their current or most recent partner through a dating app. Data: July 2026. YouGov, 2026-08-17.
- 70% of Australian adults had never used a dating app in YouGov’s survey. Data: January 2024; historical. YouGov, 2024-04-19.
- 48% of U.S. dating-site/app ever-users reported at least one of four unwanted platform behaviors in Pew’s survey. Data: July 2022; historical. Pew Research Center, 2023-02-02.
Which online dating statistic should a writer use?
Use all-adult current-use estimates for how many people are using dating sites/apps now. Use ever-user percentages for lifetime platform experience. Use audience measurement for service visits. Use partner-meeting questions for the origin of a particular relationship. These denominators are not interchangeable.
| Source | What it measures | Data period |
|---|---|---|
| SSRS | U.S. lifetime/current use; ever-users’ platforms, motives and outcomes; public beliefs. | January 2026 |
| Ofcom / Ipsos iris | Monthly dating-service reach among UK internet users ages 18+. | May 2025 |
| YouGov, Great Britain | How relationship-experienced adults met their current or most recent partner. | July 2026 |
| YouGov, Australia | Lifetime app non-use and barriers among eligible single non-users. | January 2024 |
| Qian and Hu, Canada | Meeting channels within selected different-sex relationships formed 1996–2018. | 2018 survey |
| Pew Research Center | Ever paying, unwanted experiences and suspected scam encounters among U.S. ever-users. | July 2022 |
The research sheet records each finding’s source location, population, definition, available sample information and caveats. The Canadian figures describe a selected historical sample; they do not establish national dating-app use in 2026.
How many Americans use online dating sites or apps in 2026?
SSRS found that 37% of U.S. adults had ever used a dating site or app, while 6% were using one currently. The first percentage includes people who stopped using these services years ago.
| Finding | Percent | Data period |
|---|---|---|
| U.S. adults who have ever used a dating site or app | 37% | January 2026 |
| U.S. adults currently using a dating site or app | 6% | January 2026 |
Source: SSRS, 2026-02-02. Topline PDF pages 1–2, SPOT6 and the combined SPOT6/SPOT7 table. Fieldwork: January 2–4 and January 16–20, 2026; n=2,012 adults ages 18 and older.
The survey’s current-use question also has a separate denominator among ever-users. This report uses the published 6% all-adult estimate for current use. It does not calculate that estimate by multiplying rounded percentages.
How does dating-site and app use differ by age?
Lifetime use was reported by 51% of adults ages 18–29, 53% of adults ages 30–49 and 20% of adults ages 50 and older. Current use was lower in every age group: 10%, 8% and 2%, respectively.
| Finding | Percent | Data period |
|---|---|---|
| U.S. adults ages 18–29 who have ever used dating sites/apps | 51% | January 2026 |
| U.S. adults ages 30–49 who have ever used dating sites/apps | 53% | January 2026 |
| U.S. adults ages 50+ who have ever used dating sites/apps | 20% | January 2026 |
| U.S. adults ages 18–29 currently using dating sites/apps | 10% | January 2026 |
| U.S. adults ages 30–49 currently using dating sites/apps | 8% | January 2026 |
| U.S. adults ages 50+ currently using dating sites/apps | 2% | January 2026 |
Source: SSRS, 2026-02-02. Opening age comparison. Each percentage refers to its stated age group; exact achieved age-specific answering bases were not supplied.
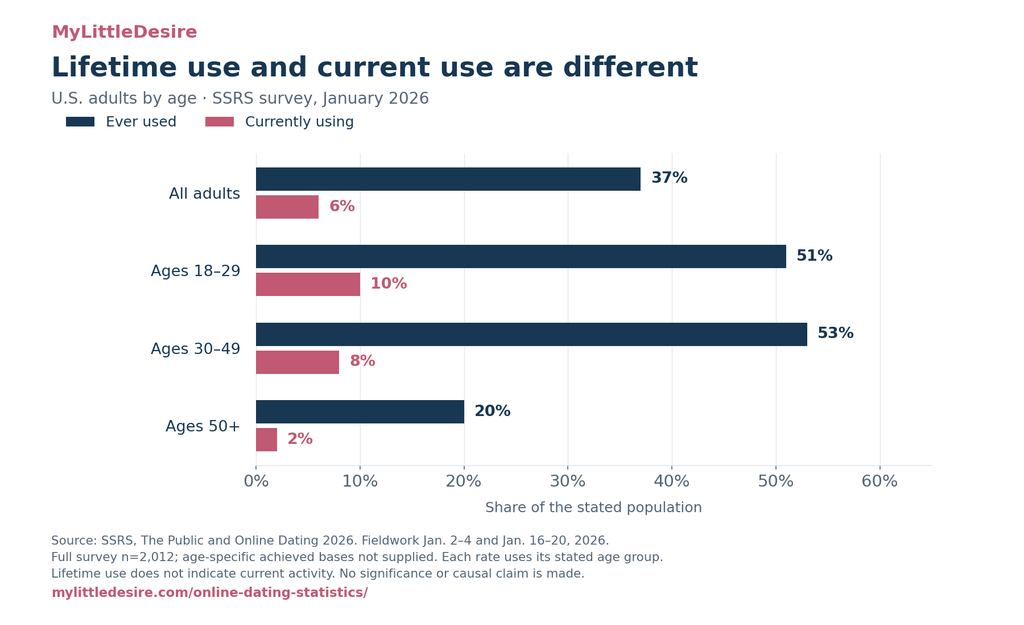
These age comparisons are cross-sectional. They do not prove that a person stops using apps as they age, and the two younger groups should not be ranked by statistical significance from the rounded values alone.
Which dating platforms have U.S. users tried?
Tinder was the most commonly selected of these six services: 48% of dating-site/app ever-users said they had used it. Plenty of Fish and Facebook Dating each received 30%; Bumble received 27%; Hinge and Match each received 21%.
| Finding | Percent | Data period |
|---|---|---|
| U.S. ever-users who have used Tinder | 48% | January 2026 |
| U.S. ever-users who have used Plenty of Fish | 30% | January 2026 |
| U.S. ever-users who have used Facebook Dating | 30% | January 2026 |
| U.S. ever-users who have used Bumble | 27% | January 2026 |
| U.S. ever-users who have used Hinge | 21% | January 2026 |
| U.S. ever-users who have used Match | 21% | January 2026 |
Source: SSRS, 2026-02-02. SPOT9, 2026 column. Base: adults who had ever used dating sites/apps, n=772. Respondents could select multiple services.
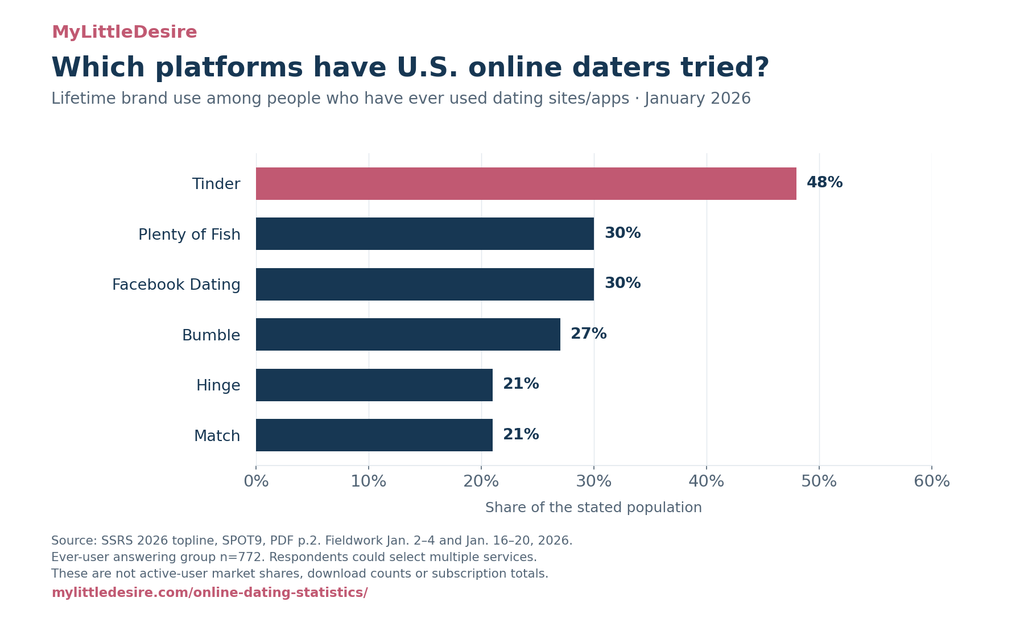
A former Tinder user who now uses Hinge can appear in both lifetime-use percentages. Summing the rows would therefore misrepresent the audience, and the list is a selection from the survey’s longer platform question.
What qualities do users value in an online match?
Shared family values received a “very important” rating from 51% of U.S. ever-users, compared with 33% for political beliefs and 31% for religious or spiritual beliefs.
| Finding | Percent | Data period |
|---|---|---|
| U.S. ever-users rating similar family values very important in a match | 51% | January 2026 |
| U.S. ever-users rating similar political beliefs very important in a match | 33% | January 2026 |
| U.S. ever-users rating similar religious or spiritual beliefs very important in a match | 31% | January 2026 |
Source: SSRS, 2026-02-02. SPOT10 summary, “very important” category only; ever-user base n=772.
These are preferences, not evidence that algorithms matched people with those traits or that matching on a particular belief caused a relationship to succeed. “Very important” is narrower than combining very and somewhat important.
Why do people use dating sites and apps?
Finding an exclusive romantic partner was the main reason cited by 58% of U.S. ever-users in the SSRS survey. Other selected reasons included something fun or interesting to do, casual sex, platonic connections and a self-esteem boost.
| Finding | Percent | Data period |
|---|---|---|
| U.S. ever-users whose main reason was finding an exclusive romantic partner | 58% | January 2026 |
| U.S. ever-users whose main reason was having something fun or interesting to do | 20% | January 2026 |
| U.S. ever-users whose main reason was casual sex | 8% | January 2026 |
| U.S. ever-users whose main reason was platonic connections | 4% | January 2026 |
| U.S. ever-users whose main reason was boosting self-esteem | 4% | January 2026 |
Source: SSRS, 2026-02-02. SPOT11 asks for the main reason; ever-user base n=772. These are selected response categories, not the complete distribution.
The survey asks for one main reason. A different survey permitting several motives could produce larger percentages for the same activity. The 58% figure describes intention; it does not mean 58% found an exclusive partner.
Do users think dating apps help their dating and relationships?
In SSRS’s 2026 poll, 33% of ever-users described the effect as mostly positive, 20% as mostly negative and 47% as neither positive nor negative.
| Finding | Percent | Data period |
|---|---|---|
| U.S. ever-users describing the effect on dating/relationships as mostly positive | 33% | January 2026 |
| U.S. ever-users describing the effect on dating/relationships as mostly negative | 20% | January 2026 |
| U.S. ever-users describing the effect on dating/relationships as neither positive nor negative | 47% | January 2026 |
Source: SSRS, 2026-02-02. SPOT12; ever-user base n=772. The question asks about the overall perceived effect on dating and relationships.
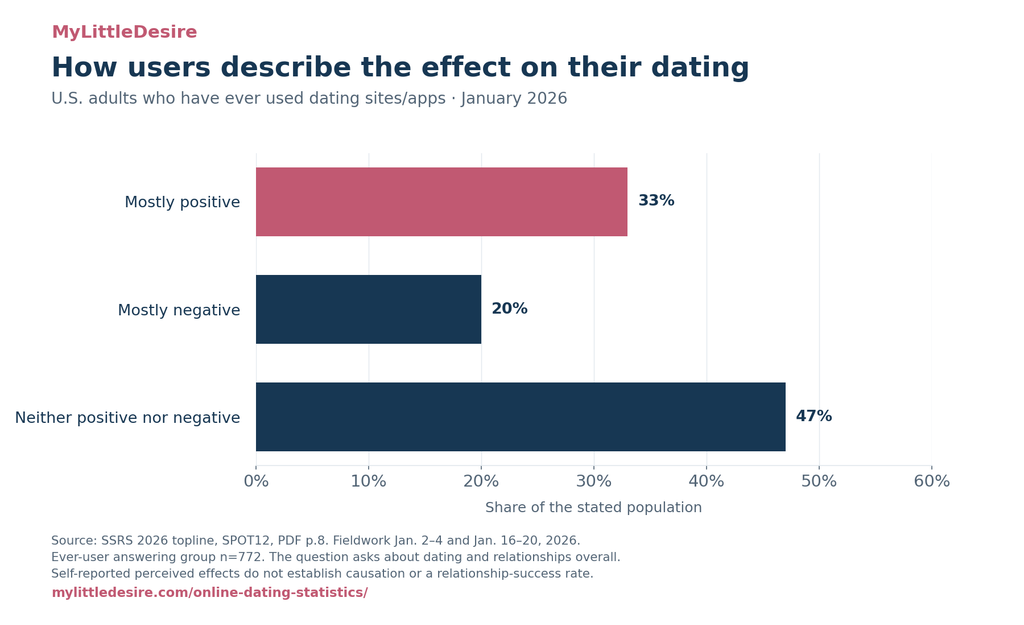
A person can have had a relationship with someone met on an app and still describe the overall experience as mixed. Perceived usefulness and ever forming a relationship answer separate questions.
How often do dating-app users report a committed relationship?
Half of U.S. ever-users said they had, at some time, been in a committed relationship with someone they met through a dating site or app. The denominator is people who have tried those services, not all adults or all couples.
| Finding | Percent | Data period |
|---|---|---|
| U.S. ever-users who have had a committed relationship with someone met through a dating site/app | 50% | January 2026 |
Source: SSRS, 2026-02-02. SPOT13, “Yes”; ever-user base n=772.
This is not a marriage rate, a claim that half of all relationships begin online or a prediction that an individual user has a 50% chance of finding a lasting partner. The question does not establish whether that relationship remains ongoing.
What does the public believe about relationships that begin online?
| Finding | Percent | Data period |
|---|---|---|
| U.S. adults believing app/site-formed relationships are just as successful as those starting in person | 58% | January 2026 |
Source: SSRS, 2026-02-02. SPOT14; all-adult base n=2,012. The 58% figure measures the belief that these relationships are just as successful as relationships starting in person; it does not measure actual comparative success.
How safe do Americans believe an in-person online-dating meeting is?
SSRS found that 57% of U.S. adults considered meeting a dating-site/app contact in person very or somewhat safe, while 43% considered it not too or not at all safe. Women were more likely than men to choose the latter categories: 55% versus 30%.
| Finding | Percent | Data period |
|---|---|---|
| U.S. adults believing meeting a dating-site/app contact in person is very or somewhat safe | 57% | January 2026 |
| U.S. adults believing meeting a dating-site/app contact in person is not too or not at all safe | 43% | January 2026 |
| U.S. women believing meeting a dating-site/app contact in person is not too or not at all safe | 55% | January 2026 |
| U.S. men believing meeting a dating-site/app contact in person is not too or not at all safe | 30% | January 2026 |
Sources: SSRS, 2026-02-02 for the overall percentages; SSRS, 2026-02-02 for the gender comparison. Overall n=2,012; exact gender-specific item bases are unavailable.
These figures describe beliefs. They cannot be used as victimization probabilities. The source publishes the combined safe value as 57%, even though its separately rounded safe categories add to 58%; this report retains the published combined figure.
How many UK online adults visit dating services?
Ofcom reported that 11% of UK online adults visited a measured online dating service in May 2025. This is a monthly audience measure among internet users ages 18 and older, rather than a survey of whether people had ever created a dating profile.
| Finding | Percent | Data period |
|---|---|---|
| UK online adults who visited an online dating service in the month | 11% | May 2025 |
Source: Ofcom / Ipsos iris, 2025-12-10. Dating section. Underlying measurement: Ipsos iris Online Audience Measurement Service.
Which services had the largest reported monthly reach?
| Finding | Percent | Data period |
|---|---|---|
| UK online adults reached by Tinder during the month | 3.1% | May 2025 |
| UK online adults reached by Hinge during the month | 3.1% | May 2025 |
| UK online adults reached by Bumble during the month | 2.3% | May 2025 |
| UK online adults reached by Grindr during the month | 1.9% | May 2025 |
| UK online adults reached by Squirt during the month | 1.1% | May 2025 |
| UK online adults reached by Badoo during the month | 1% | May 2025 |
| UK online adults reached by PURE Hookup during the month | 0.9% | May 2025 |
| UK online adults reached by Plenty of Fish during the month | 0.8% | May 2025 |
| UK online adults reached by Ourtime during the month | 0.5% | May 2025 |
| UK online adults reached by Match during the month | 0.5% | May 2025 |
Source: Ofcom / Ipsos iris, 2025-12-10. Figure 39, “UK online adult reach in May 2025.” Each percentage uses all UK online adults ages 18+, not only people who visited a dating service.
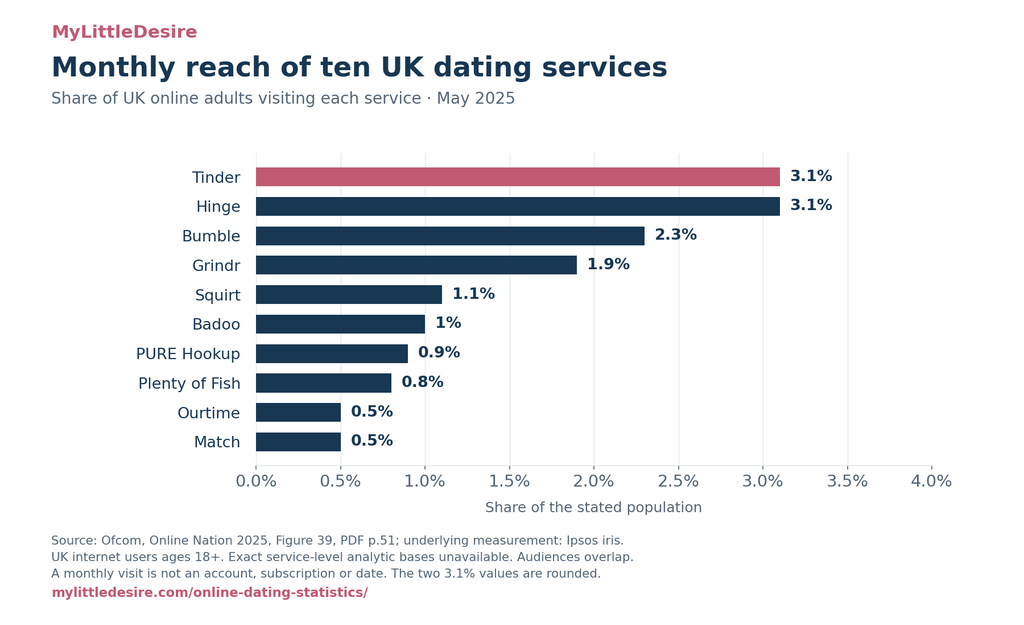
The underlying metered panel contains more than 10,000 adult internet users, supplemented by publisher measurement. That panel context is not the achieved sample size for every service. These UK visit estimates should not be compared directly with SSRS’s U.S. lifetime brand-use percentages.
How did adults in Great Britain meet their partner?
YouGov’s July 2026 survey found that 11% of relationship-experienced GB adults met their current or most recent partner through a dating app. A separate 5% selected another online dating platform, such as the examples named in the questionnaire.
| Finding | Percent | Data period |
|---|---|---|
| GB adults with relationship experience who met their current/most recent partner through a dating app | 11% | July 9–10, 2026 |
| GB adults with relationship experience who met their current/most recent partner through another online dating platform | 5% | July 9–10, 2026 |
Source: YouGov, 2026-08-17. Partner-meeting question; asked of respondents who are, or ever have been, in a relationship, n=1,684. Full survey n=1,882.
How did the app-meeting response vary by age?
| Finding | Percent | Data period |
|---|---|---|
| GB adults ages 18–29 with relationship experience who met their current/most recent partner through a dating app | 16% | July 9–10, 2026 |
| GB adults ages 30–39 with relationship experience who met their current/most recent partner through a dating app | 22% | July 9–10, 2026 |
| GB adults ages 60+ with relationship experience who met their current/most recent partner through a dating app | 3% | July 9–10, 2026 |
Source: YouGov, 2026-08-17. Dating-app row, age columns. Exact filtered age-item bases are not supplied separately.
The question concerns a current or most recent relationship, potentially formed years earlier. It does not measure the share of all new relationships formed in 2026. Great Britain excludes Northern Ireland; these results should not be relabeled as covering the full United Kingdom.
Why had some Australian singles not tried dating apps?
In YouGov’s January 2024 Australian survey, 70% of adults had never used a dating app. Among single non-users keen or open to finding a romantic partner, 24% cited preferring to meet people in person, 19% cited concerns about fake profiles or catfishing, and 15% cited sharing personal details and dating preferences.
| Finding | Percent | Data period |
|---|---|---|
| Australian adults who had never used a dating app | 70% | January 2024 |
| Australian single non-users open to a relationship citing preferring to meet people in person as a barrier | 24% | January 2024 |
| Australian single non-users open to a relationship citing concern about fake profiles or being catfished as a barrier | 19% | January 2024 |
| Australian single non-users open to a relationship citing concern about sharing personal details and dating preferences as a barrier | 15% | January 2024 |
Source: YouGov, 2024-04-19. Published April 19, 2024; full online sample n=1,029, weighted by age, gender and region. The achieved conditional single/non-user base was not reported.
The 70% finding uses the full adult sample; the three barriers use a smaller eligible group. Do not describe the barriers as percentages of all Australians or as measured rates of harm. These findings remain clearly dated historical context.
What does Canadian research show about meeting partners online?
Qian and Hu’s analysis of a 2018 Canadian survey reported that 17.5% of a selected analytical sample met their current or most recent partner online. Within its online-meeting subgroup, 68% met through dating sites/apps rather than another online venue.
| Finding | Percent | Data period |
|---|---|---|
| Selected Canadian study participants whose current/most recent partner was met online | 17.5% | 2018 survey |
| Online-meeting participants in the selected Canadian sample who met through dating sites/apps | 68% | 2018 survey |
Source: Qian and Hu, 2024-02-12. PDF page 7, Table 1, for 17.5%; PDF page 5 for the 68% conditional share. First published online February 12, 2024; journal issue published in 2025.
The original telephone survey included 1,700 adults and oversampled immigrants. The descriptive sample retained 795 respondents in eligible different-sex relationships formed during 1996–2018; 139 had met online. Relationships formed before an immigrant moved to Canada were excluded. These selected-sample figures are not national Canadian dating-app prevalence estimates for 2026.
Online meeting is broader than dating apps: the paper also includes social networking sites, chatrooms, classified advertising and other online venues. No directly comparable current Canadian all-adult uptake estimate was verified for this report.
What did earlier U.S. research find about paying, harassment and suspected scams?
Pew’s July 2022 survey found that 35% of dating-site/app ever-users had paid for a service or an extra feature. It also found that 48% had experienced at least one of four unwanted behaviors, and 52% thought they had encountered someone trying to scam them.
| Finding | Percent | Data period |
|---|---|---|
| U.S. ever-users who had paid for a dating site/app or extra features | 35% | July 5–17, 2022 |
| U.S. ever-users who experienced at least one of four unwanted platform behaviors | 48% | July 5–17, 2022 |
| U.S. ever-users reporting unwanted sexually explicit messages or images on dating platforms | 38% | July 5–17, 2022 |
| U.S. ever-users reporting continued contact after saying they were not interested on dating platforms | 30% | July 5–17, 2022 |
| U.S. ever-users reporting being called an offensive name on dating platforms | 24% | July 5–17, 2022 |
| U.S. ever-users reporting a threat of physical harm on dating platforms | 6% | July 5–17, 2022 |
| U.S. ever-users who thought they had encountered someone trying to scam them | 52% | July 5–17, 2022 |
Sources: Pew Research Center, 2023-02-02 and its original experiences chapter. Full-report PDF page 71: ONDPAY; page 73: ONHARASS; page 74: ONSCAM. The 48% combined measure is published in the experiences chapter. Full sample n=6,034; ever-user question eligibility n=3,128.
These are historical self-reports, not 2026 measurements. The unwanted-behavior categories overlap and must not be added. The 52% finding concerns suspected scam encounters; it does not establish confirmed crimes, losses or the percentage of users victimized financially. Ever paying also differs from current subscriber counts.
Why should these percentages not be combined into a global ranking?
The report deliberately keeps countries and questions separate. U.S. current use, UK monthly visits, GB partner-meeting channels, Australian barriers and a selected Canadian historical sample are not comparable national adoption rates.
- Match the denominator: All adults, ever-users, internet users and eligible relationship-experienced respondents are different populations.
- Keep the collection date: A 2026 title does not make 2018, 2022 or 2024 observations current measurements.
- Distinguish intentions, beliefs and outcomes: Seeking an exclusive partner, believing apps are useful and ever having a committed relationship answer different questions.
- Separate visits, accounts and subscriptions: Metered audience reach is not the same as registered users, downloads or paying customers.
- Respect overlap and rounding: Multi-platform use and harassment experiences can overlap. Use published combined estimates rather than reconstructing them from rounded parts.
Methodology and limitations
MyLittleDesire compiled observations from original survey tables, first-party research releases, an official audience-measurement report and a peer-reviewed study. The database records values, units, organizations, direct source URLs, publication and collection periods, populations, available sample sizes, methods, source locations, definitions, caveats and verification status.
The 60 findings are distinct observations, not 60 independent studies. Key findings and charts repeat selected entries and do not increase the count. MyLittleDesire’s contribution is the organization, explanation of denominators and dates, and charts. AI assisted the research synthesis; respondent microdata were not independently reanalyzed.
- SSRS: Probability-based national adult survey; n=2,012, with an ever-user group of 772. The reported total-sample margin of error is ±2.5 percentage points, not the uncertainty for every subgroup.
- Ofcom / Ipsos iris: Passive measurement and publisher data; UK internet users ages 18+. Exact dating-service analytic bases were not supplied. Visits are not accounts.
- YouGov: Published weighted findings. The Australian article documents age/gender/region weighting; complete probability-recruitment methods were not established for either YouGov source. Conditional bases differ from full sample totals.
- Canada: Selected historical different-sex relationship sample, with immigrant oversampling and eligibility restrictions. Its descriptive percentages should not be generalized to all Canadian adults.
- Pew: Weighted probability-based panels, including an LGB oversample. The 2022 results are retained as dated experience/safety context.
- Scope and uncertainty: An editorial compilation, not a systematic review. No global user totals, market forecasts, new confidence intervals, causal claims or app rankings were invented.
All four charts compare compatible values from within the same source and period. The resource does not establish that apps cause relationship success, harm or demographic differences. Sources published after the review date and inaccessible microdata are outside this compilation.
Complete original sources
- SSRS. The Public and Online Dating 2026. Published 2026-02-02. Data: January 2–4 and January 16–20, 2026. Full data/report PDF.
- Ofcom; underlying measurement by Ipsos iris. Online Nation Report 2025. Published 2025-12-10. Data: May 2025. Full data/report PDF.
- YouGov. Big Survey on Relationships: Section 1, the relationships landscape in the UK. Published 2026-08-17. Data: July 9–10, 2026. Full data/report PDF.
- YouGov. Pining for love, passing on apps: Why are some singles in Australia hesitant about dating apps?. Published 2024-04-19. Data: January 2024; exact fieldwork days not stated.
- Yue Qian and Yang Hu; University of British Columbia and Lancaster University. How couples meet and assortative mating in Canada. Published 2024-02-12; Journal of Marriage and Family 87(1), 392–407, 2025 issue. Data: 2018 survey; relationships formed 1996–2018. Full data/report PDF.
- Pew Research Center. From Looking for Love to Swiping the Field: Online Dating in the U.S.. Published 2023-02-02. Data: July 5–17, 2022. Full data/report PDF. Methodology.
How to cite this resource
Suggested citation:
MyLittleDesire. Online Dating & Dating App Statistics 2027. https://mylittledesire.com/online-dating-statistics/. Add the date you accessed the published page.
Original HTML resource: https://mylittledesire.com/online-dating-statistics/.
Cite MyLittleDesire for the compilation or its charts. When reporting an underlying survey result, also identify the original research organization, population and collection period. MyLittleDesire should not be credited as conducting the surveys.