Family estrangement statistics describe different experiences: a relationship someone considers ended, a period of very low contact, or a low-contact relationship with little emotional closeness. Keeping those definitions attached to the numbers makes the evidence more useful.
This resource brings together 50 grouped findings from eight study programs, with four charts and 20 reproducible descriptive calculations. Related response categories remain grouped. The supporting database contains 146 numeric inputs; those inputs are not 146 separate studies or headline findings.
What are the key family estrangement findings?
38%
24%
US adult citizens reporting current estrangement from any of five specified relative types, in 2025. YouGov [S01]
Reporting current estrangement from a sibling, in YouGov’s 2025 all-adult-citizen sample. YouGov [S01]
70% vs 35%
6.3% / 26.0%
Would consider reconciliation with an estranged child versus an estranged parent; separate 2025 respondent groups. YouGov [S01]
Any observed maternal / paternal estrangement across 1994–2018 in the NLSY79-CYA cohort. Rin Reczek, Lawrence Stacey and Mieke Beth Thomeer; Ohio State University / University of Alabama at Birmingham [S02]
81.3% / 68.6%
8%
Later unestrangement among previously estranged maternal / paternal cases with subsequent follow-up; not durable repair rates. Rin Reczek, Lawrence Stacey and Mieke Beth Thomeer; Ohio State University / University of Alabama at Birmingham [S02]
GB respondents aged 15+ reporting personal estrangement in September 2014; historical evidence. Ipsos MORI for Stand Alone [S03]
27%
35%
GB respondents aware of someone estranged, including themselves, in that 2014 poll; a different outcome from personal experience. Ipsos MORI for Stand Alone [S03]
US adults reporting immediate-family estrangement in Harris’s November 2024 poll; original table base is all respondents. The Harris Poll [S06]
80% vs 56%
56% vs 41%
Personal-interaction limits versus wider family-interaction limits among Harris respondents with an estranged close relation. The Harris Poll [S06]
Desired reconnection versus thought it likely in Harris’s small politically estranged subset, unweighted n=93. The Harris Poll [S06]
80% / 68%
61.8%
Reported some positive effect / perceived stigma in the selected 2015 Hidden Voices community; separate questions. Lucy Blake; University of Cambridge Centre for Family Research and Stand Alone [S05]
Of already-classified estranged ties in the historical regional maternal study involved infrequent contact plus low closeness. Megan Gilligan, J. Jill Suitor and Karl Pillemer; Iowa State / Purdue / Cornell [S08]
Which family estrangement statistic should a writer use?
Choose the statistic that matches the relationship, observation period, population and definition in the story. There is no single interchangeable “family estrangement rate.”
| Question | Suitable source | What the number means | What it cannot establish |
|---|---|---|---|
| Current estrangement from specified relatives in the US | YouGov [S01] | 38% of adult citizens, July–August 2025; five relative types | A parent-only rate, complete no contact, or a 2027 estimate |
| Current estrangement from immediate, extended or chosen family | The Harris Poll [S06] | 35%, 34% and 27% respectively, among all adults in November 2024 | A sum across categories, or family-only meaning for a measure that includes friends |
| Any observed parent estrangement in a longitudinal cohort | Rin Reczek, Lawrence Stacey and Mieke Beth Thomeer; Ohio State University / University of Alabama at Birmingham [S02] | 6.3% maternal and 26.0% paternal, 1994–2018 | Contemporary adult prevalence or a complete lifetime probability |
| Personal experience versus knowing someone estranged in GB | Ipsos MORI for Stand Alone [S03] | 8% personal experience; 27% any awareness, September 2014, ages 15+ | The percentage of UK families affected |
| Experiences among adults already identifying as estranged | Lucy Blake; University of Cambridge Centre for Family Research and Stand Alone [S05] | Support-community responses, fielded in 2015 | National prevalence, treatment effectiveness or the right choice for an individual |
| A mother with any estranged child versus an estranged dyad | Megan Gilligan, J. Jill Suitor and Karl Pillemer; Iowa State / Purdue / Cornell [S08] | Different units in a regional 2001–2003 sample | An 11% rate among all mother–child ties or all US mothers today |
How common is family estrangement in US surveys?
YouGov found that 38% of US adult citizens reported current estrangement from at least one of five specified relative types in 2025. Siblings were the most frequently reported category. The five categories overlap, and the poll did not condition these all-sample percentages on having a living relative of each type. YouGov [S01]
| ID | Finding and interpretation | Population and actual data period | Source and locator |
|---|---|---|---|
| F01 | In 2025, 38% reported current estrangement from at least one of the five relative types asked about. All adult citizens surveyed; not 38% of families, not parent-only, and not necessarily complete absence of contact. | US adult citizens, age 18+; follow-ups conditional on the named estranged relationship 2025-07-24 to 2025-08-01; four online surveys | Original source [S01] YouGov article opening result; PDF p.1 Q1 lists the five separate types |
| F02 | Current estrangement was reported from a sibling by 24%, a parent by 16%, a child by 10%, a grandparent by 9%, and a grandchild by 6%. All-adult-citizen percentages as reported, not rates conditional on having a living member of each type. Categories overlap; do not add. | US adult citizens, age 18+; follow-ups conditional on the named estranged relationship 2025-07-24 to 2025-08-01; four online surveys | Original source [S01] Original topline PDF p.1 Q1 |
| F24 | Cornell’s account of Pillemer’s national survey reported 27% of US adults were currently estranged from a relative. Verified from original university reporting, not a full questionnaire/microdata audit. Do not compare with YouGov’s 38% as a measured increase; family scope, wording and sampling differ. | US adults aged 18+ in Pillemer’s national estrangement survey Survey reported in 2020 book; exact field dates not disclosed in the accessed university accounts | Original source [S04] Cornell Chronicle 2020 survey result; Cornellians 2021 interview explicitly describes “currently” |
Do the Cornell and YouGov figures prove an increase?
No. Cornell’s original university interview describes its 27% figure as current estrangement, but the accessed accounts do not supply the complete survey instrument, exact field dates or weighting details. YouGov’s later question names five relationship types. Their difference is not a measured trend. The two figures should remain separate study results. Karl Pillemer / Cornell University [S04] YouGov [S01]
Who reports ending contact?
Adult respondents estranged from a parent were more likely to say they ended contact; respondents estranged from a child were more likely to say their child did. These are accounts from different sampled people. The survey does not pair parents with their own children or establish responsibility for the underlying conflict. YouGov [S01]
| ID | Finding and interpretation | Population and actual data period | Source and locator |
|---|---|---|---|
| F03 | For sibling estrangement, 26% said they ended contact, 29% the sibling did, 19% both did, and 18% that they grew apart. Not matched siblings. Other and withheld responses are omitted here; these selected categories are not a complete distribution. | US adult citizens currently estranged from a sibling 2025-07-24 to 2025-08-01; four online surveys | Original source [S01] PDF p.1 Q2, sibling row |
| F04 | Among those estranged from a parent, 38% said they ended contact and 20% the parent did; 15% said both and 12% said they grew apart. Respondent perspective; this does not identify who caused a family conflict. Selected categories shown. | US adult citizens currently estranged from a parent 2025-07-24 to 2025-08-01; four online surveys | Original source [S01] PDF p.1 Q2, parent row |
| F05 | Among those estranged from a child, 13% said they ended contact and 46% the child did; 13% said both and 8% said they grew apart. Separate respondents from the parent-estranged group, not two sides of the same sampled family. Selected categories shown. | US adult citizens currently estranged from a child 2025-07-24 to 2025-08-01; four online surveys | Original source [S01] PDF p.1 Q2, child row |
| F06 | Among those estranged from a grandparent, 30% said they grew apart, 20% said they ended contact, and 12% said the grandparent did. Selected answers to a question about who cut contact; growing apart is not the same as a deliberate cutoff. | US adult citizens currently estranged from a grandparent 2025-07-24 to 2025-08-01; four online surveys | Original source [S01] PDF p.1 Q2, grandparent row |
| F07 | Among those estranged from a grandchild, 35% said someone else ended the relationship, 30% said the grandchild did, and 14% said they did. The “someone else” answer does not identify a person or establish blame. Selected categories shown. | US adult citizens currently estranged from a grandchild 2025-07-24 to 2025-08-01; four online surveys | Original source [S01] PDF p.1 Q2, grandchild row |
MyLittleDesire’s subtraction gives an 18-percentage-point difference between “I did” and “they did” among parent-estranged respondents (38% − 20%), and a 33-point difference in the reverse direction among child-estranged respondents (46% − 13%). Growing apart and third-party involvement are also possible answers. These calculations summarize reported initiation, not fault. [C05–C06] YouGov [S01]
Who would consider reconciliation?
In YouGov’s 2025 poll, 70% of respondents estranged from a child would consider reconciliation under some circumstances, compared with 35% estranged from a parent. The question measures hypothetical openness rather than what happened next. YouGov [S01]
| ID | Finding and interpretation | Population and actual data period | Source and locator |
|---|---|---|---|
| F08 | Willingness to consider reconciliation was 70% for a child, 66% for a grandchild, 45% for a sibling, 40% for a grandparent, and 35% for a parent. Hypothetical willingness under any circumstances, not a reconciliation success rate. Conditional group sizes are not disclosed. | Separate groups of US adult citizens currently estranged from each named relative 2025-07-24 to 2025-08-01; four online surveys | Original source [S01] PDF p.4 Q8, Yes column |

The parent–child and grandparent–grandchild contrasts
The child-versus-parent difference is 35 percentage points, with a ratio of approximately 2.00×. For grandchild versus grandparent groups, willingness was 66% versus 40%, a 26-point difference. The different roles and separate conditional bases are essential to those comparisons. They do not show how often two estranged relatives would both agree to reconnect. [C01–C03] YouGov [S01]
What reasons do respondents report for estrangement?
The reported reasons differ by the relative involved. In the 2025 YouGov results, parent-estranged respondents frequently selected abuse or manipulation, while child-estranged respondents most often selected lies or betrayal, conflicting values or lifestyle, and fallout from divorce among the listed options. Multiple answers were permitted. YouGov [S01]
| ID | Finding and interpretation | Population and actual data period | Source and locator |
|---|---|---|---|
| F09 | Sibling-estranged respondents cited personality conflict and lies or betrayal at 29% each, manipulative behavior at 26%, and other family conflict at 24%. Multi-select self-reported reasons, not independently verified causes or a diagnosis. | US adult citizens currently estranged from a sibling 2025-07-24 to 2025-08-01; four online surveys | Original source [S01] PDF p.2 Q3 |
| F10 | Parent-estranged respondents cited manipulative behavior and abuse at 34% each, lies or betrayal at 31%, and abandonment or neglect at 29%. Abuse combines physical, emotional and sexual categories. Multiple reasons allowed; this is respondent reporting, not adjudication. | US adult citizens currently estranged from a parent 2025-07-24 to 2025-08-01; four online surveys | Original source [S01] PDF p.2 Q4 |
| F11 | Child-estranged respondents cited lies or betrayal at 24%, conflicting values or lifestyle at 21%, and fallout from divorce at 20%. Selected multi-select reasons from a separate respondent group. Differences from adult children’s answers are not matched-family disagreement rates. | US adult citizens currently estranged from a child 2025-07-24 to 2025-08-01; four online surveys | Original source [S01] PDF p.3 Q5 |
| F12 | Among parent-estranged respondents, 40% of women and 27% of men cited manipulative behavior. Article-reported subgroup estimates; achieved subgroup bases and confidence intervals are not supplied. No causal gender interpretation. | Women / men among US adult citizens currently estranged from a parent 2025-07-24 to 2025-08-01; four online surveys | Original source [S01] Original YouGov article, paragraph beginning “For each of the types of family members” |
These are respondents’ explanations. They do not independently establish a diagnosis, adjudicate allegations or isolate causal effects. For example, the 13-point difference between women and men citing manipulative behavior by a parent is a descriptive subgroup contrast; the public article does not provide achieved subgroup bases or confidence intervals. [C07]
What does the longitudinal parent–child study show?
The NLSY79-CYA analysis found that about 6.3% experienced maternal estrangement and 26.0% paternal estrangement at an observed wave between 1994 and 2018. Respondents were offspring of women in the original NLSY79 cohort, with parent relationships observed from age 15 onward. Rin Reczek, Lawrence Stacey and Mieke Beth Thomeer; Ohio State University / University of Alabama at Birmingham [S02]
| ID | Finding and interpretation | Population and actual data period | Source and locator |
|---|---|---|---|
| F13 | Across the 1994–2018 observation period, about 6.3% experienced maternal estrangement and 26.0% paternal estrangement. Cumulative over observed waves from age 15; not the current share of all US adults, not a complete lifetime probability, and not a rate among parents. | Children born to women in the NLSY79 cohort; relationships observed from age 15 onward; ages 15–46 in 2018 1994–2018, 13 survey waves | Original source [S02] Results opening paragraph; Table 1; Methods, construction of estrangement indicator |
| F14 | Mean age at first observed estrangement was 25.89 for mothers and 23.17 for fathers. Means within the modeled cohort and observed events, not ages when every estrangement begins; no inference about 2027 young adults. | Children born to women in the NLSY79 cohort; relationships observed from age 15 onward; ages 15–46 in 2018 1994–2018, 13 survey waves | Original source [S02] Hazard-model Results text preceding Table 5 and paragraph following Table 5 |
| F15 | Of previously estranged respondents observed in later waves, 81.3% became unestranged from mothers and 68.6% from fathers. Crossed the study’s contact/closeness threshold in a later wave. This is not a durable repair rate, clinical success rate or recommendation to resume contact. | Previously estranged cohort relationships with at least one later observed wave 1994–2018, 13 survey waves | Original source [S02] Unestrangement Results paragraph, supplementary Table S4 referenced; Methods; Table 4 sample sizes |
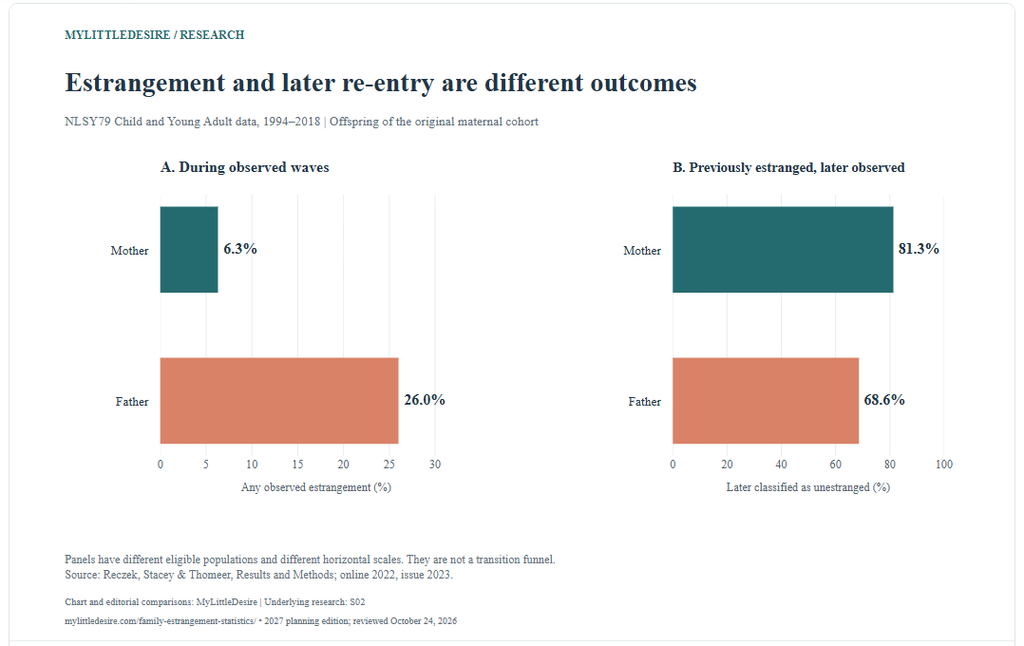
Observed estrangement and later re-entry have different denominators
The cumulative paternal percentage was 19.7 points higher than the maternal percentage, or approximately 4.13× using the published rounded inputs. Mean age at first observed maternal estrangement was about 2.7 years later. These findings describe different relationship/event groups within this cohort. [C08–C10]
The later-unestrangement comparison uses only previously estranged respondents observed in another wave: 448 maternal cases and 2,258 paternal cases. The 12.7-point difference between 81.3% and 68.6% is not a comparison of two treatment success rates. A relationship can cross the contact/closeness threshold without becoming safe, close or permanently repaired. [C11] Rin Reczek, Lawrence Stacey and Mieke Beth Thomeer; Ohio State University / University of Alabama at Birmingham [S02]
How do observed patterns differ across groups?
The cohort’s descriptive results vary by gender, race/ethnicity and sexual identity, particularly for paternal estrangement. These are historical cohort observations. Raw subgroup percentages and adjusted regression estimates answer different questions; the table below preserves the raw percentages. Rin Reczek, Lawrence Stacey and Mieke Beth Thomeer; Ohio State University / University of Alabama at Birmingham [S02]
| ID | Finding and interpretation | Population and actual data period | Source and locator |
|---|---|---|---|
| F16 | Observed maternal estrangement was 6.70% among men and 5.88% among women. Unadjusted weighted descriptives; the paper did not find a statistically significant bivariate maternal gender difference. Gender measure is based on reported sex. | Children born to women in the NLSY79 cohort; relationships observed from age 15 onward; ages 15–46 in 2018 1994–2018, 13 survey waves | Original source [S02] Table 1, Gender, Mother/Estranged column |
| F17 | Observed paternal estrangement was 24.33% among men and 27.74% among women. Unadjusted weighted descriptives. The paper marks the bivariate difference significant; this is not a causal effect of gender. | Children born to women in the NLSY79 cohort; relationships observed from age 15 onward; ages 15–46 in 2018 1994–2018, 13 survey waves | Original source [S02] Table 1, Gender, Father/Estranged column |
| F18 | Observed paternal estrangement was 21.67% for White, 49.49% for Black, 33.45% for Latine, 30.59% for “Other,” and 14.55% for multiracial respondents. Source categories retained, including a heterogeneous “Other” category. Unadjusted cohort observations reflect social and structural context; do not imply inherent group traits. | Children born to women in the NLSY79 cohort; relationships observed from age 15 onward; ages 15–46 in 2018 1994–2018, 13 survey waves | Original source [S02] Table 1, Race/ethnicity, Father/Estranged column |
| F19 | Observed maternal estrangement was 7.12% for White, 6.85% for Black, 7.91% for Latine, 7.52% for “Other,” and 3.94% for multiracial respondents. Do not confuse raw percentages with adjusted model estimates. Only the multiracial bivariate comparison with White respondents is marked significant in Table 1. | Children born to women in the NLSY79 cohort; relationships observed from age 15 onward; ages 15–46 in 2018 1994–2018, 13 survey waves | Original source [S02] Table 1, Race/ethnicity, Mother/Estranged column |
| F20 | In the sexuality subsample, paternal estrangement was 21.68% among heterosexual, 32.07% among gay/lesbian, and 36.32% among bisexual respondents. Sexual identity was measured only in 2018 and treated as time-invariant. These are unadjusted cohort figures, not evidence that identity causes estrangement. | 2018 sexual-identity respondents in NLSY79-CYA father-relationship subsample 1994–2018, 13 survey waves | Original source [S02] Table 1, Sexuality, Father/Estranged column and note |
Source categories are retained for transparency. They should not be used to imply inherent characteristics of racial or sexual-identity groups. The authors discuss social and structural conditions, and sexual identity was measured only in the final 2018 wave, producing a smaller analytical subsample.
What do the historical Great Britain figures measure?
Ipsos found that 8% of respondents aged 15+ in Great Britain personally experienced estrangement in September 2014; 27% knew somebody estranged, including themselves. Awareness and personal experience are separate outcomes. Ipsos MORI for Stand Alone [S03]
| ID | Finding and interpretation | Population and actual data period | Source and locator |
|---|---|---|---|
| F21 | In September 2014, 8% of GB respondents aged 15+ said they were personally estranged from a family member. Historical GB estimate including ages 15–17, not a current UK-wide family rate. | GB residents aged 15+, including 15–17-year-olds 2014-09-12 to 2014-09-18 | Original source [S03] Original release and topline EY01, Yes—myself; computer tables p.1 |
| F22 | Twenty-seven percent knew someone estranged, including themselves; 19% were in the family-awareness net. Respondents, not families, are the denominator. Awareness nets overlap with personal experience and cannot establish that 19% or 27% of families are estranged. | GB residents aged 15+, including 15–17-year-olds 2014-09-12 to 2014-09-18 | Original source [S03] Computer tables p.2 EY01 Yes—any (NET) and Yes—family (NET) |
| F23 | Personal estrangement was 7%, 6%, 9%, 10%, 8% and 6% across ages 15–24, 25–34, 35–44, 45–54, 55–64 and 65+, respectively. Rounded historical cross-section; do not turn age bands into present-day generational rates or claim every apparent difference is significant. | GB residents aged 15+, including 15–17-year-olds 2014-09-12 to 2014-09-18 | Original source [S03] Computer tables p.1, Yes—myself row; age columns |
The family-awareness net was 19%. This is still a percentage of respondents, not a census of families. Neither it nor the 27% awareness figure establishes that one in five or one in four UK families are estranged. Great Britain also excludes Northern Ireland. The release gives n=2,082; the computer tables show unweighted n=2,083 and weighted base 2,082, a small source discrepancy retained in our database.
What do adults in an estrangement-support community report?
Hidden Voices found reports of positive effects alongside stigma and difficult occasions in its selected 2015 community. Eighty percent reported some positive effect, 68% perceived stigma and 90% found the holiday season difficult. These are separate marginal responses; the report does not show how the answers overlap for individual respondents. Lucy Blake; University of Cambridge Centre for Family Research and Stand Alone [S05]
Selected sample, not national prevalence. The survey invited 1,629 members of the Stand Alone community and received 807 responses. It was international and self-selected; 45% reported UK residence, 36% US, 8% Canada and 4.5% Australia. Its country composition does not provide a rate for any of those countries.
| ID | Finding and interpretation | Population and actual data period | Source and locator |
|---|---|---|---|
| F25 | Fifty-four percent agreed that estrangement or relationship breakdown was common in their family. Volunteer support-community sample. This is an attitude about one’s family, not the share of national families affected. | Self-identified estranged adults in Stand Alone’s support community; selected relative-specific analyses use one relationship per category Invitations sent January 2015; survey open for four months | Original source [S05] Hidden Voices printed p.6, summary of findings |
| F26 | Sixty-eight percent perceived stigma around family estrangement. Perceived stigma among selected estranged respondents; not a prevalence estimate for public hostility. | Self-identified estranged adults in Stand Alone’s support community; selected relative-specific analyses use one relationship per category Invitations sent January 2015; survey open for four months | Original source [S05] Printed p.24, stigma results; 42% strongly agree + 26% agree |
| F27 | Eighty percent said estrangement had some positive effect on their life. Does not mean every consequence was positive, that estrangement caused improved health, or that the same decision is right for everyone. | Self-identified estranged adults in Stand Alone’s support community; selected relative-specific analyses use one relationship per category Invitations sent January 2015; survey open for four months | Original source [S05] Printed p.31, Positive outcomes |
| F28 | Difficult occasions included the holiday season (90%), birthdays (85%), being around other families (81%), funerals or family deaths (79%), and Mother’s/Father’s Day (78%). Multiple occasions could be difficult; categories overlap. These responses cannot be cross-tabulated with the positive-effects response from published marginals. | Self-identified estranged adults in Stand Alone’s support community; selected relative-specific analyses use one relationship per category Invitations sent January 2015; survey open for four months | Original source [S05] Printed p.26, Challenging times chart |
| F29 | Mean longest periods without speaking were 7.9 years for fathers, 7.7 for brothers, 7.4 for sisters, 5.5 for mothers, 5.2 for sons and 3.8 for daughters. Mean longest reported no-speaking period, not necessarily the ongoing estrangement’s duration. Selected groups, not matched families or a national duration distribution. | Hidden Voices respondents in each selected relative-specific category Invitations sent January 2015; survey open for four months | Original source [S05] Printed p.14, “What was the longest period of time family members had not spoken to one another?” chart |
| F30 | Minimal contact was reported by 29% for mothers, 25% for fathers, 26% for sisters, 24% for brothers, 34% for daughters and 33% for sons. Low contact remains possible within self-described estrangement. No-contact/minimal-contact totals can differ from 100% due to rounding. | Hidden Voices respondents in each selected relative-specific category Invitations sent January 2015; survey open for four months | Original source [S05] Printed p.14, contact chart, blue minimal-contact bars; original page visually inspected |
| F31 | Strong agreement that a future functional relationship was impossible was 56% for mothers, 50% for fathers, 6% for daughters and 4% for sons. Contemporaneous belief about the future, not a prediction that those relationships could never change. Relative-specific groups are not matched. | Hidden Voices respondents estranged from the named relative Invitations sent January 2015; survey open for four months | Original source [S05] Printed p.16, Strongly agree bars; original page visually inspected |
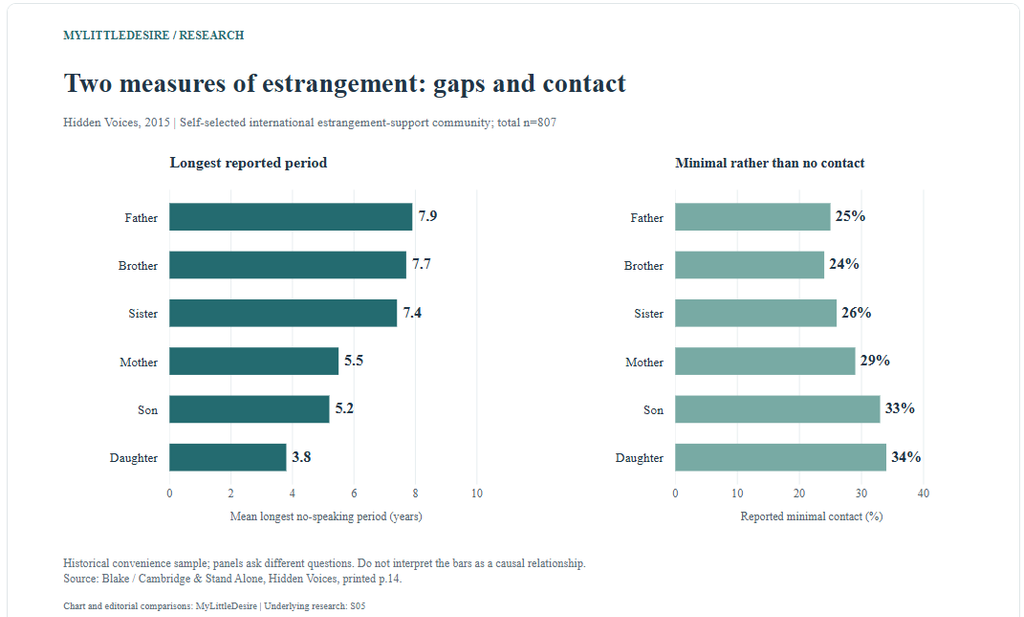
A longest gap is different from the current relationship’s duration
The mean longest no-speaking period was 7.9 years for fathers and 5.5 for mothers, a 2.4-year difference in selected relative-specific groups. This does not tell us the average duration of all estrangements or the length of every ongoing spell. Some self-described estranged relationships involved minimal contact, including 34% of the daughter-specific group and 33% of the son-specific group. [C17] Lucy Blake; University of Cambridge Centre for Family Research and Stand Alone [S05]
How do respondents disclose estrangement and seek support?
In Hidden Voices, 96% of partnered respondents had told their spouse or partner the full story. Separately, 78% of the sample had sought support from counsellors or therapists. Disclosure, seeking help and rating help are different measures. Lucy Blake; University of Cambridge Centre for Family Research and Stand Alone [S05]
| ID | Finding and interpretation | Population and actual data period | Source and locator |
|---|---|---|---|
| F32 | Among partnered respondents, 96% had told their spouse or partner the full estrangement story. Conditional on partnership; not 96% of all estranged adults. Disclosure does not establish the quality of the response. | Hidden Voices respondents married, in a civil partnership or cohabiting Invitations sent January 2015; survey open for four months | Original source [S05] Printed p.21, text beside disclosure chart |
| F33 | Among partnered respondents, 73% found talking to their spouse or partner very helpful, 20% somewhat helpful and 7% not helpful. Perceived helpfulness in a selected sample, not an intervention effectiveness estimate. | Hidden Voices respondents married, in a civil partnership or cohabiting Invitations sent January 2015; survey open for four months | Original source [S05] Printed p.21, helpfulness text |
| F34 | Seventy-eight percent sought support from counsellors or therapists, and 43% from GPs; among counselling/therapy users, 54% rated it very helpful. Seeking support and rating support use different denominators. Not a treatment trial or a guarantee of benefit; UK service terminology retained. | Hidden Voices respondents; helpfulness percentage conditional on users of counselling/therapy Invitations sent January 2015; survey open for four months | Original source [S05] Printed p.27, sources of support and helpfulness charts |
The 35-point difference between counselling/therapy use and GP use (78% − 43%) concerns where respondents sought support. The 54% “very helpful” figure is conditional on counselling/therapy use. Neither number comes from a treatment trial or establishes that a particular service will produce an outcome. [C18]
For a different view of supportive networks, see our friendship statistics resource. Friend counts, perceived support and family estrangement remain separate measures.
How do estrangement and communication limits differ?
Harris’s original November 2024 tables report 35% immediate-family, 34% extended-family and 27% chosen-family estrangement among all adult respondents. The categories overlap. “Chosen family” includes close friends and people not directly related to the respondent. The Harris Poll [S06]
| ID | Finding and interpretation | Population and actual data period | Source and locator |
|---|---|---|---|
| F35 | Among all adults, 35% reported immediate-family estrangement, 34% extended-family estrangement and 27% chosen-family estrangement. These percentages use all US respondents, despite ambiguous “of those” phrasing in the article. Categories overlap and chosen family includes friends. | US adults age 18+; conditional estranged base includes immediate, extended and chosen family / close friends Article reports fieldwork 2024-11-08 to 2024-11-11; table configuration displays date range through 2024-11-12 | Original source [S06] Core demographic PDF pp.3–5, QS1Q1; Table Base: US RESPONDENTS |
| F36 | Immediate-family estrangement was 40% at ages 18–34, 40% at 35–54 and 27% at 55+. Cross-sectional age groups, not a generational trend or the probability a person will become estranged as they age. | US adults age 18+; conditional estranged base includes immediate, extended and chosen family / close friends Article reports fieldwork 2024-11-08 to 2024-11-11; table configuration displays date range through 2024-11-12 | Original source [S06] Core PDF p.3, QS1Q1 immediate-family Yes row |
| F37 | Among respondents with an estranged close relation, 41% cited that person’s specific action, 39% family dynamics, 28% deception, 18% politics and 9% their own specific action. Multi-select personal explanations, not independently established causes. The 18% political-reasons figure is conditional on estrangement, not all adults. | US respondents estranged from any close relation, including chosen family Article reports fieldwork 2024-11-08 to 2024-11-11; table configuration displays date range through 2024-11-12 | Original source [S06] Core PDF pp.6–7, QS1Q2 |
| F38 | Eighty percent limited personal interactions with an estranged relation; 56% limited interactions involving other family members. Overlapping multi-select behavior nets; 56% is not the share estranged from an entire family. | US respondents estranged from any close relation, including chosen family Article reports fieldwork 2024-11-08 to 2024-11-11; table configuration displays date range through 2024-11-12 | Original source [S06] Core PDF pp.8–9, QS1Q3 PERSONAL and FAMILY nets |
| F39 | Fifty-eight percent had stopped personal communication and 35% had ignored personal communication from the estranged person. Respondents could choose both. Stopping and ignoring communication do not identify the sole initiator or cause. | US respondents estranged from any close relation, including chosen family Article reports fieldwork 2024-11-08 to 2024-11-11; table configuration displays date range through 2024-11-12 | Original source [S06] Core PDF p.8, QS1Q3 |
| F40 | Thirty-four percent blocked or unfollowed on social media, and 30% restricted channels such as phone numbers or email. Multi-select communication actions, not two mutually exclusive kinds of estrangement. | US respondents estranged from any close relation, including chosen family Article reports fieldwork 2024-11-08 to 2024-11-11; table configuration displays date range through 2024-11-12 | Original source [S06] Core PDF p.8, QS1Q3 |
| F41 | Thirty-six percent avoided family gatherings, 26% limited contact with non-estranged relatives, and 21% excluded an estranged person from gatherings. Responses overlap; neither attendance choices nor wider communication limits are a count of whole-family cutoffs. | US respondents estranged from any close relation, including chosen family Article reports fieldwork 2024-11-08 to 2024-11-11; table configuration displays date range through 2024-11-12 | Original source [S06] Core PDF p.9, QS1Q3 |
Checking the denominator changes the headline
The summary article uses ambiguous “of those” wording after discussing all close relations. The original QS1Q1 tables on pages 3–5 explicitly use US respondents, with n=1,068. We use that all-adult denominator for the 35%, 34% and 27% results. A broad headline about “half of Americans” must retain the inclusion of friends and other close relations.
Among respondents with any estranged close relation, the personal-interaction net was 80%, versus 56% for the family-interaction net: a 24-point difference. The nets overlap. Subtracting them does not establish that exactly 24% restricted only one relationship. Likewise, an age-band difference of 13 points in immediate-family estrangement (40% at 18–34 versus 27% at 55+) is not evidence of change over time. [C12, C16] The Harris Poll [S06]
What do politics and reconnection figures actually mean?
Harris found that 42% of all adults believed politics was the biggest reason for family estrangement. That is an opinion about society. A different question found that 18% of respondents with an estranged close relation selected politics as one of their own reasons. The different bases prevent treating those figures as equivalent cause estimates. The Harris Poll [S06]
| ID | Finding and interpretation | Population and actual data period | Source and locator |
|---|---|---|---|
| F42 | Forty-two percent of all adults agreed that politics was currently the biggest reason family members became estranged. Opinion about estrangement in society, not the measured cause of 42% of estrangements. It has a different base from the 18% political-reason answer. | US adults age 18+; conditional estranged base includes immediate, extended and chosen family / close friends Article reports fieldwork 2024-11-08 to 2024-11-11; table configuration displays date range through 2024-11-12 | Original source [S06] Core PDF p.24, QS1Q9, Agree (Net) |
| F43 | In the politically estranged subset, 56% desired reconnection but 41% thought reconnection likely. Two aggregate answers from a small subset. The difference does not establish that 15% of specific people wanted but could not reconnect. | US respondents estranged from a close relation for political reasons Article reports fieldwork 2024-11-08 to 2024-11-11; table configuration displays date range through 2024-11-12 | Original source [S06] Core PDF p.23 QS1Q8 and p.22 QS1Q7 |
| F44 | In that subset, 55% said an apology would increase desire to reconnect, 50% demonstrated change, 34% claimed change, and 30% an approaching sentimental time. Hypothetical reactions, not observed results of apologizing, therapy or a holiday visit. Published margins do not show individual combinations or establish significance of our differences. | US respondents estranged from a close relation for political reasons Article reports fieldwork 2024-11-08 to 2024-11-11; table configuration displays date range through 2024-11-12 | Original source [S06] Core PDF QS1Q6, pp.15,14,16,20 respectively, Increase column |
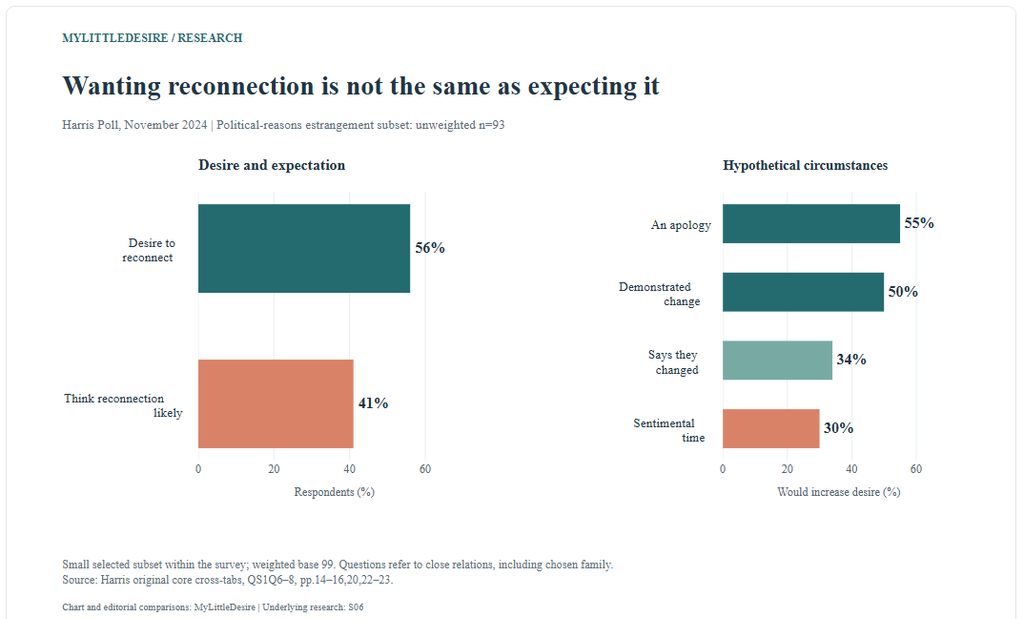
Three descriptive comparisons in the political-reasons subset
| Comparison | MyLittleDesire calculation | Interpretation |
|---|---|---|
| Desire to reconnect minus expected likelihood | 56% − 41% = 15 percentage points [C13] | Aggregate answers to two questions; the data do not identify a 15% group of individuals who wanted but could not reconnect. |
| Demonstrated change minus saying one has changed | 50% − 34% = 16 percentage points [C14] | Hypothetical increase in desire, not proof that demonstrating change causes reconnection. |
| Apology minus approaching sentimental time | 55% − 30% = 25 percentage points [C15] | Apology and timing scenarios in a small subset; no new paired statistical test or personal-contact recommendation. |
Respondents could select multiple reasons for estrangement. The politically estranged subset contained only 93 actual respondents (weighted base 99). Its estimates should not be generalized to every estranged family, and their apparent differences have not been newly tested for significance here.
What did the national family-life survey ask about belief-related cutoffs?
The 2021 American National Family Life Survey found that 11% had stopped talking to a family member over government or politics, while 22% had done so over hurtful or offensive personal beliefs. These are specific retrospectively reported reasons, rather than an all-cause current estrangement rate. Survey Center on American Life / American Enterprise Institute; NORC AmeriSpeak panel [S07]
| ID | Finding and interpretation | Population and actual data period | Source and locator |
|---|---|---|---|
| F45 | Eleven percent had stopped talking to a family member over something said about government or politics. Specific retrospectively reported reason; no current-status or minimum-duration requirement established by the accessed report prose. | US adults age 18+; subgroup estimates conditional on stated identity 2021-11-23 to 2021-12-14 | Original source [S07] Original report, Family Estrangement section; topline questionnaire supporting file |
| F46 | Twenty-two percent had stopped talking to a family member because personal beliefs were offensive or hurtful. Broader personal-beliefs question can include political differences; do not add 11% and 22% or call this an all-cause estrangement rate. | US adults age 18+; subgroup estimates conditional on stated identity 2021-11-23 to 2021-12-14 | Original source [S07] Original report, Family Estrangement section |
| F47 | The hurtful-beliefs communication-cutoff figure was 35% among atheists and 38% among gay, lesbian or bisexual adults. Subgroups can overlap. Not the share of every subgroup estranged for all reasons, and not evidence that identity causes a cutoff. | US atheist and gay/lesbian/bisexual adult subgroups in the American National Family Life Survey 2021-11-23 to 2021-12-14 | Original source [S07] Original report, final paragraph of Family Estrangement section |
The broader hurtful-beliefs figure is 11 points higher than the government/politics figure. The questions can overlap, so the difference does not identify the share estranged exclusively for nonpolitical beliefs. The report’s findings came from probability-panel fieldwork in November–December 2021, published in 2022. [C19]
Why does the definition change the answer?
Estrangement can include infrequent contact together with low emotional closeness. In Gilligan and colleagues’ regional study, that combination accounted for 61.8% of the ties classified as estranged; no contact during the past year accounted for 38.2%. Megan Gilligan, J. Jill Suitor and Karl Pillemer; Iowa State / Purdue / Cornell [S08]
| ID | Finding and interpretation | Population and actual data period | Source and locator |
|---|---|---|---|
| F48 | In the regional mother sample, about 11%—64 of 566 families—had at least one adult child classified as estranged. A mother with at least one estranged child is the unit. This is not 11% of all mother–adult child ties, or 11% of US mothers today. | Mothers aged 65–75 with at least two living adult children; maternal reports 2001-08 to 2003-01 | Original source [S08] Methods, Mother–adult child estrangement; Results, Descriptive Findings |
| F49 | Among ties classified as estranged, 38.2% involved no contact in the past year and 61.8% involved infrequent contact plus low closeness. Low closeness was 4 or below on a 1–7 scale and contact less than monthly. These are shares of already-classified ties, not national prevalence. | 76 mother–adult child ties classified as estranged in the regional study 2001-08 to 2003-01 | Original source [S08] Methods, Measures, Mother–adult child estrangement |
| F50 | Of the 64 families with estrangement, 83% had one estranged adult child and 17% more than one. Conditional family distribution, not the number of estranged children per family in the population. | 64 regional families with at least one estranged adult child 2001-08 to 2003-01 | Original source [S08] Methods, paragraph following operational definition |
The 23.6-point difference is between two components of an operational definition within already-classified ties. It is not a national difference between two kinds of family. The study’s approximately 11% result concerns mothers with at least one estranged adult child. It should not be relabeled as the share of all mother–adult child ties. [C20]
What cannot be concluded from these family estrangement statistics?
- A verified increase over time. Different polls and cohort designs do not form a consistent time series. More public discussion alone does not measure rising prevalence.
- A comparable four-country ranking. This review did not locate verified national prevalence estimates for Canada or Australia. GB’s historical measure differs from the US measures. International volunteers in one support community do not fill that gap.
- A universal reconciliation probability. Willingness, expectation, threshold-based unestrangement and lasting relationship repair are different outcomes.
- A universal causal explanation. Reported reasons, demographic associations, support seeking and communication channels cannot by themselves establish what caused estrangement.
- Individual-level overlap from marginal percentages. Separate responses about relief, stigma, holidays or reconnection cannot identify exactly who experienced a combination.
- A requirement to reconnect. Population findings cannot determine whether contact is safe or appropriate in an individual relationship.
For broader social-connection measures, see our loneliness statistics. Estrangement, loneliness, social isolation and friendship quality are related subjects, but none is a substitute measure for another.
How were the findings selected and checked?
MyLittleDesire checked original survey pages, published tables, source PDFs, academic methods and results, and original university accounts. Each database row records the source organization, title, link, publication date, observation period, geography, population, sample-size availability, method, source locator, definitions, caveats, review date and verification status. Source passages are located by table, question or report page rather than reproduced at length.
The resource contains 50 grouped findings, 146 numeric source inputs and 20 descriptive calculations. Eight source records describe eight study programs; this is not a claim that eight wholly independent institutions conducted them. Cornell’s Pillemer also coauthored the regional maternal study, but those studies use different data. YouGov supplies 12 findings, Harris 10, Hidden Voices 10, NLSY79-CYA eight, and the other programs the remaining ten.
- Dates: 12 findings use 2025 YouGov fieldwork and 10 use 2024 Harris fieldwork. The other 28 retain older observation periods. The latest fieldwork included here is 2025; source review took place in 2026. The title’s 2027 label does not make those measurements new.
- Sampling: probability-based panels, a weighted opt-in panel, a face-to-face omnibus, a regional maternal sample and a self-selected support community are not equivalent. National, cohort and convenience-sample findings remain identified.
- Historical sources: older research is included for definitions, timing, longitudinal patterns, disclosure and support experiences where the accessed original evidence is informative. It is not presented as current prevalence.
- Academic access: the Reczek publisher’s methods, results and tables were checked through web retrieval. Gilligan’s full text was available through the official NCBI BioC service. Direct local PMC HTML downloads returned access challenges; these challenge pages were not counted as full-text verification.
- Limited methods: the Cornell national result is verified through original university reporting rather than a complete questionnaire or microdata audit. The full scanned SCAL questionnaire was not transcribed; the original report and methods supplied its three selected findings.
- Rounding and comparisons: percentage points, ratios and years are labeled separately. Derived results are rounded to reader-friendly precision. No new confidence intervals, significance tests, causal models or projections were produced.
Our contribution is verification, organization, reproducible arithmetic and presentation. These are original editorial comparisons of published evidence, not new scientific discoveries or original survey fieldwork. A separate owner audit records excluded claims and unresolved source issues. Sources should be checked again before later publication or material reuse.
What are the original sources?
- [S01] YouGov. Family estrangement: How often and why it happens. Publication: 2025-08-07. Data: 2025-07-24 to 2025-08-01; four online surveys. Population: US adult citizens, age 18+; follow-ups conditional on the named estranged relationship. Self-defined current estrangement; follow-up groups are not matched relatives. Multiple reasons may be selected. Overall margin of error does not describe smaller conditional groups. Supporting original table or source 1.
- [S02] Rin Reczek, Lawrence Stacey and Mieke Beth Thomeer; Ohio State University / University of Alabama at Birmingham. Parent–adult child estrangement in the United States by gender, race/ethnicity, and sexuality. Publication: Online 2022-12-01; journal issue April 2023. Data: 1994–2018, 13 survey waves. Population: Children born to women in the NLSY79 cohort; relationships observed from age 15 onward; ages 15–46 in 2018. Not a current 2027 rate or a complete lifetime probability. Represents offspring of the original maternal cohort, not all contemporary US adults. Contact-based definition includes some low-contact ties. Re-entry is not evidence of durable repair. Supporting original table or source 1. Supporting original table or source 2.
- [S03] Ipsos MORI for Stand Alone. Family estrangement survey for Stand Alone. Publication: 2014-10-07. Data: 2014-09-12 to 2014-09-18. Population: GB residents aged 15+, including 15–17-year-olds. Historical evidence. Awareness of someone estranged includes personal experience and is not personal prevalence or a rate among families. Small base discrepancy between release and tables retained transparently. Supporting original table or source 1. Supporting original table or source 2.
- [S04] Karl Pillemer / Cornell University. Pillemer: Family estrangement a problem “hiding in plain sight”. Publication: 2020-09; corroborating Cornell interview 2021-10-05. Data: Survey reported in 2020 book; exact field dates not disclosed in the accessed university accounts. Population: US adults aged 18+ in Pillemer’s national estrangement survey. University account verifies the reported 27% and describes current estrangement. Questionnaire, weighting details and field dates were not independently checked. Do not turn the historical population extrapolation into a current count. Supporting original table or source 1.
- [S05] Lucy Blake; University of Cambridge Centre for Family Research and Stand Alone. Hidden Voices: Family Estrangement in Adulthood. Publication: 2015; exact release day not confirmed from the report. Data: Invitations sent January 2015; survey open for four months. Population: Self-identified estranged adults in Stand Alone’s support community; selected relative-specific analyses use one relationship per category. Not nationally representative in any country. No-contact and minimal-contact categories differ. Benefits and difficulties are separate marginal responses; respondent-level overlap is unknown. Longest periods without speaking are not necessarily current spell lengths.
- [S06] The Harris Poll. Family Estrangement: What the Data Reveals; original demographic cross-tabs. Publication: Original tables in November 2024; article date not displayed; current page metadata 2026-07-15. Data: Article reports fieldwork 2024-11-08 to 2024-11-11; table configuration displays date range through 2024-11-12. Population: US adults age 18+; conditional estranged base includes immediate, extended and chosen family / close friends. Some article prose is ambiguous about denominators. Original QS1Q1 tables place 35%, 34% and 27% on all-adult bases. Political subset is small. Attitudes, hypothetical willingness and realized reconnection differ. Supporting original table or source 1. Supporting original table or source 2.
- [S07] Survey Center on American Life / American Enterprise Institute; NORC AmeriSpeak panel. Emerging Trends and Enduring Patterns in American Family Life. Publication: 2022-02-09. Data: 2021-11-23 to 2021-12-14. Population: US adults age 18+; subgroup estimates conditional on stated identity. Asked whether respondents had stopped talking because of particular beliefs. Not a measure of all causes, current status, complete no contact or duration. Questions can overlap. Subgroup differences do not identify causes. Supporting original table or source 1.
- [S08] Megan Gilligan, J. Jill Suitor and Karl Pillemer; Iowa State / Purdue / Cornell. Estrangement Between Mothers and Adult Children: The Role of Norms and Values. Publication: Online 2015-05-14; journal issue August 2015. Data: 2001-08 to 2003-01. Population: Mothers aged 65–75 with at least two living adult children; maternal reports. Regional and historical, not a current national estimate. A mother with any estranged child and a single dyad are different units. Results are from mothers’ perspectives. Supporting original table or source 1. Supporting original table or source 2.
How should this page and its charts be cited?
MyLittleDesire. Family Estrangement Statistics 2027. https://mylittledesire.com/family-estrangement-statistics/.
For an underlying study finding, consult and cite the original research as appropriate. For a MyLittleDesire comparison, include its calculation ID and underlying source. Suggested chart credit: “Chart and editorial comparisons: MyLittleDesire; underlying data: [organization and actual observation year].” A link to this article lets readers inspect the definitions and calculations. Original sources retain their own terms.