
Gen Z dating is better understood through specific questions than broad claims about an entire generation. Do people want a partner? Do they feel ready? What happens on dates? Which expenses or communication habits matter?
This resource organizes 50 original-source findings from 10 survey programs, alongside four charts and reproducible descriptive comparisons. MyLittleDesire contributes the source audit, organization and calculations; the original researchers collected the survey responses.
Cite or share the online research resource
Key findings at a glance
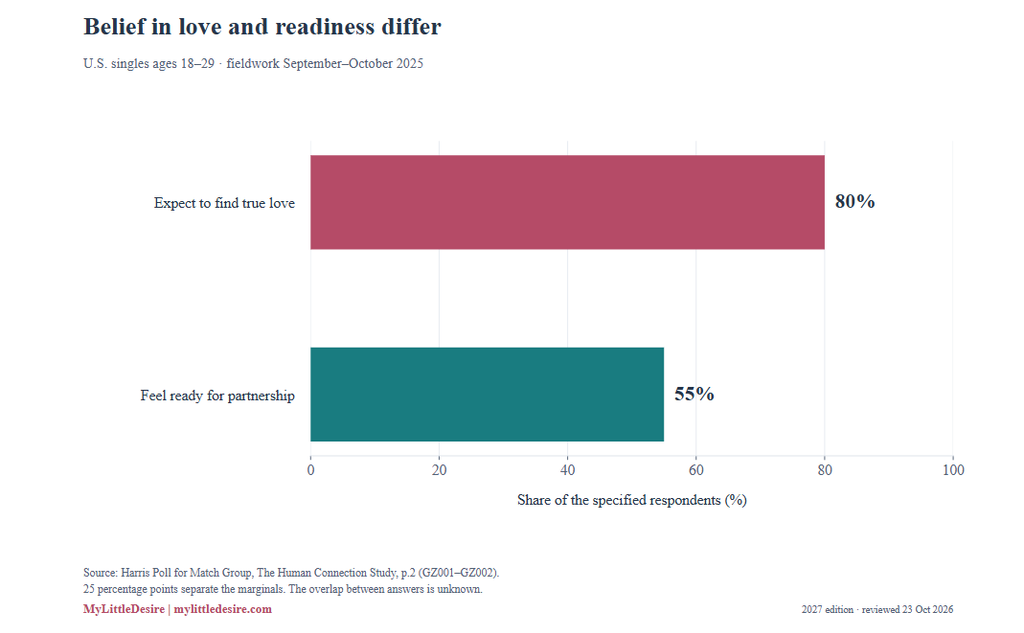
80% expected to find true love; 57% across singles overall.U.S. singles, 18–29 · 2025 · The Harris Poll / Match Group [S01] · GZ001: population and caveats
55% felt ready for a romantic partnership. Same Harris/Match survey · The Harris Poll / Match Group [S01] · GZ002: population and caveats
Enough questions: self-ratings 62%/61%; date-ratings 30%/25%. Hinge app respondents · 2025 · Hinge Labs [S02] · GZ008: population and caveats
51% spent nothing monthly on dates; 14% spent $1–50.U.S. Gen Z adults · 2026 · Bank of America / Ipsos [S03] · GZ013: population and caveats
24% delayed dating or relationship progress because of finances.U.S. Gen Z adults · 2026 · Bank of America / Ipsos [S03] · GZ016: population and caveats
Financial responsibility (74%) outweighed earning potential (51%) as valued traits.U.S. Gen Z adults · 2026 · Bank of America / Ipsos [S03] · GZ018: population and caveats
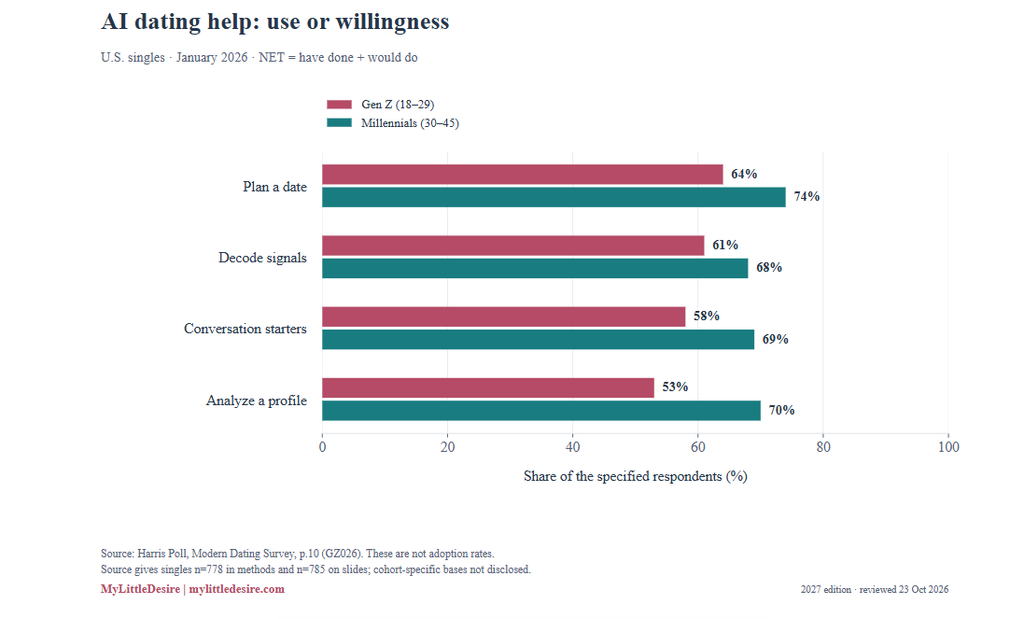
AI use-or-willingness: planning 64%, decoding signals 61%, conversation starters 58%, profile analysis 53%.U.S. singles · use OR willingness · The Harris Poll [S04] · GZ026: population and caveats
61% of unpartnered under-30s had never had a relationship.GB unpartnered adults, 18–29 · YouGov [S05] · GZ032: population and caveats
81% were interested in dating or a relationship; Millennials 78%.U.S. singles · 2026 · Match / Kinsey Institute [S08] · GZ044: population and caveats
61% found initiating in-person flirting difficult; 55% found flirting awkward.Canada, 18–30 · selected panel · Tinder Canada / Angus Reid [S09] · GZ047: population and caveats
76% said gradual tension and attraction improved a first date. Australia, actively dating, 18–25 · Tinder Australia / OnePoll [S10] · GZ049: population and caveats
Who counts as Gen Z in these statistics?
Generational boundaries vary by researcher. This page preserves each source’s age range instead of applying one definition retrospectively. It covers adult dating research. Hinge uses ages 18–28; several U.S. studies use 18–29; the Canadian flirting survey uses 18–30; the Australian study covers ages 18–25. Britain’s 18–29 results are labeled young-adult context.
Not every member of Gen Z is an adult. Nor does an older under-30 survey necessarily contain only Gen Z respondents. A claim is useful only when its date, population and definition travel with the number.
Do Gen Z singles still want relationships?
Interest in love and immediate readiness are different questions. The Harris/Match and Singles in America surveys below use distinct samples; their percentages should not be treated as a time series.
| ID | Finding | Population and date | Original source |
|---|---|---|---|
| GZ001 | 80% expected to find true love; 57% across singles overall.All singles includes Gen Z; it is not an independent older comparison group. | U.S. singles; Gen Z ages 18–29Fieldwork: 2025-09-26 to 2025-10-05 | The Harris Poll / Match Group [S01]PDF p.2, opening paragraph |
| GZ002 | 55% felt ready for a romantic partnership.A different question from belief in future love; joint overlap unknown. | U.S. Gen Z singles ages 18–29Fieldwork: 2025-09-26 to 2025-10-05 | The Harris Poll / Match Group [S01]PDF p.2, opening paragraph |
| GZ003 | 75% were not hurrying to find a partner.Not the same as rejecting relationships. | U.S. Gen Z singles ages 18–29Fieldwork: 2025-09-26 to 2025-10-05 | The Harris Poll / Match Group [S01]PDF p.3, Gen Z Relationship Readiness box |
| GZ004 | Readiness conditions included boundaries (42%) and comfort alone (41%).Separate conditions; do not add percentages or infer joint prevalence. | U.S. Gen Z singles ages 18–29Fieldwork: 2025-09-26 to 2025-10-05 | The Harris Poll / Match Group [S01]PDF p.2, Gen Z Readiness Checklist |
| GZ044 | 81% were interested in dating or a relationship; Millennials 78%.Source definition of single excludes committed relationships and cohabitation. | U.S. Gen Z singles ages 18–29 and comparison single cohortsFieldwork: March–April 2026 | Match / Kinsey Institute [S08]Release section Selective on Purpose, Yet Still Open to Love |
| GZ045 | 57% would immediately date a perfect match; Millennials 51%.Hypothetical perfect-match response, not current active dating. | U.S. Gen Z singles ages 18–29 and comparison single cohortsFieldwork: March–April 2026 | Match / Kinsey Institute [S08]Same section, following paragraph |
What gets in the way of deeper dating conversations?
Hinge’s results describe its respondents. The question-rating comparison captures a difference in perceptions; it does not measure how many questions anyone actually asked.

| ID | Finding | Population and date | Original source |
|---|---|---|---|
| GZ005 | 84% wanted new ways to deepen emotional intimacy.App-user sample. | Gen Z Hinge daters ages 18–28, worldwideFieldwork: 2025; exact dates not disclosed | Hinge Labs [S02]Webpage introduction and methodology |
| GZ006 | Waiting for the other person: 49% of straight women versus 17% of straight men.Not all women versus all men. | Heterosexual Gen Z Hinge daters; hesitation to start deep first-date conversationFieldwork: 2025; exact dates not disclosed | Hinge Labs [S02]What’s Causing the Communication Gap? first bullet |
| GZ007 | 48% of Gen Z men held back to avoid seeming excessive.Wording concerns emotional intimacy, not a diagnosed anxiety condition. | Gen Z men in Hinge researchFieldwork: 2025; exact dates not disclosed | Hinge Labs [S02]What’s Causing the Communication Gap? third bullet |
| GZ008 | Enough questions: self-ratings 62%/61%; date-ratings 30%/25%.Different perspectives, not observed counts of questions or matched partner reports. | Heterosexual and LGBTQIA+ Gen Z Hinge daters, respectivelyFieldwork: 2025; exact dates not disclosed | Hinge Labs [S02]The Best First Date Skill for 2026: first two bullets |
| GZ009 | Thoughtful prompts: follow-ups 61%, interests 50%, values 49%.Question options are not exclusive. | Gen Z Hinge datersFieldwork: 2025; exact dates not disclosed | Hinge Labs [S02]Three universal thoughtful questions bullets |
| GZ010 | 67% wanted romantic connection without relying on alcohol.Forward intention reported in 2025; not a measured 2027 behavior. | Gen Z Hinge datersFieldwork: 2025; exact dates not disclosed | Hinge Labs [S02]Gen Z Is Rewriting the Rules of Connection, first bullet |
| GZ011 | 35% wanted more voice notes from dating contacts. | Gen Z Hinge datersFieldwork: 2025; exact dates not disclosed | Hinge Labs [S02]Gen Z Is Rewriting the Rules of Connection, second bullet |
How do finances shape Gen Z dating?
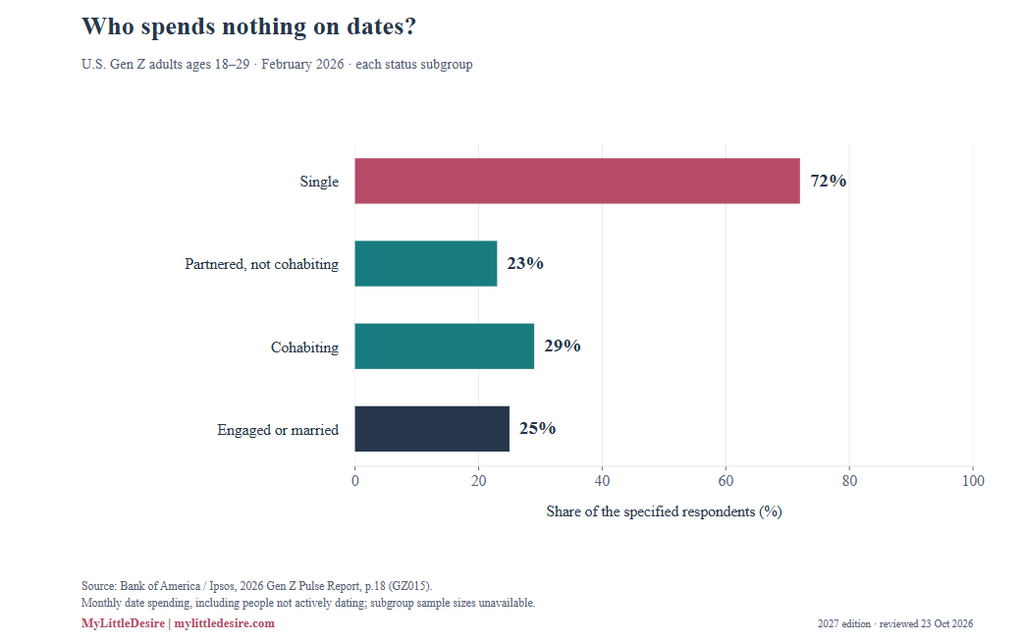
Monthly spending, hypothetical partner preferences and past relationship decisions need separate interpretations. A person reporting no spending may be single, taking a break or enjoying free dates.
Bank of America / Ipsos
| ID | Finding | Population and date | Original source |
|---|---|---|---|
| GZ013 | 51% spent nothing monthly on dates; 14% spent $1–50.Includes partnered people and people not actively dating; no per-date spending inference. | All surveyed U.S. Gen Z adults ages 18–29Fieldwork: 2026-02-10 to 2026-02-28 | Bank of America / Ipsos [S03]PDF p.17 |
| GZ014 | 56% were single: 45% not actively dating, 11% actively dating.The 45% and 11% use the full Gen Z sample, not singles as denominator. | All surveyed U.S. Gen Z adults ages 18–29Fieldwork: 2026-02-10 to 2026-02-28 | Bank of America / Ipsos [S03]PDF p.18 |
| GZ015 | No date spending: singles 72%, noncohabiting 23%, cohabiting 29%, engaged/married 25%.Cross-sectional groups; not evidence that relationship status causes spending. | Each relationship-status subgroup of U.S. Gen Z adultsFieldwork: 2026-02-10 to 2026-02-28 | Bank of America / Ipsos [S03]PDF p.18, dating spend by relationship status |
| GZ016 | 24% delayed dating or relationship progress because of finances.Broad combined outcome; do not interpret as 24% postponing marriage. | All surveyed U.S. Gen Z adults ages 18–29Fieldwork: 2026-02-10 to 2026-02-28 | Bank of America / Ipsos [S03]PDF p.19, bottom box |
| GZ017 | Among low spenders, 24% cited disinterest and 15% affordability.Conditional base; not 15% of all Gen Z. | U.S. Gen Z spending less than $50 monthly on datingFieldwork: 2026-02-10 to 2026-02-28 | Bank of America / Ipsos [S03]PDF p.19, opening paragraph |
| GZ018 | Financial responsibility (74%) outweighed earning potential (51%) as valued traits.Multiple distinct traits; no single-choice preference or causal implication. | All surveyed U.S. Gen Z adults, when choosing a potential partnerFieldwork: 2026-02-10 to 2026-02-28 | Bank of America / Ipsos [S03]PDF p.20, trait list |
| GZ019 | 43% named irresponsible spending as a romantic dealbreaker.Attitude, not measured breakup incidence. | Gen Z adults; Millennials as within-report contextFieldwork: 2026-02-10 to 2026-02-28 | Bank of America / Ipsos [S03]PDF p.21, opening box and first bullet |
| GZ020 | 61% preferred similar financial goals in a partner.Percentages need not total 100%. | All surveyed U.S. Gen Z adultsFieldwork: 2026-02-10 to 2026-02-28 | Bank of America / Ipsos [S03]PDF p.21, preferred partner traits |
| GZ021 | 18% said finances did not matter in romance. | All surveyed U.S. Gen Z adultsFieldwork: 2026-02-10 to 2026-02-28 | Bank of America / Ipsos [S03]PDF p.21, bottom paragraph |
| GZ022 | 70% wanted both partners earning, regardless of who earns more.Preference, not actual household labor or income arrangement. | All surveyed U.S. Gen Z adultsFieldwork: 2026-02-10 to 2026-02-28 | Bank of America / Ipsos [S03]PDF p.22, final statement |
| GZ023 | Zero spending differed by age: young men 60%, older men 41%.Age subgroups, not a longitudinal trajectory for the same people. | U.S. Gen Z men and women in specified age bandsFieldwork: 2026-02-10 to 2026-02-28 | Bank of America / Ipsos [S03]PDF p.18, top comparisons |
The Harris Poll
| ID | Finding | Population and date | Original source |
|---|---|---|---|
| GZ024 | 41% had remained in a relationship solely for financial security.Retrospective agreement; not current relationship dependence. | Gen Z adults ages 18–29; all relationship statusesFieldwork: 2026-01-22 to 2026-01-24 | The Harris Poll [S04]PDF p.6 |
| GZ025 | Financial green flags: budgeting 57%, suggesting cheaper dates 41%.Singles base n=778/785 inconsistent; Gen Z single subgroup size unknown. | Gen Z singles within Harris surveyFieldwork: 2026-01-22 to 2026-01-24 | The Harris Poll [S04]PDF p.7 |
Chime / Talker Research
| ID | Finding | Population and date | Original source |
|---|---|---|---|
| GZ041 | Date payment preferences: man pays 36%, split 23%, planner pays 28%.Age boundary not supplied; unlisted answers not assumed zero. | Source-labeled U.S. Gen Z single or casually dating respondentsFieldwork: 2025-06-02 to 2025-06-09 | Chime / Talker Research [S07]Paragraph beginning While older generations often stick to tradition |
| GZ042 | 34% found big spending appealing, versus 16% of Boomers.A reported attitude; not actual spending. | Source-labeled Gen Z and Boomer single/casually dating respondentsFieldwork: 2025-06-02 to 2025-06-09 | Chime / Talker Research [S07]Paragraph beginning This desire for transparency |
| GZ043 | 50% of combined Gen Z/Millennials found income openness attractive.Cannot extract a separate Gen Z percentage. | Combined Gen Z and Millennial single/casually dating respondentsFieldwork: 2025-06-02 to 2025-06-09 | Chime / Talker Research [S07]Same paragraph, income transparency sentence |
How are young adults using—or considering—AI for dating?
Willingness is not adoption. Harris’s NET figures combine people who have used a tool with those who would use it. Their Millennial comparison also shows why an AI-friendly stereotype cannot substitute for a measured question.
| ID | Finding | Population and date | Original source |
|---|---|---|---|
| GZ012 | 60% of younger Gen Z were open to AI dating help.Openness to a virtual second opinion, not actual AI use. | Hinge younger Gen Z daters ages 18–22Fieldwork: 2025; exact dates not disclosed | Hinge Labs [S02]Gen Z Is Rewriting the Rules of Connection, third bullet |
| GZ026 | AI use-or-willingness: planning 64%, decoding signals 61%, conversation starters 58%, profile analysis 53%.NET includes have done plus would do; not adoption rates. Singles n inconsistency applies. | Gen Z singles ages 18–29 and Millennial singles ages 30–45Fieldwork: 2026-01-22 to 2026-01-24 | The Harris Poll [S04]PDF p.10, NET columns |
| GZ027 | 38% would be put off by AI-planned dates.A different item from using AI personally; joint overlap unavailable; singles n inconsistency. | Gen Z singles within Harris surveyFieldwork: 2026-01-22 to 2026-01-24 | The Harris Poll [S04]PDF p.11, Plan dates for you annotation |
| GZ028 | 59% called meeting through social media cringe.Subjective response; not actual avoidance. | All Gen Z adult respondents ages 18–29Fieldwork: 2026-01-22 to 2026-01-24 | The Harris Poll [S04]PDF p.14 |
| GZ029 | 21% reported meeting their current or latest partner through social media.Slide labels total adult base; eligible Gen Z item base not supplied. Not the same as meeting through dating apps. | Gen Z respondents to partner-meeting questionFieldwork: 2026-01-22 to 2026-01-24 | The Harris Poll [S04]PDF p.15 |
| GZ030 | 37% would turn to work or school if apps disappeared.Hypothetical choice; not measured current behavior. Singles n inconsistency applies. | Gen Z singles within Harris surveyFieldwork: 2026-01-22 to 2026-01-24 | The Harris Poll [S04]PDF p.16 |
What do British young-adult tables show?
These are Great Britain age-band estimates. The filtered bases matter: percentages for unpartnered respondents cannot be applied to every person under 30.
| ID | Finding | Population and date | Original source |
|---|---|---|---|
| GZ031 | 41% were partnered, 55% unpartnered and 4% withheld status. | GB adults ages 18–29Fieldwork: 2026-07-09 to 2026-07-10 | YouGov [S05]PDF p.1, Are you currently in a relationship? |
| GZ032 | 61% of unpartnered under-30s had never had a relationship.Conditional base; not 61% of every adult under 30. | GB unpartnered adults ages 18–29Fieldwork: 2026-07-09 to 2026-07-10 | YouGov [S05]PDF p.1, Have you ever been in a relationship? |
| GZ033 | 45% of partnered under-30s cohabited; 86% at ages 30–39.Age groups, not a generational change measured at equal ages. | Partnered GB adults in each specified age bandFieldwork: 2026-07-09 to 2026-07-10 | YouGov [S05]PDF p.1, Do you live together with your partner? |
| GZ034 | Under-30 partner origins: dating apps 16%, school 18%, university 17%.Not app usage among all young adults. | GB ages 18–29 with a current or previous partnerFieldwork: 2026-07-09 to 2026-07-10 | YouGov [S05]PDF p.7, How did you first meet your current, or most recent, partner? |
| GZ035 | Unpartnered under-30s: 35% wanted romance now, 47% later, 8% never.Rounded shares total 101%; retain source values. | GB unpartnered adults ages 18–29Fieldwork: 2026-07-09 to 2026-07-10 | YouGov [S05]PDF p.9, And do you want to be in a relationship? |
| GZ036 | Reasons for being single: wrong match 51%, dating stress 35%, work/education 30%.Multiple selections; not mutually exclusive. | GB unpartnered adults ages 18–29Fieldwork: 2026-07-09 to 2026-07-10 | YouGov [S05]PDF p.9, reasons for not currently being in a relationship |
How much dating experience did earlier research record?
The historical report supplies useful context, with incomplete item-level cohort metadata. Recall, age and available time to have a relationship can all affect comparisons.
| ID | Finding | Population and date | Original source |
|---|---|---|---|
| GZ037 | 58% recalled dating in their teens or earlier, versus 80% of Boomers.Retrospective cohort comparison; precise Gen Z ages and selected survey wave not verified. | Source-labeled U.S. Gen Z adults and older cohortsFieldwork: August 16–26 and December 12–19, 2024; selected Gen Z items not individually allocated to a wave | Survey Center on American Life / American Enterprise Institute [S06]Web section Rising Pornography Use and the Decline in Teen Dating, first two paragraphs |
| GZ038 | 30% had never had a romantic date; 33% among Gen Z men.Historical report; not a measurement made in 2027. | Source-labeled U.S. Gen Z adultsFieldwork: August 16–26 and December 12–19, 2024; selected Gen Z items not individually allocated to a wave | Survey Center on American Life / American Enterprise Institute [S06]Same section, paragraph beginning Dating is significantly less common |
| GZ039 | Average first-date age was 16.9 among those who had dated.Excludes never-daters; not a median or a target age. | Source-labeled U.S. Gen Z adults who had ever gone on a dateFieldwork: August 16–26 and December 12–19, 2024; selected Gen Z items not individually allocated to a wave | Survey Center on American Life / American Enterprise Institute [S06]Paragraph before Marriage Doubts and Relationship Uncertainty |
| GZ040 | 36% reported an undefined romantic/sexual relationship: women 38%, men 34%.Ever-experience uncertainty, not current situationship prevalence. | Source-labeled U.S. Gen Z adults; Boomers as contextFieldwork: August 16–26 and December 12–19, 2024; selected Gen Z items not individually allocated to a wave | Survey Center on American Life / American Enterprise Institute [S06]The Rise of Situationships |
What do Canadian and Australian surveys add?
These local studies ask different questions of different age ranges. They expand coverage; they do not support a country ranking.
| ID | Finding | Population and date | Original source |
|---|---|---|---|
| GZ046 | Flirting blockers included social anxiety 52% and rejection fears 50%.Item-specific base not given; no clinical anxiety diagnosis implied. | Surveyed Canadian ages 18–30, single or open to flirtingFieldwork: 2025-08-19 to 2025-08-27 | Tinder Canada / Angus Reid [S09]Top blockers bullet and Methodology |
| GZ047 | 61% found initiating in-person flirting difficult; 55% found flirting awkward.Commercial panel sample; not every Canadian Gen Z adult. | Surveyed Canadian ages 18–30, single or open to flirtingFieldwork: 2025-08-19 to 2025-08-27 | Tinder Canada / Angus Reid [S09]Gen Z commonly report bullets |
| GZ048 | 81% associated yearning with early emotional connection.Association expressed by respondents; no causal experiment. | Actively dating Australians ages 18–25Fieldwork: February 2026; exact days not supplied | Tinder Australia / OnePoll [S10]The Yearn Index, second bullet; footnote 1 |
| GZ049 | 76% said gradual tension and attraction improved a first date.Stated view, not measured success rate. | Actively dating Australians ages 18–25Fieldwork: February 2026; exact days not supplied | Tinder Australia / OnePoll [S10]The Yearn Index, third bullet; footnote 1 |
| GZ050 | 49% wanted clear intentions alongside tension and anticipation.Narrow young-adult dating sample. | Actively dating Australians ages 18–25Fieldwork: February 2026; exact days not supplied | Tinder Australia / OnePoll [S10]The Yearn Index, sixth bullet; footnote 1 |
What can these comparisons tell us?
The useful contribution is making comparable bases and arithmetic easy to inspect. Several contrasts were already discussed by the original researchers. These calculations are descriptive synthesis, not new fieldwork, statistical significance tests or previously undiscovered scientific results.
| Comparison | Arithmetic | Meaning and limit |
|---|---|---|
| Belief in love minus current readiness | 80 – 55 = 25 percentage points | Difference between two survey marginals; not the share hopeful but unready. Already central to the original report. GZ001 |
| Straight Hinge daters: self versus date question ratings | 62 – 30 = 32 percentage points | Perspective difference; no objective question counts. GZ008 |
| LGBTQIA+ Hinge daters: self versus date question ratings | 61 – 25 = 36 percentage points | Parallel perspective comparison; not a claim about which orientation dates better. GZ008 |
| Zero date spending: single minus noncohabiting partnered | 72 – 23 = 49 percentage points | Within one survey and outcome; different status subgroups. No causal interpretation. GZ015 |
| AI date planning NET: Millennials minus Gen Z | 74 – 64 = 10 percentage points | NET is use or willingness, not actual use. GZ026 |
| AI profile analysis NET: Millennials minus Gen Z | 70 – 53 = 17 percentage points | Same item and survey; no test of statistical significance. GZ026 |
| GB cohabitation: partnered ages 30–39 minus 18–29 | 86 – 45 = 41 percentage points | Different age groups observed simultaneously; not a generational effect. GZ033 |
| Partner traits: responsibility minus earning potential | 74 – 51 = 23 percentage points | Different traits rated by one population; does not show 23% choose one over the other. GZ018 |
Percentage-point differences compare percentages directly. They are not relative percentage increases. Even when two questions share a sample, subtracting their percentages does not reveal how many individuals answered both ways.
Methodology and limitations
We checked the original reports or the commissioning organizations’ published results, recorded their populations and dates, and retained locators for every finding. Related response categories are often grouped into one finding. Sample sizes, chart labels and calculated gaps are not counted as additional findings. Verification means the source reports the result; it does not mean we independently replicated its underlying fieldwork.
- Source diversity: 10 survey programs across six sponsor families. No single study supplies more than 11 of the 50 finding records. Match Group commissions five programs contributing 19 records (38%); its brands and releases are not independent corroboration.
- Different eligible populations: app respondents, all young adults, singles, partnered people and people open to flirting are distinct. We do not pool their percentages.
- Disclosure gaps: Harris’s Modern Dating deck reports singles n=778 in its methods and n=785 on slides. Several reports omit subgroup counts, exact fieldwork days or cohort boundaries. Historical SCAL findings retain those unresolved limits.
- Commercial incentives: dating and finance brands commissioned much of this material. A public source and a large sample do not remove selection or framing bias.
- Country coverage: U.S. evidence is strongest here. Britain, Canada and Australia have different questions and age bands. No cross-country league table is justified.
- Uncertainty: rounded survey estimates, self-report and recall are not exact population counts. We have not calculated confidence intervals or causal effects from incomplete public data.
The downloads include source metadata, 14 calculations and a separate held-out/rejected-claim log. Examples excluded from publication include a Pew all-singles result mislabeled as Gen Z, unresolved marriage percentages, and an AI-use estimate whose underlying subgroup table could not be checked in this audit.
Complete source inventory
Each link below goes to the research organization, commissioning publisher or its original report. Findings above identify the exact page or section.
- S01. The Harris Poll / Match Group. The Human Connection Study. Published: 2026-01-21 release; PDF hosted July 2026. Fieldwork: 2025-09-26 to 2025-10-05.Source-defined Gen Z: ages 18–29; comparison generations have different age bands. 2,500 adult singles; 1,000 Gen Z; 500 each Millennials, Gen X, Boomers.
- S02. Hinge Labs. 2025 Gen Z D.A.T.E. Report. Published: 2025-11-19. Fieldwork: 2025; exact dates not disclosed.Source-defined Gen Z ages 18–28; Millennials 29–42; younger subgroup 18–22. Approximately 30,000 Hinge daters of multiple ages; Gen Z and subgroup counts not disclosed.
- S03. Bank of America / Ipsos. 2026 Gen Z Pulse Report. Published: 2026-05-19 release. Fieldwork: 2026-02-10 to 2026-02-28.Source-defined Gen Z ages 18–29. 1,133 Gen Z adults; separate general-population sample 1,146 adults.
- S04. The Harris Poll. Modern Dating Survey, February 2026. Published: 2026-02; day not supplied. Fieldwork: 2026-01-22 to 2026-01-24.Source-defined Gen Z ages 18–29; Millennials 30–45; Gen X 46–61; Boomers 62+. 2,177 adults; 307 Gen Z; singles n=778 in methodology but n=785 on result slides.
- S05. YouGov. Big Survey on Relationships: full results. Published: 2026-08-17 accompanying articles. Fieldwork: 2026-07-09 to 2026-07-10.Age band 18–29; treated as young-adult context rather than an exact birth-cohort definition. 1,882 adults; ages 18–29 n=278 unweighted, 313 weighted before question filters.
- S06. Survey Center on American Life / American Enterprise Institute. Romantic Recession: How Politics, Pessimism, and Anxiety Shape American Courtship. Published: 2025-01-29. Fieldwork: August 16–26 and December 12–19, 2024; selected Gen Z items not individually allocated to a wave.Report labels respondents Gen Z adults; precise cohort boundary not established in accessible text. August survey n=5,837 adults; December survey n=5,244 adults; item-specific Gen Z bases not verified.
- S07. Chime / Talker Research. Banking on Love: How Today’s Young Singles Are Changing the Rules of Dating. Published: 2025-08-12. Fieldwork: 2025-06-02 to 2025-06-09.Release labels Gen Z but gives no numerical age boundary; one result combines Gen Z and Millennials. 2,000 single or casually dating Americans; evenly split by generation and region; 1,000 men and 1,000 women.
- S08. Match / Kinsey Institute. 15th annual Singles in America study. Published: 2026-09-10 release; institutional release 2026-09-14. Fieldwork: March–April 2026.Source-defined Gen Z 18–29; Millennials 30–45; Gen X 46–61; Boomers 62–80. Approximately 5,000 singles; released codebook has 4,952 records and 1,543 Gen Z classifications.
- S09. Tinder Canada / Angus Reid. Canadian Gen Z flirting survey. Published: 2025-09-03. Fieldwork: 2025-08-19 to 2025-08-27.Source’s Gen Z label covers ages 18–30; broader than many Gen Z definitions. 1,159 online Canadians ages 18–30 who are single or open to flirting, Angus Reid Forum members.
- S10. Tinder Australia / OnePoll. The Yearn Index. Published: 2026-02-19. Fieldwork: February 2026; exact days not supplied.Ages 18–25 actively dating; source-defined Gen Z subset. 500 actively dating adults ages 18–25.
How to cite this page
MyLittleDesire. Gen Z Dating Statistics 2027: Research, Trends & Comparisons. 2027 planning edition; evidence reviewed October 23, 2026. https://mylittledesire.com/gen-z-dating-statistics/. Add your access date.
When discussing an underlying survey, also cite the original research organization. If reproducing one of our charts or calculated comparisons, credit “MyLittleDesire analysis of [original source]” and link to this resource and the original study. Reuse is subject to any rights in the underlying material.