Cohabitation statistics describe several different experiences: sharing a home now, having lived with an unmarried partner at any point, and living together before a marriage. A percentage can change substantially simply because the question or denominator changes.
This resource brings together 55 grouped findings from 15 source pages published by seven research organizations, covering the United States, the UK, Canada and Australia. MyLittleDesire contributes four charts and transparent calculations from published data. It did not conduct the underlying surveys or Census fieldwork.
What are the key cohabitation findings?
20.3 million
77%
US cohabiting adults aged 15+, estimated in 2024. NCFMR, Bowling Green State University [S01]
Ever cohabited by ages 38–43 in the NLSY97 cohort, through 2023. Pew Research Center [S06]
17.6%
22.7%
UK families that were cohabiting-couple families in 2025. Office for National Statistics [S07]
Canadian couples living common law in the 2021 Census. Statistics Canada [S10]
81%
18 months
Australian marriages in 2024 preceded by cohabitation. Australian Institute of Family Studies [S13]
Median cohabitation duration before marriage or breakup in the studied US cohort. Pew Research Center [S06]
31% vs 7%
7%
Stepfamilies among common-law versus married Canadian couples with children at home, 2021. Statistics Canada [S11]
US adults currently cohabiting in Pew’s 2023 ACS analysis. Pew Research Center [S02]
About 90%
35.5%
Opposite-sex couples marrying in England and Wales in 2022 who had cohabited. Office for National Statistics [S09]
Unmarried US women with a recent birth who lived with an unmarried partner, 2023. US Census Bureau [S15]
Which cohabitation number should a writer use?
Match the figure to the question, population and reference year. A national league table assembled from mismatched family, adult and marriage denominators would mislead readers.
| Question | Suitable evidence | Keep this qualification |
|---|---|---|
| How many adults live together now? | US CPS count [S01]; E&W adult estimates [S08] | People, age coverage and householder coverage must match. |
| How many people have ever lived with a partner? | NSFG experience [S03]; NLSY97 cohort [S06] | Lifetime experience differs from current status; a birth cohort differs from all adults. |
| What share of families are cohabiting? | UK family estimates [S07] | The denominator includes lone-parent families; it is not all couples or all households. |
| What share of couples live common law? | Canada Census [S10] | Couples rather than all adults; definitions are statistical, not a universal legal test. |
| How often does cohabitation precede marriage? | registrations [S09]; Australian marriage series [S13] | Conditional on marrying. It cannot estimate how many cohabiting couples will marry. |
Canada’s term “common law” and Australia’s “de facto” describe the source classifications used here. They should not be read as a single legal definition applying across countries or jurisdictions.
What comparisons does MyLittleDesire add?
The comparisons below make existing evidence easier to use. They are descriptive calculations and chart designs, not new fieldwork or novel scientific discoveries.
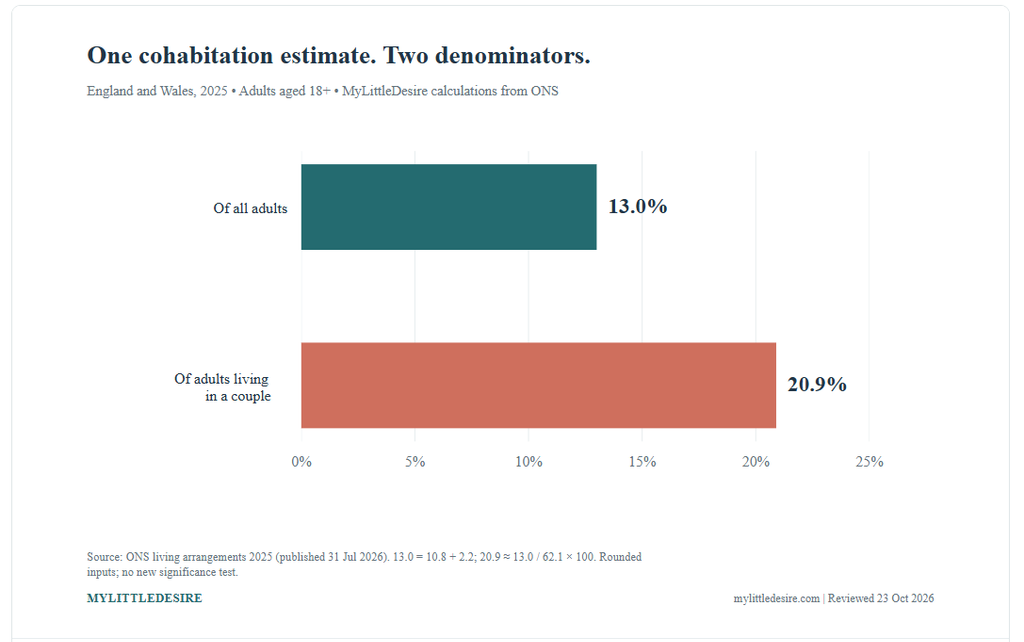
1. The same England-and-Wales estimate is 13.0% or approximately 20.9%, depending on the base
ONS reports that 10.8% of adults cohabited without a previous legal partnership and 2.2% after divorce or bereavement. Adding those categories gives 13.0% of all adults. Dividing that sum by the 62.1% living in a couple gives approximately 20.9% of partnered adults. Both expressions use the same cohabiting population. [C01–C02] Office for National Statistics [S08]
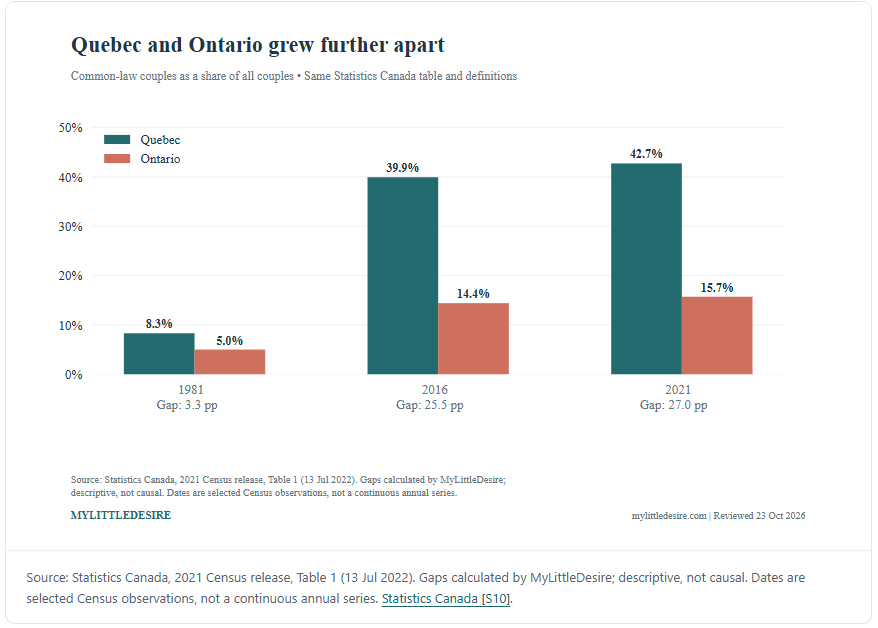
2. Quebec’s common-law gap with Ontario widened from 3.3 to 27.0 percentage points
The Quebec–Ontario difference was 3.3 percentage points in 1981, 25.5 in 2016 and 27.0 in 2021, a 23.7-point widening between the first and last observations. Each comparison uses the same source table and couple denominator. [C05–C08] Statistics Canada [S10]
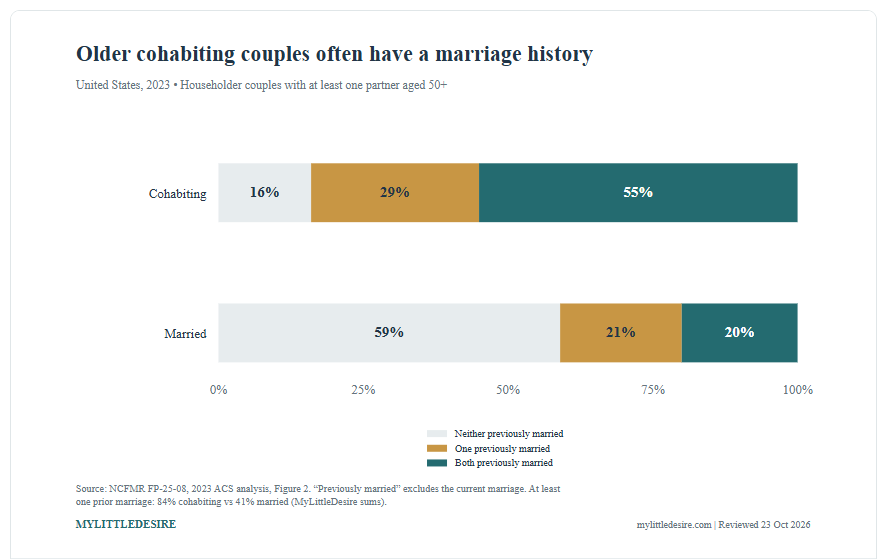
3. At least one partner had a prior marriage in 84% of older cohabiting couples
Adding the “one previously married” and “both previously married” categories gives 84% of older cohabiting couples and 41% of older married couples, a 43-point difference. Here, older means at least one partner was 50 or over. The figures describe relationship histories, not the effects of choosing a relationship type. [C15–C17] NCFMR, Bowling Green State University [S05]
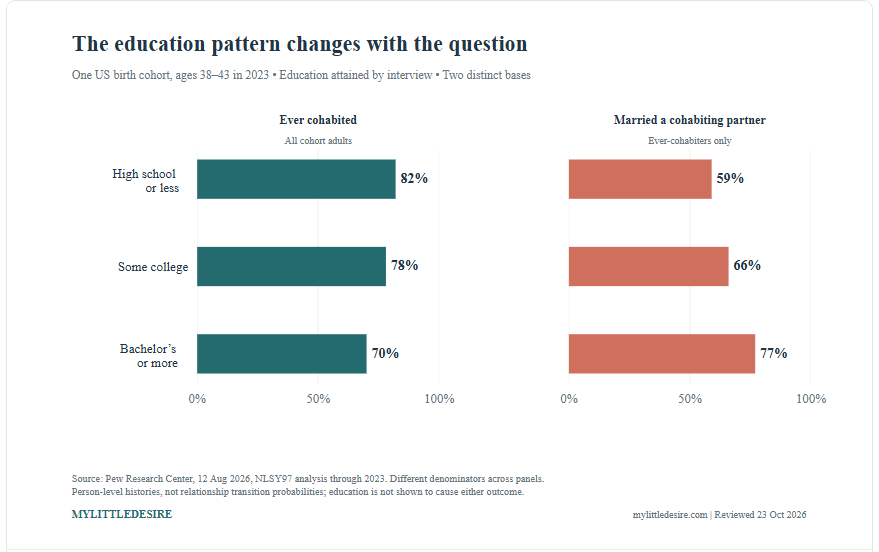
4. Education patterns differ between ever cohabiting and marrying a cohabiting partner
In Pew’s followed cohort, ever-cohabitation was 12 points higher with high school education or less than with a bachelor’s degree or more. Among people who had ever cohabited, marriage to a cohabiting partner was 18 points higher in the bachelor’s-or-more group. The questions have different denominators, shown in separate panels. Education was measured by the interview age; this is not a causal finding. [C18–C19] Pew Research Center [S06]
Another reporting angle: the Canada–Quebec parenthood reversal. Children at home were 11 percentage points less common among common-law than married couples nationally, but 4 points more common in Quebec in 2021. The difference between those gaps is 15 points. Quebec is included in the national total, and age composition differs; this is not an independent or causal comparison. [C11–C13] Statistics Canada [S11]
How common is living together in the United States?
Current cohabitation and lifetime experience answer different questions. The ACS estimate covers adults living with a householder partner; CPS pointers can identify additional cohabiting relationships elsewhere in a household.
| ID | Finding | Data period | Source |
|---|---|---|---|
| F01 | An estimated 20.3 million US adults aged 15+ cohabited in 2024, compared with 14.0 million in 2009. | 2009; 2024 | Original source [S01] |
| F02 | Pew’s ACS analysis put current cohabitation at 7% of US adults in 2023, versus 6% in 2019. | 2019; 2023 | Original source [S02] |
| F03 | Among women aged 19–44, ever-cohabitation was 56% in the recent NSFG wave, versus 64% in the 2013 comparison. Mixed-mode survey change; retain age range. | 2013 comparison; 2022 label uses 2022–2023 NSFG | Original source [S03] |
| F04 | Of women aged 19–44 who had ever cohabited in the recent NSFG wave, 64% had lived with one cohabiting partner. | 2022 label; NSFG interviews 2022–2023 | Original source [S03] |
| F05 | Ever-cohabitation was 66% among women with less than high school education and 52% among high school graduates. | 2022 label; NSFG interviews 2022–2023 | Original source [S03] |
| F06 | Recent-wave ever-cohabitation estimates were 61% for White women, 57% for Hispanic women and 46% for Black women. Mode-sensitive race comparison; see source note. | 2022 label; NSFG interviews 2022–2023 | Original source [S03] |
How often does cohabitation come before a first marriage?
Prior cohabitation was common in the recent first-marriage cohort studied by NCFMR. Its women-only, age-restricted sample should stay attached to the headline.
| ID | Finding | Data period | Source |
|---|---|---|---|
| F07 | Prior cohabitation was reported for 80% of the recent first-marriage cohort studied by NCFMR. Women-only first-marriage cohort; not all marriages. | Marriage cohort 2020–2022; NSFG 2022–2023 | Original source [S04] |
| F08 | Median first-marriage age was 27 with prior cohabitation and 26 without it in the recent cohort. | Marriage cohort 2020–2022; NSFG 2022–2023 | Original source [S04] |
| F09 | Among women without prior cohabitation, median first-marriage age rose from 23 in the 2005–2009 marriage cohort to 26 in 2020–2022. | Marriage cohorts 2005–2009 and 2020–2022 | Original source [S04] |
How do older cohabiting couples differ from married couples?
Many older cohabiting couples include partners who have been married before. These comparisons describe householder couples with at least one partner aged 50, rather than all older adults.
| ID | Finding | Data period | Source |
|---|---|---|---|
| F10 | About 6% of older householder couples were cohabiting in 2023. | 2023 | Original source [S05] |
| F11 | Among older cohabiting couples, 55% had two previously married partners, 29% one and 16% neither; married-couple figures were 20%, 21% and 59%. Prior marriage excludes current marriage. | 2023 | Original source [S05] |
| F12 | Older cohabiting partners had a mean age gap of seven years, versus four among married partners. | 2023 | Original source [S05] |
| F13 | Both partners held college degrees in 14% of older cohabiting couples versus 25% of married couples; neither did in 61% versus 49%. | 2023 | Original source [S05] |
Does living together lead to marriage, and how long does it last?
In the NLSY97 cohort, 67% of ever-cohabiters had married someone they had lived with by ages 38–43. That person-level result does not mean that 67% of all cohabiting relationships end in marriage.
| ID | Finding | Data period | Source |
|---|---|---|---|
| F14 | By ages 38–43 in 2023, 77% of the studied cohort had ever cohabited, including 37% with at least two partners. | Relationship histories 1997–2023; interviews September 2023–September 2024 | Original source [S06] |
| F15 | Ever-cohabitation was 82% with high school education or less, 78% with some college and 70% with a bachelor’s degree or more. | Relationship histories 1997–2023; interviews September 2023–September 2024 | Original source [S06] |
| F16 | Among ever-cohabiters in the cohort, 27% first cohabited before 20; this was 40% with high school or less and 12% with a bachelor’s or more. | Relationship histories 1997–2023; interviews September 2023–September 2024 | Original source [S06] |
| F17 | Among the cohort’s ever-cohabiters, 67% had married a cohabiting partner, 5% married someone they never cohabited with and 28% had not married. People’s histories, not a union-level transition rate. | Relationship histories 1997–2023; interviews September 2023–September 2024 | Original source [S06] |
| F18 | Among ever-cohabiters, 77% with a bachelor’s or more had married a cohabiting partner, versus 66% with some college and 59% with high school or less. | Relationship histories 1997–2023; interviews September 2023–September 2024 | Original source [S06] |
| F19 | The estimated median cohabiting-relationship duration was 18 months before marriage or breakup. Survival median includes ongoing censored unions. | Relationship histories 1997–2023; interviews September 2023–September 2024 | Original source [S06] |
| F20 | Of ever-cohabiters in the cohort, 26% had a cohabitation lasting at least five years, including 8% with one lasting at least ten. | Relationship histories 1997–2023; interviews September 2023–September 2024 | Original source [S06] |
| F21 | At least five years of cohabitation was reported by 34% of ever-cohabiters with high school or less, 26% with some college and 17% with a bachelor’s or more. Published 17% subtotal retained despite rounding. | Relationship histories 1997–2023; interviews September 2023–September 2024 | Original source [S06] |
Longer cohabitations and an 18-month median can coexist. A median summarizes the point where half the relationships have ended in marriage or breakup; it does not say every couple leaves cohabitation at that point.
How common is cohabitation in the UK and England and Wales?
ONS counted 3.5 million cohabiting-couple families across the UK in 2025. Its separate adult living-arrangements release covers England and Wales and uses a different denominator.
| ID | Finding | Data period | Source |
|---|---|---|---|
| F22 | The UK had an estimated 3.5 million cohabiting-couple families in 2025, representing 17.6% of all families. | Quarter 2 2025 | Original source [S07] |
| F23 | The 2015 estimates were 3.2 million cohabiting families and 17.0% of all families; ONS says the 2015–2025 increase was not statistically significant. ONS: observed increase not statistically significant. | 2015 comparison to 2025 | Original source [S07] |
| F24 | Same-sex couples represented 4.9% of cohabiting couples in 2025 versus 2.8% in 2015; ONS says this difference was not statistically significant. ONS: difference not statistically significant. | 2015; 2025 | Original source [S07] |
| F25 | In 2025, 62.1% of adults aged 18+ in England and Wales lived in a couple; 49.1% lived with a legal partner. | Mid-2025; Q2 2025 LFS | Original source [S08] |
| F26 | Of all adults aged 18+, 10.8% cohabited without a prior legal partnership and 2.2% cohabited after divorce or a partner’s death. | Mid-2025; Q2 2025 LFS | Original source [S08] |
| F27 | Cohabitation without a prior legal partnership rose from 9.8% of adults in 2015 to 10.8% in 2025. | 2015; 2025 | Original source [S08] |
How many couples live together before marrying in England and Wales?
About nine in ten opposite-sex couples marrying in 2022 had cohabited beforehand. These registration-based estimates describe people who married, rather than everyone who lived together.
| ID | Finding | Data period | Source |
|---|---|---|---|
| F28 | About nine in ten opposite-sex couples marrying in 2022 had cohabited beforehand. Approximate nine-in-ten precision as published. | 2022 | Original source [S09] |
| F29 | The comparable premarital-cohabitation share was 59.6% in 1994, the earliest available year. | 1994 | Original source [S09] |
| F30 | Premarital cohabitation was recorded for 95.2% of male same-sex marriages and 93.5% of female same-sex marriages in 2022. | 2022 | Original source [S09] |
| F31 | Among opposite-sex marriages in 2022, premarital cohabitation was 91.3% for civil ceremonies and 83.7% for religious weddings. | 2022 | Original source [S09] |
Where is living common law most prevalent in Canada?
Canada’s common-law share was 22.7% of couples in 2021. National averages conceal substantial differences between provinces, territories and age groups.
| ID | Finding | Data period | Source |
|---|---|---|---|
| F32 | Common-law couples represented 22.7% of Canadian couples in 2021, versus 21.3% in 2016 and 6.4% in 1981. | 1981; 2016; 2021 Census | Original source [S10] |
| F33 | The number of common-law couples grew 447% between 1981 and 2021, compared with 26% growth in married couples. | 1981–2021 | Original source [S11] |
| F34 | Among partnered people aged 20–24, the common-law share rose from 23% in 1981 to 79% in 2021. | 1981; 2021 | Original source [S11] |
| F35 | Among partnered people aged 55–69, the common-law share rose from 13% in 2016 to 16% in 2021. | 2016; 2021 | Original source [S11] |
| F36 | Among people aged 85+ living in a couple, 5% lived common law in 2021. | 2021 | Original source [S11] |
| F37 | Quebec’s common-law share was 42.7% in 2021 versus Ontario’s 15.7%; the corresponding pairs were 39.9%/14.4% in 2016 and 8.3%/5.0% in 1981. | 1981; 2016; 2021 Census | Original source [S10] |
| F38 | Excluding Quebec, 17% of couples lived common law in 2021, compared with the rounded national headline of 23%. | 2021 | Original source [S11] |
| F39 | In 2021, common-law shares were 51.7% in Nunavut, 35.7% in Northwest Territories and 32.8% in Yukon. | 2021 | Original source [S10] |
| F40 | Common-law couples made up 21% of couples in large urban centres, versus 27% in smaller urban centres and 27% in rural areas outside urban centres. | 2021 | Original source [S11] |
Do children and repartnering change the picture?
Children lived at home with a smaller share of common-law than married couples across Canada, while the direction reversed in Quebec. Age composition and regional context matter.
| ID | Finding | Data period | Source |
|---|---|---|---|
| F41 | Children of any age lived at home with 42% of common-law couples and 53% of married couples in 2021. Children of any age living at home. | 2021 | Original source [S11] |
| F42 | The share of common-law couples with children at home fell from 44% in 2016 to 42% in 2021. | 2016; 2021 | Original source [S11] |
| F43 | In Quebec, children lived at home with 49% of common-law couples and 45% of married couples in 2021. | 2021 | Original source [S11] |
| F44 | Among couples with children at home, 31% of common-law couples were stepfamilies versus 7% of married couples. Only couples with children at home. | 2021 | Original source [S11] |
| F45 | The median age of people in common-law unions was 41.2 years, compared with 55.2 among married people. | 2021 | Original source [S11] |
What do Australian cohabitation and premarital statistics show?
ABS counted more than two million people in de facto marriages in 2021. A separate marriage series shows that 81% of couples marrying in 2024 had lived together first.
| ID | Finding | Data period | Source |
|---|---|---|---|
| F46 | The 2021 Census counted 2,168,351 people in de facto marriages: 11.5% of the social-marital-status population shown. People, not couples; usual residents present. | 2021 Census, August 10, 2021 | Original source [S12] |
| F47 | The equivalent de facto share was 10.4% in 2016, when 1,751,736 people were counted, versus 11.5% in 2021. | Census nights 2016; 2021-08-10 | Original source [S12] |
| F48 | In 2024, 81% of couples marrying in Australia had lived together beforehand. | 2024 | Original source [S13] |
| F49 | The Australian premarital-cohabitation share was 23% in 1979 and 71% by 2000. | 1979; 2000 | Original source [S13] |
Using the ABS social-status counts, de facto relationships represented approximately 19.9% of people in the table’s registered-marriage or de facto categories: 2,168,351 ÷ (2,168,351 + 8,747,135). This changes the base from the broader social-status population to partnered people; it does not create a harmonized international ranking. [C20] Australian Bureau of Statistics [S12]
Why do people move in together?
Love and companionship were the leading major reasons in Pew’s 2019 survey. These historical attitudes add context; they are not new measurements for this edition.
| ID | Finding | Data period | Source |
|---|---|---|---|
| F50 | In 2019, 73% of cohabiting adults cited love and 61% companionship as major reasons for moving in together. | 2019-06-25 to 2019-07-08 | Original source [S14] |
| F51 | Finances were a major reason for 38% of cohabiting adults in 2019, and convenience for 37%. | 2019-06-25 to 2019-07-08 | Original source [S14] |
| F52 | Wanting children someday was a major reason for moving in for 14% of cohabiters, versus 31% citing it as a reason to marry among married adults. | 2019-06-25 to 2019-07-08 | Original source [S14] |
| F53 | Among cohabiters who were not engaged when they moved in, 44% said they had viewed the move as a step toward marriage. | 2019-06-25 to 2019-07-08 | Original source [S14] |
| F54 | Among cohabiters not engaged in 2019, 41% wanted to marry someday, 24% did not and 35% were unsure; among those wanting marriage, 58% thought marrying their current partner very likely. 58% has a further conditional denominator. | 2019-06-25 to 2019-07-08 | Original source [S14] |
Does unmarried parenthood mean living without a partner?
No. The Census Bureau found that 35.5% of unmarried US women with a recent birth lived with an unmarried partner in 2023. “Unmarried” and “unpartnered” cannot be substituted for one another.
| ID | Finding | Data period | Source |
|---|---|---|---|
| F55 | Among unmarried women aged 15–50 who had given birth in the previous year, 35.5% lived with an unmarried partner in 2023. Unmarried at interview; not all mothers. | 2023 ACS | Original source [S15] |
How was this research checked?
MyLittleDesire reviewed original statistical-agency releases, university research profiles and original Pew analyses. Findings were checked against source text or tables, with geography, population, observation period, units and limitations retained in the research database. The article groups related response categories into findings instead of presenting every table cell as a separate study.
The database contains 55 grouped findings, 123 numeric observations and 24 transparent calculations. These are not 55 independent surveys. Publications share underlying programs, including the ACS, CPS, NSFG, NLSY97, UK LFS, national Censuses and marriage registrations. Seven publishers do not imply seven independent replications of every finding.
- Timing: 2027 is the edition label. Recent underlying observations generally end in 2023–2025; the Canadian and Australian Census observations are from 2021. Older marriage trends and 2019 attitudes are clearly historical.
- Definitions: adults, couples, families, marrying couples and ever-cohabiters are kept separate. Ages and householder coverage vary. No pooled international rate is calculated.
- Sample sizes: where a profile does not disclose its analytical sample, the database says so. Weighted population counts are not sample sizes, and original panel enrollment is not the final analytical sample.
- Uncertainty: ONS’s nonsignificant UK changes retain that qualification. New arithmetic comparisons use rounded published inputs and have no independently calculated confidence intervals.
- Rounding: percentage-point differences, percentage changes and ratios are labelled separately. Published subtotals take priority over sums of independently rounded cells, including Pew’s 17% five-year subtotal for graduates.
- Interpretation: descriptive associations do not show that cohabitation causes marriage, breakup, educational attainment or family differences. Cohort outcomes are not personalized forecasts.
- Exclusions: unresolved denominator claims, unsupported divorce-risk headlines, mixed-period forecasts and unverifiable observations are omitted from publishable findings.
MyLittleDesire’s contribution is source verification, organization, reusable visualizations and reproducible arithmetic. Original research belongs to the named organizations.
What are the original sources?
- [S01] NCFMR, Bowling Green State University. Age Variation in Prevalence of Cohabitation Among Unmarried Men and Women, 2009 & 2024. Published: 2025 (FP-25-04). Data: 2009; 2024. Checked October 23, 2026.
- [S02] Pew Research Center. Share of U.S. adults living without a romantic partner has ticked down in recent years. Published: 2025-01-08. Data: 2019; 2023. Checked October 23, 2026.
- [S03] NCFMR, Bowling Green State University. Thirty-five Years of Changing Cohabitation Experience in the U.S., 1987–2022. Published: 2025 (FP-25-26; page updated 2026-10-06). Data: 2013 comparison; 2022 label uses 2022–2023 NSFG. Checked October 23, 2026.
- [S04] NCFMR, Bowling Green State University. Trends in Cohabitation Prior to Marriage. Published: 2025 (FP-25-25; page updated 2026-07-08). Data: Marriages 2020–2022; survey 2022–2023; historical marriage cohorts. Checked October 23, 2026.
- [S05] NCFMR, Bowling Green State University. Older Adult Cohabiting and Married Couples. Published: 2025 (FP-25-08). Data: 2023. Checked October 23, 2026.
- [S06] Pew Research Center. Most U.S. adults have lived with a romantic partner they’re not married to by their early 40s. Published: 2026-08-12. Data: Relationship histories 1997–2023; interviews September 2023–September 2024. Checked October 23, 2026.
- [S07] Office for National Statistics. Families and households in the UK: 2025. Published: 2026-04-17. Data: Quarter 2 2025; 2015 comparison. Checked October 23, 2026.
- [S08] Office for National Statistics. Population estimates by marital status and living arrangements, England and Wales: 2025. Published: 2026-07-31. Data: Mid-2025, Q2 2025 LFS; age-consistent 2015 comparison. Checked October 23, 2026.
- [S09] Office for National Statistics. Marriages in England and Wales: 2021 and 2022. Published: 2024-06-20. Data: 1994; 2022 marriages. Checked October 23, 2026.
- [S10] Statistics Canada. Proportion of couples living common law, Canada, provinces and territories, 1981, 2016 and 2021 (Table 1). Published: 2022-07-13 (table modified 2022-12-21). Data: 1981; 2016; 2021 Census. Checked October 23, 2026.
- [S11] Statistics Canada. State of the union: Canada leads the G7 with nearly one-quarter of couples living common law, driven by Quebec. Published: 2022-07-13. Data: 2021 Census; comparisons 1981 and 2016. Checked October 23, 2026.
- [S12] Australian Bureau of Statistics. 2021 Census All persons QuickStats: Australia — social marital status. Published: 2022 Census release; page-specific publication date not displayed. Data: Census nights 2016; 2021-08-10. Checked October 23, 2026.
- [S13] Australian Institute of Family Studies. Marriages in Australia — living together before marriage. Published: 2026-03-19. Data: 1979; 2000; 2024 marriages. Checked October 23, 2026.
- [S14] Pew Research Center. Why people get married or move in with a partner. Published: 2019-11-06. Data: 2019-06-25 to 2019-07-08. Checked October 23, 2026.
- [S15] US Census Bureau. New Data Show Fewer Women Gave Birth While Unmarried in the Past Decade. Published: 2026-01-28. Data: 2023 ACS; birth in previous 12 months. Checked October 23, 2026.
How should this page and its charts be cited?
MyLittleDesire. Cohabitation & Living Together Statistics 2027 . https://mylittledesire.com/cohabitation-statistics/.
For a source-reported finding, also cite or consult the original research. For a MyLittleDesire calculation, identify the calculation ID and underlying source. Suggested chart credit: “Chart and calculations: MyLittleDesire; underlying data: [named source and year].” Link to the article so readers can inspect definitions and methods.