
Breakup statistics are useful only when the relationship, population and time period are clear. This resource brings together 55 grouped findings from 15 source records about relationship endings, communication, initiation, digital behavior, reconciliation and adjustment. It also provides four source-labelled charts and reproducible calculations.
What are the key breakup findings?
The most useful findings answer a defined question. Keep the population and study period attached when quoting them.
77%
46%
Found actually ending a relationship difficult, among GB adults with an ended relationship, July 2026. Source [S03]
Found recognizing that it needed to end difficult, in that same GB group. Source [S03]
70%
28%
Found getting over a breakup difficult, in that same GB group. Source [S03]
Were friends with at least one ex, among GB adults with an ended relationship. Source [S03]
39.4% / 35.6%
77%
Men / women citing growing apart after an ended live-in union in Britain, Natsal-3, 2010–2012. Source [S04]
Cited communication or arguing in a selected US program-study breakup sample, reported in 2022. Source [S05]
8%
63%
Would ignore further contact after an unwanted first date, among single-and-looking US adults, 2019. This is intention. Source [S01]
Historical US teen social-media users with relationship experience who felt supported through a breakup, 2014–2015. Source [S02]
68.4%
~7% / ~9%
Reported ongoing contact with the ex in a Canadian young-adult convenience cohort, n=187 context responses. Source [S08]
Five-year household reunion after marital / cohabiting separation in Australian HILDA data, 2001–2023. Source [S09]
Within 3 months
~3–4 years
Mean depressive-symptom scores returned to baseline in a young-adult single-breakup cohort (n=156), published 2023. Source [S11]
Mean life satisfaction returned to baseline after dissolution among Australian women born 1946–1951, data 1996–2019. Source [S10]
What counts as a breakup in this article?
Dating breakup means the end of a romantic dating relationship in the named study. Separation may mean the end of a shared household or partnership, even without a legal divorce. Divorce is the legal end of a marriage. Reunion in the Australian panel means living together again. A first date that does not lead to another is not automatically an established relationship breakup.
Also Read:-
Relationship Satisfaction, Trust & Communication Statistics 2027
Loneliness Statistics 2027: Data, Sources and Trends
How common are breakups, and how does duration change the picture?
There is no single comparable breakup rate across these countries. A five-year survey response, a yearly panel estimate and a lifetime first-union history measure different things.
| ID | Finding and interpretation | Population and actual data period | Source |
|---|---|---|---|
| F01 | In an Australian survey, 22% of ever-partnered adults reported a breakup and 6% a divorce in the previous five years. Conditional on ever having a romantic partner. Not an annual rate; do not add the two percentages without verified disjoint categories. | Ever-partnered Australian adults in commissioned survey 2025-08-13 to 2025-08-18; experiences in preceding five years | Original source [S13] |
| F02 | Across variable observation periods in Australia’s HILDA panel, 29% of 11,886 co-resident couples separated. Observation spans 2001–2023, not one year. Relationship duration and available follow-up differ. This is not the breakup rate for dating relationships. | Co-resident couples observed at least twice; separated couples followed for household reunion 2001–2023, HILDA waves 1–23 | Original source [S09] |
| F03 | For opposite-sex couples followed in 2009–2015, weighted annual breakup estimates were 1.2% for married couples, 9.4% for unmarried ever-cohabiters and 30.3% for unmarried never-cohabiters. Historical rates for different relationship populations. Age, duration and selection differ; marriage is not randomly assigned. Not a personal or 2027 forecast. | Adults in opposite-sex relationships followed in How Couples Meet and Stay Together 2009–2015 | Original source [S06] |
| F04 | Reported first-union survival was 96% at one year, 84% at five, 75% at ten, 70% at fifteen, 65% at twenty and 58% at forty years. Retrospective 2017 Canadian histories; marriage/common-law first unions only. Widowed respondents excluded. Rounded survival estimates, not annual rates. | Non-institutionalized respondents aged 20+ ever in a first marriage/common-law union beginning at age 15+ 2017 General Social Survey, retrospective first-union histories | Original source [S07] |
| F05 | By interview, dissolution was reported for 24.2% of first marriages, 32.3% of common-law first unions that became marriages and 64.6% of common-law-only first unions. Snapshot with unequal histories, cohorts and exposure time. These percentages do not estimate equal-duration causal risks of choosing one union type. | Non-institutionalized respondents aged 20+ ever in a first marriage/common-law union beginning at age 15+ 2017 General Social Survey, retrospective first-union histories | Original source [S07] |
| F06 | First unions begun before age 25 had an observed dissolution share of 43.2%, compared with 26.1% for those begun at 25 or older. Unadjusted observed status by 2017; different exposure times and selection. Not evidence that waiting alone prevents breakup. | Non-institutionalized respondents aged 20+ ever in a first marriage/common-law union beginning at age 15+ 2017 General Social Survey, retrospective first-union histories | Original source [S07] |
| F07 | In a Canadian community cohort of partnered young adults, 196 of 1,385 participants (14.2%) experienced a breakup during the relationship follow-up. Selected French-understanding young adults recruited in 2020; follow-up up to 12 months. Not the national Canadian breakup rate. | French-understanding, internet-using, romantically partnered adults aged 18–25 Recruited 2020-03 to 2020-09; up to 12-month relationship follow-up and six-month post-breakup follow-up | Original source [S08] |
A more useful duration comparison: equal five-year intervals
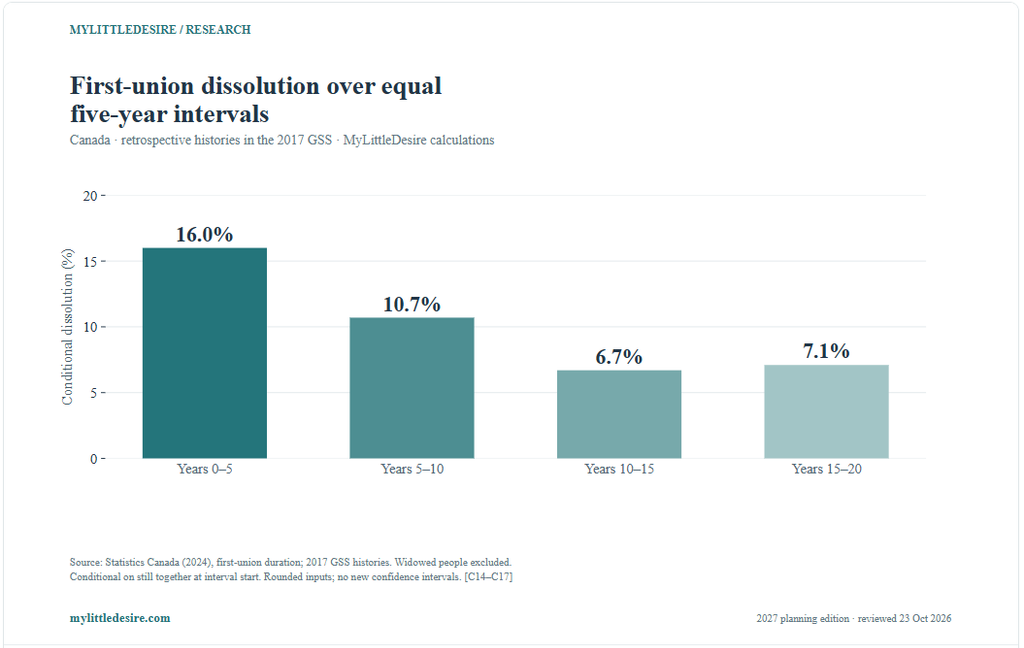
Statistics Canada reports first-union survival of 84% after five years, 75% after ten, 70% after fifteen and 65% after twenty. MyLittleDesire converted these rounded cumulative values into conditional dissolution over equal five-year intervals: 16.0%, 10.7%, 6.7% and 7.1%. Each denominator includes only first unions still ongoing at the beginning of that interval. [C14–C17] Statistics Canada; Clémence Zossou and Solène Lardoux [S07]
For years five to ten, the calculation is (84 − 75) ÷ 84 × 100 = 10.7%. This is more informative than comparing unequal cumulative durations, but it remains arithmetic from published estimates. It does not control cohort differences, establish a smooth decline or predict any individual couple’s future.
Why do people say relationships end?
Growing apart and arguments were common in Britain’s Natsal-3 ended live-in unions. A separate US program-study sample frequently reported communication problems. Their percentages should not be pooled.
| ID | Finding and interpretation | Population and actual data period | Source |
|---|---|---|---|
| F08 | Growing apart was reported by 39.4% of men and 35.6% of women whose most recent live-in union had ended. Britain, 2010–2012; most recent marriage/cohabitation ended in preceding five years. Multiple reasons permitted; respondent sex is not the alleged partner’s sex. These are not current all-dating breakup rates. | Adults aged 16–74 reporting an ended marriage/cohabiting partnership that lasted at least one month 2010-09 to 2012-08; most recent live-in union ended in preceding five years | Original source [S04] |
| F09 | Arguments were reported by 27.0% of men and 30.3% of women after an ended live-in union. Britain, 2010–2012; most recent marriage/cohabitation ended in preceding five years. Multiple reasons permitted; respondent sex is not the alleged partner’s sex. These are not current all-dating breakup rates. | Adults aged 16–74 reporting an ended marriage/cohabiting partnership that lasted at least one month 2010-09 to 2012-08; most recent live-in union ended in preceding five years | Original source [S04] |
| F10 | Infidelity was cited by 18.0% of men and 23.6% of women after an ended live-in union. Britain, 2010–2012; most recent marriage/cohabitation ended in preceding five years. Multiple reasons permitted; respondent sex is not the alleged partner’s sex. These are not current all-dating breakup rates. | Adults aged 16–74 reporting an ended marriage/cohabiting partnership that lasted at least one month 2010-09 to 2012-08; most recent live-in union ended in preceding five years | Original source [S04] |
| F11 | Lack of respect or appreciation was cited by 17.1% of men and 24.8% of women. Britain, 2010–2012; most recent marriage/cohabitation ended in preceding five years. Multiple reasons permitted; respondent sex is not the alleged partner’s sex. These are not current all-dating breakup rates. | Adults aged 16–74 reporting an ended marriage/cohabiting partnership that lasted at least one month 2010-09 to 2012-08; most recent live-in union ended in preceding five years | Original source [S04] |
| F12 | Domestic violence was reported as a reason by 3.7% of men and 15.9% of women. Britain, 2010–2012; most recent marriage/cohabitation ended in preceding five years. Multiple reasons permitted; respondent sex is not the alleged partner’s sex. These are not current all-dating breakup rates. | Adults aged 16–74 reporting an ended marriage/cohabiting partnership that lasted at least one month 2010-09 to 2012-08; most recent live-in union ended in preceding five years | Original source [S04] |
| F13 | Not sharing housework was cited by 6.8% of men and 14.4% of women; money problems by 7.3% and 11.8%, respectively. Britain, 2010–2012; most recent marriage/cohabitation ended in preceding five years. Multiple reasons permitted; respondent sex is not the alleged partner’s sex. These are not current all-dating breakup rates. | Adults aged 16–74 reporting an ended marriage/cohabiting partnership that lasted at least one month 2010-09 to 2012-08; most recent live-in union ended in preceding five years | Original source [S04] |
| F14 | Among 356 unmarried program-study participants whose relationships ended, 77% reported poor communication or too much arguing. Selected program population, not a national probability sample of breakups. Includes 32 people from couples where both partners responded. Descriptive results do not establish program effects. | Unmarried adults whose baseline romantic relationship had ended in three relationship-education program evaluations 12-month follow-up at two sites; 30-month follow-up at one site; precise field dates not established here | Original source [S05] |
| F15 | In the same selected US sample, 46% cited cheating and 33% abuse or violence. Selected program population, not a national probability sample of breakups. Includes 32 people from couples where both partners responded. Descriptive results do not establish program effects. | Unmarried adults whose baseline romantic relationship had ended in three relationship-education program evaluations 12-month follow-up at two sites; 30-month follow-up at one site; precise field dates not established here | Original source [S05] |
| F16 | In that sample, 31% cited a partner’s inability to keep a job or contribute financially, and 18% living too far apart. Selected program population, not a national probability sample of breakups. Includes 32 people from couples where both partners responded. Descriptive results do not establish program effects. | Unmarried adults whose baseline romantic relationship had ended in three relationship-education program evaluations 12-month follow-up at two sites; 30-month follow-up at one site; precise field dates not established here | Original source [S05] |
| F17 | Participants assigned blame to the partner alone in 48% of cases, to themselves or both partners in 26%, and to neither in 26%. Selected program participants’ perceptions, not an independent assessment of responsibility. | Unmarried adults whose baseline romantic relationship had ended in three relationship-education program evaluations 12-month follow-up at two sites; 30-month follow-up at one site; precise field dates not established here | Original source [S05] |
| F18 | For 64%, the breakup was definitely a good thing; 24% said maybe, and 13% said it may not or definitely was not a good thing. Perceptions in a selected sample. Published rounded categories sum to 101%; retain original rounding. | Unmarried adults whose baseline romantic relationship had ended in three relationship-education program evaluations 12-month follow-up at two sites; 30-month follow-up at one site; precise field dates not established here | Original source [S05] |
| F35 | A single reason was reported by 56.3% of men and 48.8% of women; three or more reasons by 24.2% and 30.9%, respectively. Historical ended live-in unions. Multiple reasons are interrelated, so adding their separate prevalence does not produce a breakup probability. | Adults aged 16–74 reporting an ended marriage/cohabiting partnership that lasted at least one month 2010-09 to 2012-08; most recent live-in union ended in preceding five years | Original source [S04] |
Why the percentages do not add to 100%: people could report several reasons. Communication, finances, distance, conflict and harmful behavior can occur together. A respondent’s explanation is also different from an independently established cause. The Natsal analysis concerned marriages and cohabitation, while the US report concerned unmarried adults in program evaluations.
Who initiates breakups?
The answer depends on relationship type and how initiation is measured. “Ever initiated a breakup” describes a person’s history; it is different from the share of breakup events wanted by one partner.
| ID | Finding and interpretation | Population and actual data period | Source |
|---|---|---|---|
| F19 | The weighted female-wanted breakup score was 69% for marriages, 56% for nonmarital ever-cohabiters and 53.4% for nonmarital never-cohabiters. Not the percentage of female-only initiators: mutual breakups receive half credit. Nonmarital intervals include 50. Historical opposite-sex relationships only. | Adults in opposite-sex relationships followed in How Couples Meet and Stay Together 2009–2015 | Original source [S06] |
| F20 | Mutual breakups were reported in 19% of marital breakups, 32% of nonmarital ever-cohabiting breakups and 35% of nonmarital never-cohabiting breakups. Weighted shares of breakup events by relationship type, 2009–2015; mutual refers to both partners equally wanting the breakup. | Adults in opposite-sex relationships followed in How Couples Meet and Stay Together 2009–2015 | Original source [S06] |
| F21 | Among Britons who had experienced an ended relationship, 63% had initiated a breakup: 68% of women and 57% of men. Lifetime person-level experience conditional on an ended relationship. Not the share of all breakup events initiated by each sex. | GB adults; most experience/difficulty findings are conditional on having had a relationship that ended 2026-07-09 to 2026-07-10 | Original source [S03] |
| F22 | In that same group, 66% had been dumped: 70% of men and 62% of women. A person can have initiated one breakup and received another. These experiences are not mutually exclusive. | GB adults; most experience/difficulty findings are conditional on having had a relationship that ended 2026-07-09 to 2026-07-10 | Original source [S03] |
| F23 | A mutual breakup had been experienced by 46% of Britons who had had a relationship end. Lifetime person-level experience; not 46% of all breakup events. | GB adults; most experience/difficulty findings are conditional on having had a relationship that ended 2026-07-09 to 2026-07-10 | Original source [S03] |
Why “women initiate 70% of all breakups” is an overstatement. Rosenfeld’s marital estimate was a weighted score that assigned 0 to male-wanted, 0.5 to mutual and 1 to female-wanted breakups. The nonmarital scores were lower, and their confidence intervals included 50%. The result should not be rewritten as the share of female-only initiators across all relationships. Michael J. Rosenfeld; Stanford University [S06]
How do people view phone, text and in-person breakups?
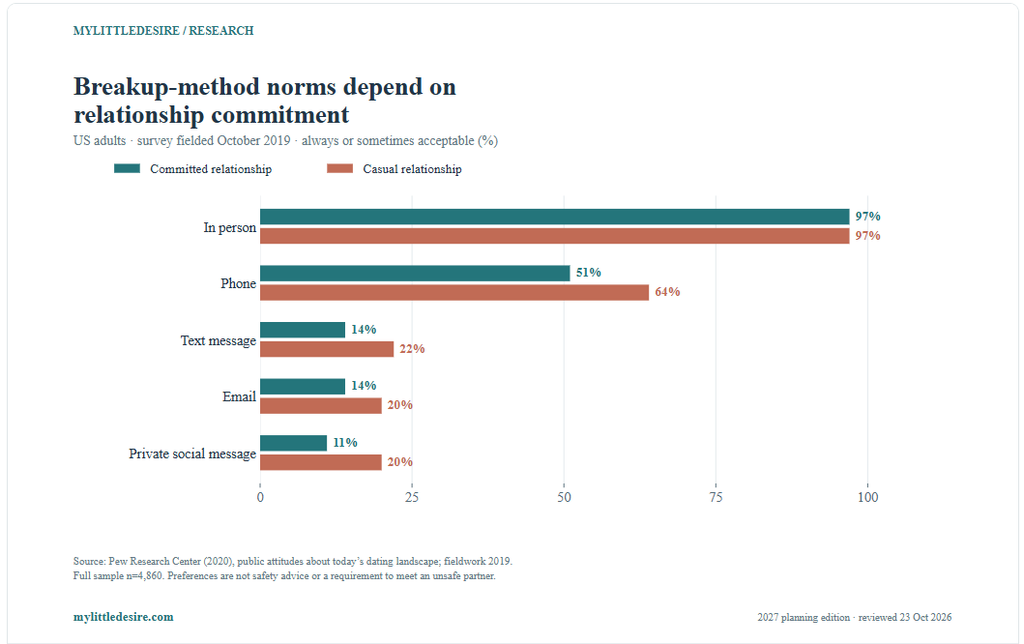
US adults surveyed in 2019 generally accepted an in-person breakup in both casual and committed scenarios. Acceptability of phone and digital methods was lower for committed relationships.
| ID | Finding and interpretation | Population and actual data period | Source |
|---|---|---|---|
| F24 | An in-person breakup was considered always or sometimes acceptable by 97% for a committed relationship and 97% for a casual one; 88% always approved in the committed scenario. US adult attitudes in 2019. Social preferences are not safety advice or a requirement to meet an unsafe partner. | Adults aged 18+; first-date intentions use single adults looking for a relationship or dates 2019-10-16 to 2019-10-28 | Original source [S01] |
| F25 | Phone was considered an acceptable breakup method by 51% for a committed relationship and 64% for a casual relationship. Always/sometimes acceptable combined, US adults surveyed in 2019. This measures norms, not the method people actually used. | Adults aged 18+; first-date intentions use single adults looking for a relationship or dates 2019-10-16 to 2019-10-28 | Original source [S01] |
| F26 | Text message was considered an acceptable breakup method by 14% for a committed relationship and 22% for a casual relationship. Always/sometimes acceptable combined, US adults surveyed in 2019. This measures norms, not the method people actually used. | Adults aged 18+; first-date intentions use single adults looking for a relationship or dates 2019-10-16 to 2019-10-28 | Original source [S01] |
| F27 | Email was considered an acceptable breakup method by 14% for a committed relationship and 20% for a casual relationship. Always/sometimes acceptable combined, US adults surveyed in 2019. This measures norms, not the method people actually used. | Adults aged 18+; first-date intentions use single adults looking for a relationship or dates 2019-10-16 to 2019-10-28 | Original source [S01] |
| F28 | Private social-media message was considered an acceptable breakup method by 11% for a committed relationship and 20% for a casual relationship. Always/sometimes acceptable combined, US adults surveyed in 2019. This measures norms, not the method people actually used. | Adults aged 18+; first-date intentions use single adults looking for a relationship or dates 2019-10-16 to 2019-10-28 | Original source [S01] |
| F29 | After an unwanted first date, 8% of single-and-looking adults said they would ignore further contact, 40% would proactively say they were not interested and 52% would explain if contacted. Hypothetical intentions, not measured ghosting prevalence. A first date is not necessarily an established relationship. | US single adults looking for a relationship or dates 2019-10-16 to 2019-10-28 | Original source [S01] |
The commitment gap is largest for phone breakups
Using the same survey and response definition, casual-relationship approval exceeded committed-relationship approval by 13 percentage points for phone, 8 for text, 6 for email and 9 for private social messages. In-person approval had no gap. These are convenient descriptive comparisons, not new fieldwork or tests of whether one method is better. [C01–C05] Pew Research Center [S01]
How difficult is ending a relationship and moving on?
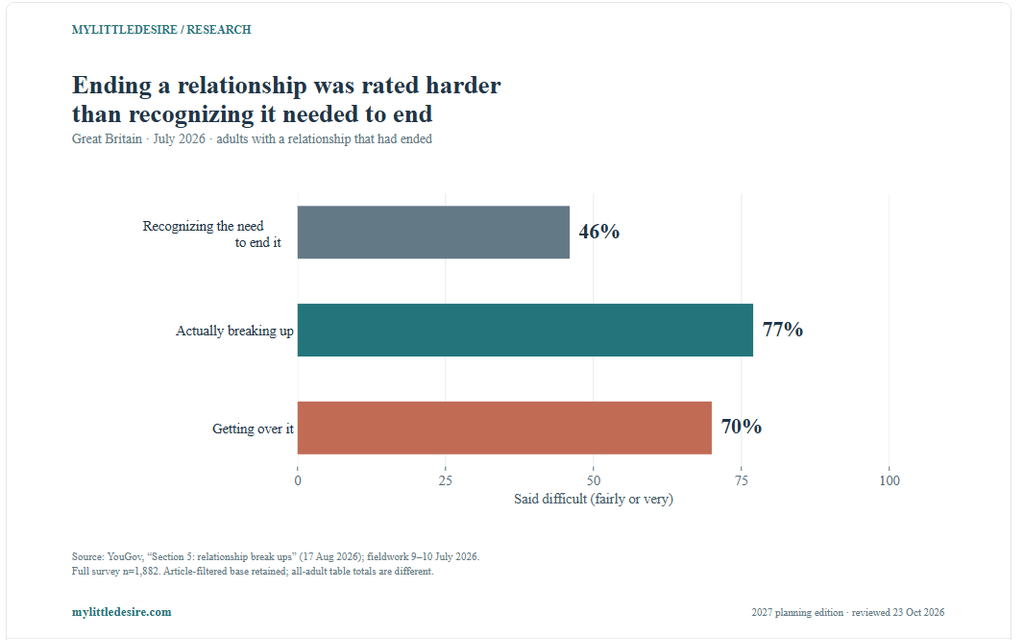
In YouGov’s 2026 British survey, actually ending the relationship and getting over it were more often described as difficult than recognizing that it should end. These are separate assessments, not a measured healing sequence.
| ID | Finding and interpretation | Population and actual data period | Source |
|---|---|---|---|
| F30 | Recognizing that a relationship needed to end was difficult for 46%; actually ending it for 77%; getting over it for 70%. Separate questions within the same filtered population. Do not substitute all-adult PDF totals or infer each individual’s stage-to-stage change. | GB adults who had had a relationship that ended 2026-07-09 to 2026-07-10 | Original source [S03] |
| F31 | Getting over a breakup was difficult for 78% of those ever dumped, compared with 58% of those never dumped. Self-reported lifetime experience; not causal evidence that being dumped produces a fixed additional recovery time. | GB adults with an ended relationship, by whether ever dumped 2026-07-09 to 2026-07-10 | Original source [S03] |
| F32 | Of Britons who had had a relationship end, 28% were still friends with at least one ex. At least one ex, not every ex or every breakup. No finding here establishes whether friendship improves adjustment. | GB adults; most experience/difficulty findings are conditional on having had a relationship that ended 2026-07-09 to 2026-07-10 | Original source [S03] |
| F33 | Among all GB adults, 36% were comfortable with a partner being friends with an ex and 50% uncomfortable; comfort was 41% among men and 31% among women. 36% is the sum of very/fairly comfortable (8% + 28%). Opinions, not observations of relationship outcomes. | All GB adults, not only those with an ended relationship 2026-07-09 to 2026-07-10 | Original source [S03] |
| F34 | For a relationship under one year, 27% approved immediate dating if dumped and 22% if initiating; for a relationship over five years, 19% and 14% approved. Social judgments about scenarios, not evidence-based recovery deadlines or advice about when anyone should date. | GB adults answering four hypothetical dating-again scenarios 2026-07-09 to 2026-07-10 | Original source [S03] |
The gap between recognizing and doing
The share finding the act of breaking up difficult was 31 percentage points higher than the share finding recognition difficult (77% − 46%). Recovery difficulty was 24 points above recognition and 7 points below the act of breaking up. Because these are aggregate responses to different questions, this does not mean 31% of individuals personally moved from easy recognition to difficult action. [C06–C08] YouGov [S03]
How often do people stay in contact or reunite?
Contact, a wish to reconcile and an observed reunion are different outcomes. One Canadian study describes contact and hopes; Australian panel research measures separated couples sharing a household again.
| ID | Finding and interpretation | Population and actual data period | Source |
|---|---|---|---|
| F36 | The breakup was unexpected for 63.1% of young adults providing the relevant context response. Canadian convenience cohort of young adults; 118/187. Not all breakup recipients or the national population. | French-understanding, internet-using, romantically partnered adults aged 18–25 Recruited 2020-03 to 2020-09; up to 12-month relationship follow-up and six-month post-breakup follow-up | Original source [S08] |
| F37 | Ongoing contact with the ex was reported by 68.4%; 33.2% hoped to re-establish the relationship. Separate questions, not a joint cross-tabulation. Contact and hope do not demonstrate actual reconciliation. | French-understanding, internet-using, romantically partnered adults aged 18–25 Recruited 2020-03 to 2020-09; up to 12-month relationship follow-up and six-month post-breakup follow-up | Original source [S08] |
| F38 | A previous breakup with the same partner was reported by 29.9% of context respondents. Past cycling among this selected breakup sample, not the chance that a given couple will reunite. | French-understanding, internet-using, romantically partnered adults aged 18–25 Recruited 2020-03 to 2020-09; up to 12-month relationship follow-up and six-month post-breakup follow-up | Original source [S08] |
| F39 | Being in a new relationship was reported by 24.3% at one month after breakup and 40.1% at three months. Wave-specific response shares, not cumulative entry rates. Do not assume every relationship is with a different partner or that follow-up bases are identical. | French-understanding, internet-using, romantically partnered adults aged 18–25 Recruited 2020-03 to 2020-09; up to 12-month relationship follow-up and six-month post-breakup follow-up | Original source [S08] |
| F40 | By five years after separation, estimated household reunion was about 7% for previously married couples and 9% for previously cohabiting couples. Competing-risk cumulative incidence among separated co-resident couples, 2001–2023 HILDA. Reunion means living together again; not every form of getting back together. | Co-resident couples observed at least twice; separated couples followed for household reunion 2001–2023, HILDA waves 1–23 | Original source [S09] |
| F41 | In adjusted models, cohabitation versus marriage had a separation hazard ratio of 1.80 and a reunion hazard ratio of 1.15; the reunion contrast was not statistically significant. Different outcomes and risk sets. Ratios are not percentage-point differences or probabilities; no significant adjusted reunion difference was established. | Co-resident couples observed at least twice; separated couples followed for household reunion 2001–2023, HILDA waves 1–23 | Original source [S09] |
| F42 | Previous separation and reunion was associated with a reunion hazard ratio of 2.57 among married couples and 0.41 among cohabiting couples in separate models. Model-specific associations, not chances of success. Do not divide hazard ratios from different models to create a relative probability. | Co-resident couples observed at least twice; separated couples followed for household reunion 2001–2023, HILDA waves 1–23 | Original source [S09] |
Do not turn contact into a success rate. The 68.4% contact figure and the approximately 7–9% household-reunion estimates come from different studies, countries, populations and outcomes. They cannot be subtracted or used to estimate how many ex-partners want someone back. In the Australian adjusted model, the cohabitation-versus-marriage reunion contrast was not statistically significant. Kristin Gehl, Audrey Brassard and colleagues [S08]; Edith Gray, Ann Evans and Anna Reimondos; Australian National University [S09]
What did teen research find about digital breakups?
Pew’s 2014–2015 teen research found both support and persistent exposure to ex-partners on social media. The findings describe that historical age group and technology context.
| ID | Finding and interpretation | Population and actual data period | Source |
|---|---|---|---|
| F43 | Among relationship-experienced teens, 62% had initiated an in-person breakup and 47% had received one in person. Historical teen experience, not present-day adult or Gen Z prevalence. Initiating and receiving are separate lifetime experiences. | Teens aged 13–17 with romantic relationship experience; social-media items additionally require social-media use 2014-09-25 to 2014-10-09; 2015-02-10 to 2015-03-16 | Original source [S02] |
| F44 | A text-message breakup had been initiated by 27% of relationship-experienced teens and received by 31%. Historical teen experience, not present-day adult or Gen Z prevalence. Initiating and receiving are separate lifetime experiences. | Teens aged 13–17 with romantic relationship experience; social-media items additionally require social-media use 2014-09-25 to 2014-10-09; 2015-02-10 to 2015-03-16 | Original source [S02] |
| F45 | After a breakup, 48% had removed an ex from phone contacts, 38% deleted or untagged photos, 37% blocked/unfriended on social media and 30% blocked texts. Historical relationship-experienced teen sample; actions can overlap. Not percentages of every breakup or a prescription for recovery. | Teens aged 13–17 with romantic relationship experience; social-media items additionally require social-media use 2014-09-25 to 2014-10-09; 2015-02-10 to 2015-03-16 | Original source [S02] |
| F46 | Girls more often reported deleting/untagging photos than boys (46% versus 30%) and blocking/unfriending an ex on social media (44% versus 31%). Historical teen experience, not present-day adult or Gen Z prevalence. Initiating and receiving are separate lifetime experiences. | Teens aged 13–17 with romantic relationship experience; social-media items additionally require social-media use 2014-09-25 to 2014-10-09; 2015-02-10 to 2015-03-16 | Original source [S02] |
| F47 | Among social-media users with relationship experience, 63% said social media allowed them to feel supported through a breakup. Historical teen experience, not present-day adult or Gen Z prevalence. Initiating and receiving are separate lifetime experiences. | US teen social-media users aged 13–17 with relationship experience 2014-09-25 to 2014-10-09; 2015-02-10 to 2015-03-16 | Original source [S02] |
| F48 | In that same historical teen group, 47% said social media made it feel as though they could not get away from an ex. Historical teen experience, not present-day adult or Gen Z prevalence. Initiating and receiving are separate lifetime experiences. | US teen social-media users aged 13–17 with relationship experience 2014-09-25 to 2014-10-09; 2015-02-10 to 2015-03-16 | Original source [S02] |
How long does it take to get over a breakup?
Research does not establish one recovery deadline. Depressive-symptom scores, posting language and overall life satisfaction have different definitions, samples and observation periods.
| ID | Finding and interpretation | Population and actual data period | Source |
|---|---|---|---|
| F49 | In a young-adult cohort with 156 single-breakup participants, average depressive-symptom scores returned to pre-breakup levels within three months. PHQ-2 symptom scores; group average, not diagnosis or recovery for every individual. Full calendar field dates and country are not confirmed in public abstract. | Young adults who experienced one breakup during the study Two-year study; calendar field dates not confirmed in public abstract | Original source [S11] |
| F50 | Among self-selected Reddit breakup posters, language changes appeared about three months before the disclosed breakup and returned to baseline around six months afterward. Posting-language patterns, not a clinical mental-health assessment. Approximately 6,800 users; no representative country denominator. | Self-selected Reddit users who posted about a breakup Retrospective Reddit posting windows around disclosed breakups; archive dates not established here | Original source [S12] |
| F51 | Among Australian women born 1946–1951, mean life satisfaction returned to pre-dissolution levels after about three to four years and overtook matched controls after about 13.5 years. Group mean modeled trajectories after marriage/de facto dissolution, not every woman’s experience or a dating-breakup deadline. | Women born 1946–1951; divorced/separated group and women who remained partnered 1996–2019; nine ALSWH waves | Original source [S10] |
| F52 | Across four panels, the transition to a steeper average decline in relationship satisfaction was estimated 0.58–2.30 years before separation. Retrospective pattern in relationships that ended. This does not identify a point at which any current relationship is inevitably doomed. | Adults in relationships that later ended, with comparison groups Four longitudinal panels spanning 12–21 years; precise wave calendars not transcribed here | Original source [S15] |
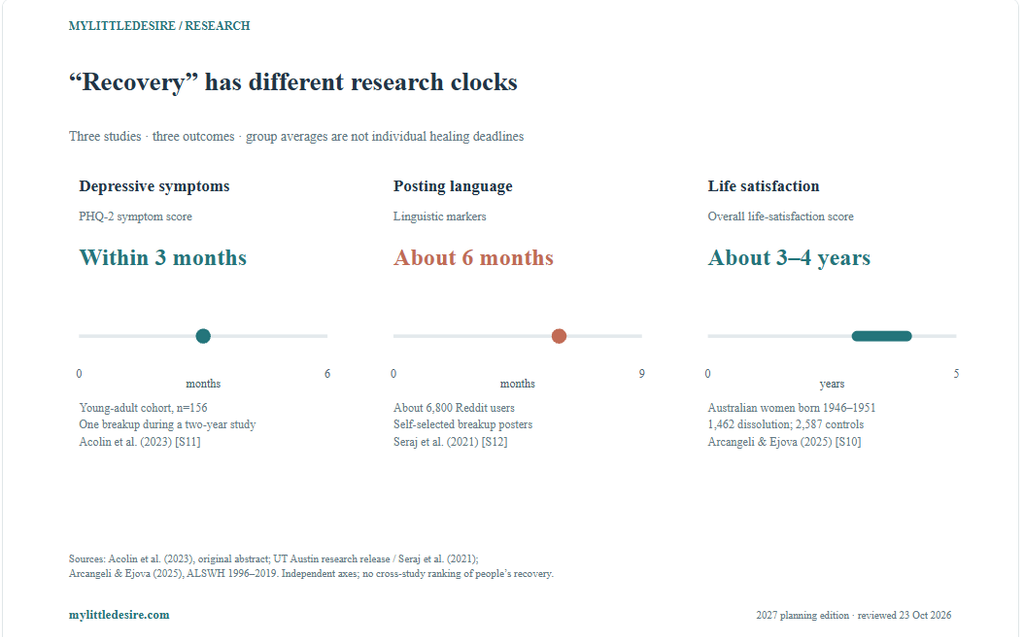
What this comparison contributes: it places often-confused outcomes side by side while preserving their separate units and samples. A return in average symptoms, a return in language patterns and a return in life satisfaction are different findings. We calculate no pooled recovery average and infer no personal deadline.
The satisfaction-decline study is also retrospective: it models relationships that eventually ended. A current dip in satisfaction does not establish that a particular relationship will inevitably end within the reported interval. Janina L. Bühler and Ulrich Orth [S15]
How do young adults describe the effects of past breakups?
Young adults can report both pain and perceived growth after a breakup. The 2026 IFS/Wheatley report describes these attitudes from early-2025 survey data; its sampling limits matter.
| ID | Finding and interpretation | Population and actual data period | Source |
|---|---|---|---|
| F53 | In the report’s young-adult survey, 55% said breakups made them more reluctant to start relationships, 45% had passed up opportunities, and 36% ended relationships too quickly to avoid pain. US unmarried adults aged 22–35; report focuses on those not ruling out marriage. Breakup table n=4,046, including engaged respondents. Self-reported attitudes; recruitment/weighting transparency limited. | Unmarried adults aged 22–35; report focuses on those not ruling out future marriage Early 2025; exact survey dates not disclosed in the report | Original source [S14] |
| F54 | Some 63% agreed their breakups were necessary experiences for their growth and development. Self-described lessons, not proof that a breakup caused measurable growth. These statements can coexist with negative feelings. | Unmarried adults aged 22–35; report focuses on those not ruling out future marriage Early 2025; exact survey dates not disclosed in the report | Original source [S14] |
| F55 | The report found 48% felt personally injured by past breakups and 50% reported negative feelings about relationships. Table values; breakup-item n=4,046. Attitudes, not psychiatric diagnoses. | Unmarried adults aged 22–35; report focuses on those not ruling out future marriage Early 2025; exact survey dates not disclosed in the report | Original source [S14] |
The breakup table reports 4,046 respondents, including engaged respondents, rather than the report’s full 5,275-person survey or main 4,539-person group. One additional benefit item conflicts between the narrative and table, so it is omitted here pending clarification. These self-reports do not establish that a breakup caused clinical harm or personal growth. Institute for Family Studies / Wheatley Institute; Hawkins, Willoughby, Carroll and Wilcox [S14]
Which popular breakup claims need qualification?
- “Everyone recovers in eleven weeks.” The studies here use different outcomes and populations; none establishes a universal recovery deadline.
- “Most couples break up at two years.” A time-to-separation model is not a distribution of how long all relationships last. Canadian first-union histories do not establish this rule either. Statistics Canada; Clémence Zossou and Solène Lardoux [S07]; Janina L. Bühler and Ulrich Orth [S15]
- “A person who stays in touch will reconcile.” Contact, hope and household reunion are distinct measures. Kristin Gehl, Audrey Brassard and colleagues [S08]; Edith Gray, Ann Evans and Anna Reimondos; Australian National University [S09]
- “An annual divorce count measures all breakups.” Dating and cohabiting relationships may end without a registered divorce, so legal divorce data answer a narrower question.
How was the research selected and verified?
MyLittleDesire checked original research pages, source tables, original reports and author manuscripts. The database records each finding’s value, population, geography, collection period, publication date, sample-size availability, method, source locator and caveats. Related response categories are grouped rather than counted as separate studies.
The package contains 55 grouped findings, 128 numeric inputs and 20 reproducible calculations. Its 15 source records are not 15 wholly independent datasets: HILDA underlies multiple analyses, and the two Pew reports are separate surveys from one organization. The largest single source contributes eight grouped findings. MyLittleDesire conducted no new respondent fieldwork.
- Geographic scope: the US, Britain/Great Britain, Canada and Australia appear where supported. Britain is not automatically the whole UK. English-language Reddit posts are not assigned to a country without evidence.
- Dates: 2027 is an edition label. Publication year and observation year are kept separate. Historical teen and adult attitude data are not labelled as today’s behavior.
- Coverage: probability surveys, commercial online panels, selected program samples and community cohorts are clearly distinguished. No pooled international breakup rate is calculated.
- Source access: the Acolin timing finding was verified in the original publisher abstract; unavailable full-method fields remain marked unavailable. The Reddit finding was checked against the original university research release and paper abstract, rather than an independently accessed full paper.
- Uncertainty: reported confidence intervals and nonsignificant results retain their meaning. Additional arithmetic uses rounded published values; no new statistical significance tests or causal estimates are claimed.
- Clinical interpretation: symptom scores, language markers and life satisfaction are distinct outcomes. No individual recovery deadline or diagnosis follows from their averages.
- Integrity: an inconsistent IFS/Wheatley narrative/table item, unspecified commercial-survey subset claims and unsupported universal breakup rates are excluded. Death-related union endings are not recast as breakups.
Our contribution is verification, organization, transparent arithmetic and reusable chart design. These are original editorial comparisons of published evidence, not new scientific discoveries. Review date: October 23, 2026. Recheck sources before later publication or material reuse.
What are the original research sources?
- [S01] Pew Research Center. Public attitudes about today’s dating landscape. Published: 2020-08-20. Data: 2019-10-16 to 2019-10-28. Acceptability and hypothetical intentions are not observed breakup behavior. Full-sample margin of error does not apply to every subgroup. Supporting methods, tables or research record.
- [S02] Pew Research Center. After the relationship: Technology and breakups. Published: 2015-10-01. Data: 2014-09-25 to 2014-10-09; 2015-02-10 to 2015-03-16. Historical teen experience, not present-day adult or Gen Z prevalence. Initiating and receiving are separate lifetime experiences. Supporting methods, tables or research record.
- [S03] YouGov. Section 5: relationship break ups. Published: 2026-08-17. Data: 2026-07-09 to 2026-07-10. Ever-initiated, ever-dumped and mutual experiences overlap. Article’s filtered bases differ from some all-adult PDF totals. Great Britain is not the whole UK. Supporting methods, tables or research record.
- [S04] Gravningen and colleagues; Natsal-3 research team. Reported reasons for breakdown of marriage and cohabitation in Britain: Findings from the third National Survey of Sexual Attitudes and Lifestyles (Natsal-3). Published: 2017-03-23. Data: 2010-09 to 2012-08; most recent live-in union ended in preceding five years. Historical, self-reported reasons for the most recent ended live-in union. Sex-specific percentages are respondent reports, not perpetrator rates. Widowed cases are excluded from reasons analysis. Supporting methods, tables or research record.
- [S05] US Administration for Children and Families / OPRE; Mathematica. Relationship Dynamics Among Unmarried Couples: Findings from a Study of Healthy Marriage and Relationship Education Programs. Published: 2022-12. Data: 12-month follow-up at two sites; 30-month follow-up at one site; precise field dates not established here. Selected program population, not a national probability sample of breakups. Includes 32 people from couples where both partners responded. Descriptive results do not establish program effects.
- [S06] Michael J. Rosenfeld; Stanford University. Who Wants the Breakup? Gender and Breakup in Heterosexual Couples. Published: 2018 book chapter; author manuscript ©2017, updated correction. Data: 2009–2015. Who-wanted score codes male=0, mutual=0.5 and female=1. Relationship types differ in duration, age and selection. Historical associations are not causal effects or current predictions.
- [S07] Statistics Canada; Clémence Zossou and Solène Lardoux. The duration of first unions: A comparative analysis between landed immigrants and Canadian-born individuals. Published: 2024-03-11. Data: 2017 General Social Survey, retrospective first-union histories. Widowed people excluded; dissolution means separation/divorce. Observed status percentages have unequal exposure periods. Calculations from rounded survival values have no newly estimated uncertainty intervals.
- [S08] Kristin Gehl, Audrey Brassard and colleagues. Attachment and Breakup Distress: The Mediating Role of Coping Strategies. Published: 2023-10-18 online; 2024-02 issue. Data: Recruited 2020-03 to 2020-09; up to 12-month relationship follow-up and six-month post-breakup follow-up. Not nationally representative. Context percentages use 187 valid responses, not all 196. Wave-specific denominators for new-relationship percentages are not stated in the cited paragraph. Supporting methods, tables or research record.
- [S09] Edith Gray, Ann Evans and Anna Reimondos; Australian National University. Trying Again: Reuniting After Cohabitation or Marriage Separation. Published: 2026-07-16. Data: 2001–2023, HILDA waves 1–23. Reunion means sharing a household again, excluding living-apart-together reconciliation. Repartnering/death are competing events; variable follow-up. Hazard ratios are not probabilities. Methods n=3,382 retained despite inconsistent continuation-table header. Supporting methods, tables or research record.
- [S10] Olivia Jean Arcangeli and Anastasia Ejova; University of South Australia / University of Adelaide. Does Time Heal All Wounds? Life Satisfaction Trajectories in Australian Middle-Aged Women Before and After Relationship Dissolution. Published: 2025-02-26. Data: 1996–2019; nine ALSWH waves. Group mean life satisfaction, not clinical recovery or a deadline for every person. Controls and event groups may retain unmeasured differences. Supporting methods, tables or research record.
- [S11] Jessica Acolin, Jennifer M. Cadigan, Charles B. Fleming, Isaac C. Rhew and Christine M. Lee. Trajectory of depressive symptoms in the context of romantic relationship breakup: Characterizing the “natural course” of response and recovery in young adults. Published: 2023-07-04 online; 2023-10 issue. Data: Two-year study; calendar field dates not confirmed in public abstract. Public abstract verified; full methods not independently accessed. Symptom averages are not diagnoses or a universal individual recovery time. Supporting methods, tables or research record.
- [S12] Sarah Seraj, Kate G. Blackburn and James W. Pennebaker; University of Texas at Austin. Language left behind on social media exposes the emotional and cognitive costs of a romantic breakup. Published: 2021-02-01. Data: Retrospective Reddit posting windows around disclosed breakups; archive dates not established here. Language markers do not measure clinical recovery. English-language Reddit users are not a representative country sample. Exact counts are not substituted for rounded verified release counts. Supporting methods, tables or research record.
- [S13] Real Insurance; research conducted by MYMAVINS. The Real Relationships Report 2025. Published: 2025-11. Data: 2025-08-13 to 2025-08-18; experiences in preceding five years. Commercially commissioned self-report. Probability recruitment is not established. Breakup and divorce percentages are not added without a verified disjoint-category definition.
- [S14] Institute for Family Studies / Wheatley Institute; Hawkins, Willoughby, Carroll and Wilcox. State of Our Unions 2026: The Dating Recession. Published: 2026-02. Data: Early 2025; exact survey dates not disclosed in the report. Report’s representativeness claim is not treated as verified probability sampling; recruitment/weighting transparency limited. Breakup table base differs from the report’s main group. Attitudes are not causal or clinical outcomes. One narrative/table discrepancy is excluded. Supporting methods, tables or research record.
- [S15] Janina L. Bühler and Ulrich Orth. Terminal Decline of Satisfaction in Romantic Relationships: Evidence From Four Longitudinal Studies. Published: 2025-03-20 online. Data: Four longitudinal panels spanning 12–21 years; precise wave calendars not transcribed here. Retrospective mean patterns in relationships that ended are not a prospective individual breakup diagnostic. HILDA overlaps the underlying program in S09. Supporting methods, tables or research record.
How should this resource be cited?
MyLittleDesire. Breakup Statistics 2027: Research, Reasons & Recovery. 2027 planning edition; source review October 23, 2026. https://mylittledesire.com/breakup-statistics/.
For a source-reported finding, consult and cite the underlying research as appropriate. For a MyLittleDesire calculation, include its calculation ID and original data source. Suggested chart credit: A link to this article helps readers inspect definitions, calculations and limitations.