
Wedding cost statistics become more useful when they explain what the money represents. A completed wedding bill, an engaged couple’s plan and a guest’s expected expenses answer different questions. A mean and a median can also describe the same group very differently.
This resource contains 60 grouped findings from nine named survey programs, documented in 12 original-source records, plus four charts and 24 reproducible descriptive calculations. Multiple response categories stay grouped. The Knot and Hitched share a publisher; multiple documents are not independent studies. MyLittleDesire contributes source checking, organization and qualified comparisons, rather than original survey fieldwork.
What are the key wedding cost and budget findings?
US$24,000
US$10,000
The median in The Knot’s 2026 report on 2025 weddings; its rounded mean was US$34,000. The Knot / The Knot Worldwide [S01].
Difference between that report’s mean and median (C01); not an individual spending overrun. The Knot / The Knot Worldwide [S01].
US$17,100 / US$43,300
41%
Mean costs for weddings with 1–50 guests / more than 100 guests in the companion guide. The Knot / The Knot Worldwide [S02].
Over budget in The Knot’s overall budget-outcome question; 21% had no budget. The Knot / The Knot Worldwide [S01].
US$36,000
£21,990
Zola’s planning-stage 2026 benchmark; not completed 2026 national spending. Zola [S03].
Hitched’s mean for 2025 UK weddings, published in January 2026. Hitched / The Knot Worldwide [S04].
0.6% vs 7.7%
£20,604
Scotland’s relative premium in total cost versus cost per guest within the same Hitched report (C08, C10). Hitched / The Knot Worldwide [S04].
Bridebook’s separate headline mean; its public report labels the wedding overview as 2025 results. Bridebook [S05].
A$8,781
C$15,000 → C$25,000
Difference between Easy Weddings’ published starting and final averages (C14), with paired bases unavailable. Easy Weddings [S07].
Median original budget versus median final bill in Wealthsimple’s client newlywed subset. Wealthsimple [S09].
C$1,530
64%
BMO/Ipsos respondents’ expected wedding-guest cost, rather than measured final expenditure. BMO / Ipsos [S10].
Gen Z Canadian summer-wedding invitees who had declined or were being more selective in TD’s April 2026 survey. TD / Leger [S11].
What does an average wedding cost mean?
A mean is the arithmetic average; a median is the midpoint. Expensive weddings can pull the mean above the median. Neither is a target budget, a quote or a promise that a particular celebration can be delivered at that price.
Also check the basket. Some figures cover the ceremony and reception, others include a honeymoon, and some public releases do not fully define their inclusions. Cost per guest is an allocated spending measure; it is not necessarily what a caterer charges or the marginal saving from removing one guest. Percentages describing couples who receive family help are different from family members’ share of all wedding dollars.
Which country benchmark fits the question?
Use a dated, source-specific figure in its original currency. The following benchmarks are not harmonized enough to rank countries or calculate an international average.
| Market and question | Published benchmark | What it describes | Original source |
|---|---|---|---|
| US completed wedding spending | US$34,000 mean; US$24,000 median | 2025 weddings; report’s ceremony/reception measure; main member survey n=10,474 | The Knot / The Knot Worldwide [S01] |
| US engaged-couple plans | US$36,000 | 2026 planning-stage survey; 11,500+ respondents; full basket/field dates not supplied | Zola [S03] |
| UK completed-wedding survey | £21,990 mean | 2025 newlyweds; n=2,020; basket not fully defined in cited press release | Hitched / The Knot Worldwide [S04] |
| UK separate platform report | £20,604 mean | Public 2026 report’s 2025-wedding overview; 7,000+ mixed married/engaged sample, cost base undisclosed; guide excludes ring/honeymoon | Bridebook [S05]; Bridebook [S06] |
| Australia platform survey | A$38,252 final average; A$29,471 original average | 2026 report; 4,000+ engaged/recently married respondents; paired item bases unknown | Easy Weddings [S07] |
| Canada client newlyweds | C$25,000 median final bill; approximately C$37,000 mean | July 2026 survey of 1,236 clients overall; newlywed subset not disclosed | Wealthsimple [S09] |
| Canada public cost expectations | C$19,000 expected mean | Ipsos/BMO fieldwork December 2025–January 2026; expectations, not final wedding bills | BMO / Ipsos [S10] |
What did US couples actually report spending?
The Knot’s report gives a US$24,000 median and rounded US$34,000 mean for 2025 weddings. The difference is useful for a story about how a national headline average can sit above the middle of a spending distribution. The Knot / The Knot Worldwide [S01].
| ID | Finding and essential qualification | Population, period and sample | Source and locator |
|---|---|---|---|
| F01 | The report gives a US$34,000 mean and US$24,000 median for 2025 weddings. Ceremony/reception benchmark; PDF mean is rounded. Companion guide says US$34,200. A mean is not a recommended or typical personal budget. | US adult The Knot/WeddingWire members; some planning items may use ad hoc samples Weddings January–December 2025; report also includes ad hoc planning studies 10,474 married couples in main study; item-level and ad hoc bases not fully disclosed | Original research [S01] PDF physical p.15 / printed p.13, Distribution of Wedding Costs |
| F02 | Approximately 25% spent US$12,000 or less; the middle 50% spent US$12,000–US$41,000; 25% spent over US$41,000. Approximate reported quartiles, not exact thresholds estimated from public microdata. | US adult The Knot/WeddingWire members; some planning items may use ad hoc samples Weddings January–December 2025; report also includes ad hoc planning studies 10,474 married couples in main study; item-level and ad hoc bases not fully disclosed | Original research [S01] PDF physical p.15 / printed p.13, cost distribution bullets |
| F03 | The report gives 117 guests on average and US$292 per guest for 2025 weddings. Do not infer an average household’s guest count by dividing rounded aggregate costs. Cost per guest is not the marginal price of adding one person. | US adult The Knot/WeddingWire members; some planning items may use ad hoc samples Weddings January–December 2025; report also includes ad hoc planning studies 10,474 married couples in main study; item-level and ad hoc bases not fully disclosed | Original research [S01] PDF physical p.5 / printed p.3, Weddings over the years, 2025 column |
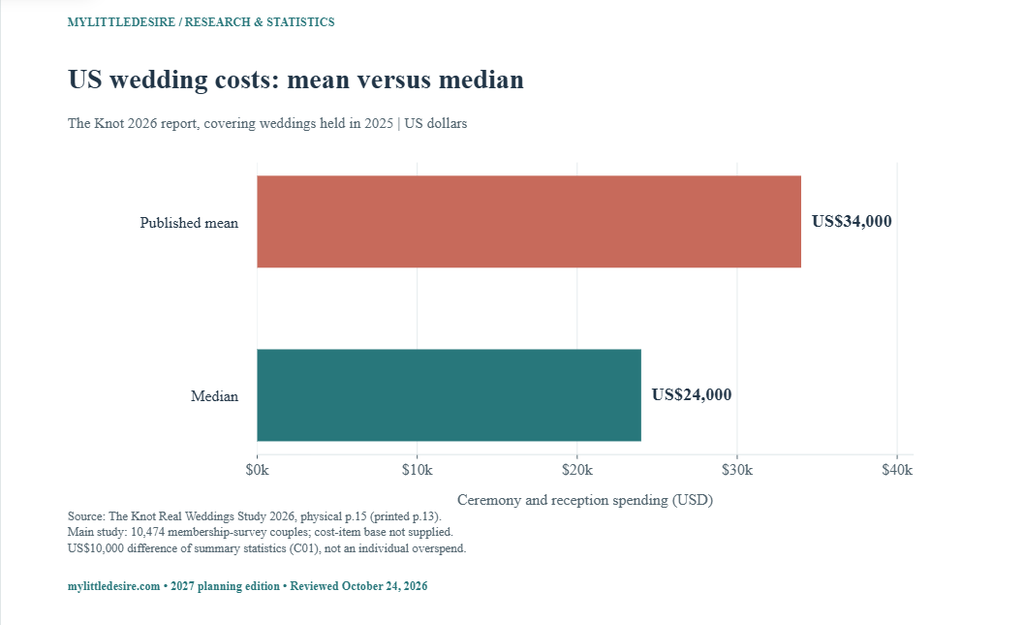
MyLittleDesire calculation: the rounded mean exceeds the median by US$10,000, or approximately 41.7% of the median (C01–C02). Reversing the comparison gives a median approximately 29.4% below the mean (C03). Those percentages differ because their denominators differ. The companion cost guide reports US$34,200; this chart consistently uses the PDF’s US$34,000 rather than mixing its precision with the median.
How do guest count and timing relate to wedding cost?
Larger guest groups had higher total means in The Knot’s companion analysis. The difference between the 1–50 and more-than-100 guest groups was US$26,200 (C05). This is an association across different weddings, rather than a guaranteed saving from reducing an individual guest list. The Knot / The Knot Worldwide [S02].
| ID | Finding and essential qualification | Population, period and sample | Source and locator |
|---|---|---|---|
| F04 | Mean ceremony/reception cost was US$17,100 for 1–50 guests, US$27,200 for 51–100 and US$43,300 for more than 100. Observational group means; cell sizes and adjusted effects unavailable. They do not predict causal savings from removing guests. | US adult couples married in 2025 recruited from The Knot/WeddingWire 2025 weddings, reported in 2026 10,474 main-study couples; guest-band, season and budget-band cell sizes not published | Original research [S02] Guest Count, three guest-band questions |
| ID | Finding and essential qualification | Population, period and sample | Source and locator |
|---|---|---|---|
| F09 | Quarterly means were US$33,200 in January–March, US$34,300 in April–June, US$35,400 in July–September and US$33,200 in October–December. 2025-wedding group means published in 2026, without adjustment for region, guest count or selection. | US adult couples married in 2025 recruited from The Knot/WeddingWire 2025 weddings, reported in 2026 10,474 main-study couples; guest-band, season and budget-band cell sizes not published | Original research [S02] Time of Year, quarterly cost table |
| F10 | For couples in the publisher’s budget bands, mean spending was US$8,900 for US$0–US$15,000, US$26,400 for US$15,001–US$40,000 and US$70,300 above US$40,000. Means conditional on each publisher-described budget band; underlying question routing is not supplied. These are not the shares of weddings in the bands or a pricing menu. | US adult couples married in 2025 recruited from The Knot/WeddingWire 2025 weddings, reported in 2026 10,474 main-study couples; guest-band, season and budget-band cell sizes not published | Original research [S02] What’s the Average Cost of a Wedding?, budget-band paragraph |
The quarterly means and budget bands show additional variation within the same program. Region, venue, package scope and the choices of people in each group can all differ. Multiplying US$292 by the number of people removed would incorrectly treat all wedding spending as variable per-guest expenditure.
Who pays for US weddings, and how often do budgets overrun?
The Knot’s budget chart reports 41% over budget, including 21% of respondents who did not have a budget. That base matters when comparing the result with another survey. Its separate funding chart reports shares of dollars, rather than percentages of couples. The Knot / The Knot Worldwide [S01].
| ID | Finding and essential qualification | Population, period and sample | Source and locator |
|---|---|---|---|
| F05 | Budget outcomes were 41% over, 34% on track, 4% under and 21% without a budget. Percentages use the report’s overall question base, including people without budgets; item count not disclosed. Do not relabel 41% as the rate among only budget-setters. | US adult The Knot/WeddingWire members; some planning items may use ad hoc samples Weddings January–December 2025; report also includes ad hoc planning studies 10,474 married couples in main study; item-level and ad hoc bases not fully disclosed | Original research [S01] PDF physical p.11 / printed p.9, The Budget Reality Check |
| F06 | Parents/family covered 52% of total wedding costs and the couple covered 48% in the report’s funding breakdown. These are shares of cost, not the percentages of couples receiving help or fully self-funding. | US adult The Knot/WeddingWire members; some planning items may use ad hoc samples Weddings January–December 2025; report also includes ad hoc planning studies 10,474 married couples in main study; item-level and ad hoc bases not fully disclosed | Original research [S01] PDF physical p.11 / printed p.9, Who’s Paying |
| F07 | More than 85% said the economy affected planning; 31% sought additional financial support. “More than 85%” is a bound, not an exact 85.0% estimate. Additional support may include family, cards or loans. Ad hoc item bases may differ. | US adult The Knot/WeddingWire members; some planning items may use ad hoc samples Weddings January–December 2025; report also includes ad hoc planning studies 10,474 married couples in main study; item-level and ad hoc bases not fully disclosed | Original research [S01] PDF physical p.11 / printed p.9, economic concerns and Managing the Budget |
| F08 | Among the roughly one-quarter adjusting budgets because of the economy, 77% were increasing and 16% decreasing them. Conditional on budget adjustment; not 77% of all US couples. Unreported responses are not inferred. | Couples adjusting wedding budgets due to the economy; roughly one-quarter of source respondents Weddings January–December 2025; report also includes ad hoc planning studies 10,474 married couples in main study; item-level and ad hoc bases not fully disclosed | Original research [S01] PDF physical p.11 / printed p.9, Managing the Budget, second bullet |
Removing the reported no-budget responses gives an approximate 51.9% over-budget share among the remaining reported categories: 41 ÷ (100 − 21) × 100 (C06). This rebases rounded published percentages; it is not an independently observed exact rate. The 77% increasing budgets is already conditional on those adjusting budgets because of the economy.
What were engaged couples planning for 2026 weddings?
Zola’s US-facing First Look report describes intentions and work already underway among engaged couples. Its US$36,000 headline should not be presented as audited spending for completed 2026 weddings or used to calculate growth against The Knot’s different 2025 sample. Zola [S03].
| ID | Finding and essential qualification | Population, period and sample | Source and locator |
|---|---|---|---|
| F11 | Zola’s engaged-couple report gives a US$36,000 average wedding cost and 145 guests for 2026 plans. Survey of couples preparing for 2026 weddings, not completed 2026 national expenditure; full basket and field dates unavailable. | Engaged couples in Zola’s planning survey Couples preparing for 2026 weddings; exact field dates not published on article More than 11,500 couples; conditional/generation cell sizes not published | Original research [S03] The average cost of a wedding remains $36,000 |
| F12 | 88% were contributing financially: 29% fully and 59% partially. Shares of couples, not shares of all dollars. Financial help and a couple’s own contribution can coexist. | Engaged couples in Zola’s planning survey Couples preparing for 2026 weddings; exact field dates not published on article More than 11,500 couples; conditional/generation cell sizes not published | Original research [S03] Average-cost section, Funding these celebrations paragraph |
| F13 | Funding strategies included saving before engagement (51%), credit-card strategies (32%), cash registry funds (27%), extra jobs (17%) and a loan (4%). Multiple strategies can overlap. Card strategies include points and new cards; 32% is not a debt-prevalence estimate. | Engaged couples in Zola’s planning survey Couples preparing for 2026 weddings; exact field dates not published on article More than 11,500 couples; conditional/generation cell sizes not published | Original research [S03] Average-cost section, funding strategy bullets |
| F14 | 52% were postponing other milestones; among that group, 70% cited general savings, 59% a home, 38% debt repayment and 29% starting a family. The detailed goals use a conditional group and can overlap; do not apply them to all engaged couples. | Engaged couples in Zola’s planning survey Couples preparing for 2026 weddings; exact field dates not published on article More than 11,500 couples; conditional/generation cell sizes not published | Original research [S03] Average-cost section, financial stretch and major life goals |
| F15 | 71% received financial help; among those receiving support, 69% said both families contributed. The 69% is conditional; it is not the share of all couples or all wedding spending. | Engaged couples in Zola’s planning survey Couples preparing for 2026 weddings; exact field dates not published on article More than 11,500 couples; conditional/generation cell sizes not published | Original research [S03] Average-cost section, family support paragraph |
| F16 | 37% of Millennials planned over US$40,000; 43% of Gen Z planned under US$20,000. Full funding by loved ones was reported by 15% of Gen Z and 9% of Millennials. The spending thresholds differ and cannot be subtracted as like-for-like budget rates. Generation cell sizes not published. | Engaged couples in Zola’s planning survey Couples preparing for 2026 weddings; exact field dates not published on article More than 11,500 couples; conditional/generation cell sizes not published | Original research [S03] Average-cost section, generational bullets |
The funding figures also explain why “the couple paid” and “the family helped” are compatible statements. A couple can contribute part of the bill while receiving support. Credit-card strategies can include points or payment convenience, so their use is not equivalent to carrying wedding debt.
What does social media have to do with wedding budgets?
Zola respondents described both inspiration and financial pressure. The report combines increasing a total budget with moving money within an existing budget in its 48% measure. Those actions should not both be called overspending. Zola [S03].
| ID | Finding and essential qualification | Population, period and sample | Source and locator |
|---|---|---|---|
| F17 | 60% identified balancing budget against online inspiration as their top planning stressor; 48% increased budgets or shifted funds to achieve something seen online. Self-reported influence, not a causal estimate. Increasing a total and reallocating within it are combined in the 48% measure. | Engaged couples in Zola’s planning survey Couples preparing for 2026 weddings; exact field dates not published on article More than 11,500 couples; conditional/generation cell sizes not published | Original research [S03] The budget v. inspiration gap; Couples are increasing budgets |
| F18 | Social-media-worthy wedding pressure was 54% for Gen Z and 45% for Millennials; planning stress attributed to social media was 41% and 28%, respectively. Different questions within each generation; no significance test, causal claim or universal Gen Z estimate. | Engaged couples in Zola’s planning survey Couples preparing for 2026 weddings; exact field dates not published on article More than 11,500 couples; conditional/generation cell sizes not published | Original research [S03] Couples are increasing budgets; social-media emotional tradeoff paragraphs |
Self-reported influence can help explain people’s experiences, but it cannot isolate what social media caused them to spend. Age, income, wedding stage and other differences were not controlled in the public comparisons used here.
What does Hitched’s UK wedding study show?
Hitched’s January 2026 release reports a £21,990 mean for weddings held in 2025. It also provides budget outcomes, family-support measures and regional figures from the same survey program. Hitched / The Knot Worldwide [S04].
| ID | Finding and essential qualification | Population, period and sample | Source and locator |
|---|---|---|---|
| F19 | Hitched reported a £21,990 mean for 2025 weddings and £272 per guest, compared with £261 per guest in 2024. Published January 2026 about 2025 weddings; cost basket not fully defined in this release. | UK newlyweds in Hitched Wedding Industry Report 2025 weddings; exact field dates not published 2,020 newlyweds; subgroup counts not published | Original research [S04] Wedding Budgets and the Economy |
| F20 | Weddings with at least 101 guests averaged £35,591. The release’s “nearly 40% more” wording is not used. Relative to its £21,990 national mean, the published amounts imply approximately 61.8% more; groups are unadjusted. | UK newlyweds in Hitched Wedding Industry Report 2025 weddings; exact field dates not published 2,020 newlyweds; subgroup counts not published | Original research [S04] Wedding Budgets and the Economy, guest-count paragraph |
| F21 | 61% received gifted family money; 68% of Gen Z relied on parental help. Family and parental help are differently worded measures and have different populations; no subtraction as a pure generation gap. | UK newlyweds in Hitched Wedding Industry Report 2025 weddings; exact field dates not published 2,020 newlyweds; subgroup counts not published | Original research [S04] Opening findings; Generational divides |
| F22 | 56% exceeded their original budgets, 32% stayed on budget and 6% came under. Reported categories total 94%. Remaining responses are unspecified; do not renormalize or invent a 6% category. | UK newlyweds in Hitched Wedding Industry Report 2025 weddings; exact field dates not published 2,020 newlyweds; subgroup counts not published | Original research [S04] Wedding Budgets and the Economy, budget outcomes |
| F23 | Millennial weddings averaged £23,612 and Gen Z weddings £21,373. Generation definitions, subgroup sizes and adjusted differences are not supplied. | UK newlyweds in Hitched Wedding Industry Report 2025 weddings; exact field dates not published 2,020 newlyweds; subgroup counts not published | Original research [S04] Generational divides |
| F24 | Regional means were London £24,622, South East £23,589, East £23,350 and Scotland £22,123. Exact press-release London value preserved; other webpages may display a different figure. Regional cell sizes and adjustments unavailable. | UK newlyweds in Hitched Wedding Industry Report 2025 weddings; exact field dates not published 2,020 newlyweds; subgroup counts not published | Original research [S04] Regional divides |
The 101+ guest mean of £35,591 is £13,601, or approximately 61.8%, above that national mean (C11–C12). The baseline is £21,990. The original release’s “nearly 40% more” description is not reproduced by that calculation, so the qualified arithmetic is shown here. This is not a controlled effect of adding guests.
Why does the Scotland comparison change by cost measure?
Scotland was close to the UK total-cost mean but further above the per-guest mean in Hitched’s report. Total budgets and allocated cost per person do not tell the same story. Hitched / The Knot Worldwide [S04].
| ID | Finding and essential qualification | Population, period and sample | Source and locator |
|---|---|---|---|
| F25 | Scotland’s mean cost per guest was £293, against the report’s £272 UK mean. Compare with the same Hitched report, not Bridebook’s £278 measure. This is a reported group mean, not a quote for adding a guest. | UK newlyweds in Hitched Wedding Industry Report 2025 weddings; exact field dates not published 2,020 newlyweds; subgroup counts not published | Original research [S04] Regional divides, Scotland paragraph |

Scotland’s total mean was £133 higher, approximately 0.6%, while its per-guest figure was £21 higher, approximately 7.7% (C07–C10). These are descriptive comparisons of the published means. They do not establish why the difference exists or whether it is statistically significant.
Why does Bridebook give a different UK wedding figure?
Bridebook reports £20,604 in a separate survey program. Its public summary labels the wedding overview as 2025 results, while its advice page uses 2026 report labels. The sample includes married and engaged couples; full cost-item routing is not public. Bridebook [S05]; Bridebook [S06].
| ID | Finding and essential qualification | Population, period and sample | Source and locator |
|---|---|---|---|
| F26 | Bridebook’s public 2026 report summary gives £20,604 average spend under “2025 weddings at a glance.” Overall survey contains 7,000+ married/engaged couples; achieved completed-cost base and field dates are not published. | UK married and engaged couples; completed-wedding cost subset not sized 2025 weddings at a glance, alongside separate forward-looking 2026/2027 booking items 7,000+ overall; cost-answering base not disclosed | Original research [S05] Data Deep Dive — 2025 weddings at a glance |
| F27 | The public report summary says 25% of couples spent over £26,000. This high-spend statement is kept separate from the conflicting 25%/26% low-budget claims and overlapping cost bands elsewhere. | UK married and engaged couples; completed-wedding cost subset not sized 2025 weddings at a glance, alongside separate forward-looking 2026/2027 booking items 7,000+ overall; cost-answering base not disclosed | Original research [S05] Data Deep Dive — Average Spend; spending spectrum |
| F28 | The guide’s budget split allocates 51% to venue/catering, 19% to attire, 10% to photography/video, 7% to flowers/decor, 7% to entertainment and 6% to other extras. Publisher’s summary allocation; detailed estimation method not given. Do not multiply this into a personal quote or sum conditional supplier means. | UK married and actively planning couples; item-specific completed/planned routing unavailable 2026 report; companion summary labels completed-wedding results “2025 weddings at a glance” Approximately 7,000 overall; category, month and region cell sizes not disclosed | Original research [S06] Wedding Cost Breakdown — Average wedding budget split |
| F29 | Bridebook reports approximately £278 per wedding guest. Companion report mixes married and engaged respondents; exact denominator and aggregation method not supplied. Do not infer guest count from the ratio of rounded means. | UK married and actively planning couples; item-specific completed/planned routing unavailable 2026 report; companion summary labels completed-wedding results “2025 weddings at a glance” Approximately 7,000 overall; category, month and region cell sizes not disclosed | Original research [S06] TL;DR and Average Cost Per Wedding Guest |
| F30 | Selected regional means were London £26,986, Scotland £22,987 and North West England £17,342. Different survey from Hitched. Selected regions, not a complete country ranking or adjusted location effect. | UK married and actively planning couples; item-specific completed/planned routing unavailable 2026 report; companion summary labels completed-wedding results “2025 weddings at a glance” Approximately 7,000 overall; category, month and region cell sizes not disclosed | Original research [S06] Average Wedding Cost by Region in the UK |
| F31 | Reported monthly means included January £11,000, June £23,809 and August £22,351. Selected months; no monthly sample sizes. Different wedding types/guest counts can explain differences; these are not guaranteed date-switch savings. | UK married and actively planning couples; item-specific completed/planned routing unavailable 2026 report; companion summary labels completed-wedding results “2025 weddings at a glance” Approximately 7,000 overall; category, month and region cell sizes not disclosed | Original research [S06] Cheapest and Most Expensive Months, monthly table |
The £1,386 difference between Hitched’s and Bridebook’s headline means (C13) is a difference between sources. It is not a fall in UK spending, a confidence interval or a reason to average the figures into a new national estimate. Likewise, month and region tables do not show the savings a particular couple would receive simply by changing a date or address.
What do Australian wedding cost and starting-budget figures show?
Easy Weddings quotes A$29,471 as an original average budget and A$38,252 as a final average. The public guide draws on 4,000+ engaged and recently married couples, with exact paired item bases unavailable. Easy Weddings [S07].
| ID | Finding and essential qualification | Population, period and sample | Source and locator |
|---|---|---|---|
| F32 | Easy Weddings quotes A$38,252 average wedding-day spending and A$29,471 average original budget. 2026 report with 4,000+ engaged/recently married couples; paired/completed item bases are unknown. Ratio of these means is not a mean individual overspend rate. | Australian engaged and recently married couples 2026 annual report; recently married and engaged respondents; exact fieldwork/wedding-period split unavailable 4,000+ overall; individual cost and funding item bases not supplied | Original research [S07] How much to spend on a wedding? |
| F33 | 69% of couples received financial assistance from family. Share of couples, not a 69% share of wedding dollars; survey item base not disclosed. | Australian engaged and recently married couples 2026 annual report; recently married and engaged respondents; exact fieldwork/wedding-period split unavailable 4,000+ overall; individual cost and funding item bases not supplied | Original research [S07] How much to spend on a wedding?, financial assistance paragraph |
| F34 | The venue average was A$17,518, with the guide describing venue spending as about 46% of the overall budget. Venue packages may include services also appearing elsewhere. Do not add every vendor-category average as an all-in wedding cost. | Australian engaged and recently married couples 2026 annual report; recently married and engaged respondents; exact fieldwork/wedding-period split unavailable 4,000+ overall; individual cost and funding item bases not supplied | Original research [S07] Wedding venues |
| F35 | Published category averages included A$3,125 for video, A$2,639 for flowers and A$2,142 for music. Category-specific users and package definitions may differ. These are neither universal required purchases nor a single additive budget. | Australian engaged and recently married couples 2026 annual report; recently married and engaged respondents; exact fieldwork/wedding-period split unavailable 4,000+ overall; individual cost and funding item bases not supplied | Original research [S07] Videography; Wedding flowers; Wedding music |
| F36 | The reported engagement-ring average was A$6,842. Separately named item; inclusion in the wedding-day headline is not explicitly reconciled in public methods. Do not automatically add or remove it from the headline. | Australian engaged and recently married couples 2026 annual report; recently married and engaged respondents; exact fieldwork/wedding-period split unavailable 4,000+ overall; individual cost and funding item bases not supplied | Original research [S07] Engagement rings |
| F37 | Published category averages were A$6,177 for catering, A$1,031 for a celebrant and A$2,591 for a wedding dress. Separate category bases and package inclusions; venue/catering can overlap. Do not sum them into an invented average wedding. | Australian engaged and recently married couples 2026 annual report; recently married and engaged respondents; exact fieldwork/wedding-period split unavailable 4,000+ overall; individual cost and funding item bases not supplied | Original research [S07] Catering; Marriage celebrants; Wedding dresses |
| F38 | The industry analysis says 17% spent A$60,000 or more. Same survey as the cost guide; it is not a second independent study. Exact item count and weighting unavailable. | Australian couples in annual industry survey 2026 annual report; exact fieldwork dates not supplied Companion guide says 4,000+ couples; luxury-item base not disclosed | Original research [S08] The Budget Boom, budget polarisation paragraph |
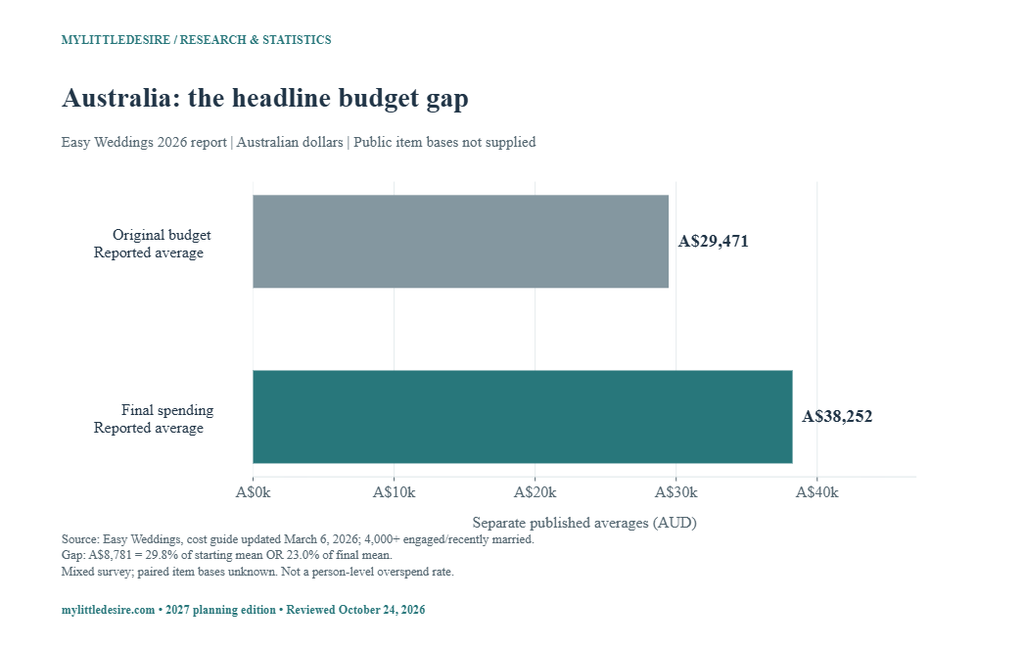
One gap, two denominators: A$38,252 − A$29,471 = A$8,781. That is approximately 29.8% of the quoted original average, or 23.0% of the final average (C14–C16). The publisher describes an average 23% over original budget; its public pages do not show the paired calculation. Although 23.0% matches the second denominator numerically, that does not establish the publisher’s method. Neither ratio is labelled here as the average person’s overspend.
The venue figure divided by the headline total is approximately 45.8% (C17), close to the guide’s rounded 46% description. A ratio of two averages still need not equal the average of each couple’s venue share. Category packages and user bases can differ, so adding venue, catering, music and every other supplier average would create a misleading total.
What did Canadian clients plan and eventually spend?
Wealthsimple’s client survey reports a C$15,000 median starting budget and C$25,000 median final bill. Its approximately C$37,000 mean final bill illustrates how the choice of summary statistic changes the headline. This is a client sample rather than a national Canadian wedding-cost estimate. Wealthsimple [S09].
| ID | Finding and essential qualification | Population, period and sample | Source and locator |
|---|---|---|---|
| F39 | The client survey gives a C$15,000 median initial budget, C$25,000 median final bill and an approximately C$37,000 mean final bill. Client newlywed subset not sized. Median final minus median initial is not the median person’s overrun; mean is approximate, not a Canadian national estimate. | Wealthsimple clients: newlyweds, engaged people, guests, wedding-party members and those delaying weddings July 2026 survey; recent weddings and invitation experiences, some within the past three years 1,236 clients overall; subgroup counts not published | Original research [S09] Couples drastically underestimate wedding costs; footnote 1 |
| F40 | 69% of surveyed newlyweds felt pressure to spend beyond what they were comfortable with. Newlywed Wealthsimple clients, not all Canadian married people; pressure is not the same as actual overspending. | Wealthsimple clients: newlyweds, engaged people, guests, wedding-party members and those delaying weddings July 2026 survey; recent weddings and invitation experiences, some within the past three years 1,236 clients overall; subgroup counts not published | Original research [S09] Couples drastically underestimate wedding costs |
| F41 | Funding the shortfall included family help (28%), a credit card (26%) and a line of credit (9%). Subgroup counts/full routing not published. Multiple sources can overlap; card use alone does not measure unpaid revolving debt. | Wealthsimple clients: newlyweds, engaged people, guests, wedding-party members and those delaying weddings July 2026 survey; recent weddings and invitation experiences, some within the past three years 1,236 clients overall; subgroup counts not published | Original research [S09] Couples drastically underestimate wedding costs, secondary funding |
| F42 | Payment stress was reported by 47% with personal incomes up to C$75,000 and 59% earning C$150,000 or more. Personal income, not household income. Selective client sample and unsized income cells; no causal wealth effect. | Wealthsimple clients: newlyweds, engaged people, guests, wedding-party members and those delaying weddings July 2026 survey; recent weddings and invitation experiences, some within the past three years 1,236 clients overall; subgroup counts not published | Original research [S09] The more you earn, the more stressful it is paying for a wedding |
| F43 | Budget overruns were reported by 46% in the up-to-C$75,000 personal-income group and 58% in the C$150,000+ group. Separate outcome from stress. Personal-income grouping; no adjustment or significance test published. | Wealthsimple clients: newlyweds, engaged people, guests, wedding-party members and those delaying weddings July 2026 survey; recent weddings and invitation experiences, some within the past three years 1,236 clients overall; subgroup counts not published | Original research [S09] The more you earn, the more stressful it is paying for a wedding, second paragraph |
| F44 | Among guests and wedding-party members, 36% had declined an invitation over cost in the past three years, 22% attended despite financial stress and 14% borrowed to attend. Wedding or pre-event invitations. Time window and multiple events mean these categories should not be added into a universal mutually exclusive distribution. | Wealthsimple clients: newlyweds, engaged people, guests, wedding-party members and those delaying weddings July 2026 survey; recent weddings and invitation experiences, some within the past three years 1,236 clients overall; subgroup counts not published | Original research [S09] One in three guests has skipped a wedding or pre-party over cost |
| F45 | 22% of guests spent over C$1,000 on one wedding; 39% of wedding-party members spent at least C$2,000. Different populations and thresholds; do not subtract as a like-for-like spending gap. | Wealthsimple clients: newlyweds, engaged people, guests, wedding-party members and those delaying weddings July 2026 survey; recent weddings and invitation experiences, some within the past three years 1,236 clients overall; subgroup counts not published | Original research [S09] One in three guests, ordinary guests and party members paragraph |
| F46 | 14% planned a small wedding initially; 22% ultimately hosted fewer than 25 guests and 36% hosted 50 or fewer. “Small” in the intention question is not harmonized with either actual guest threshold. Do not infer the share who personally switched sizes. | Wealthsimple clients: newlyweds, engaged people, guests, wedding-party members and those delaying weddings July 2026 survey; recent weddings and invitation experiences, some within the past three years 1,236 clients overall; subgroup counts not published | Original research [S09] Some couples shrink their weddings. Others call it off. |
| F47 | Among those delaying or deciding against a wedding, 93% cited cost as significant, 41% as the main reason and 68% would still have a wedding if money were no object. Conditional on already postponing/rejecting a wedding, not all unmarried Canadians. A wedding is not synonymous with legal marriage. | Wealthsimple clients who had put off or decided against a wedding July 2026 survey; recent weddings and invitation experiences, some within the past three years 1,236 clients overall; subgroup counts not published | Original research [S09] Some couples shrink their weddings, access to funds paragraph |
| F48 | The median budget for the newly engaged group was C$25,000, compared with C$15,000 initially budgeted by recent newlyweds. Different client cohorts at different stages; not a matched-person trend, inflation estimate or prediction of final costs. | Wealthsimple clients: newlyweds, engaged people, guests, wedding-party members and those delaying weddings July 2026 survey; recent weddings and invitation experiences, some within the past three years 1,236 clients overall; subgroup counts not published | Original research [S09] Newly engaged couples are bracing themselves; footnote 1 |
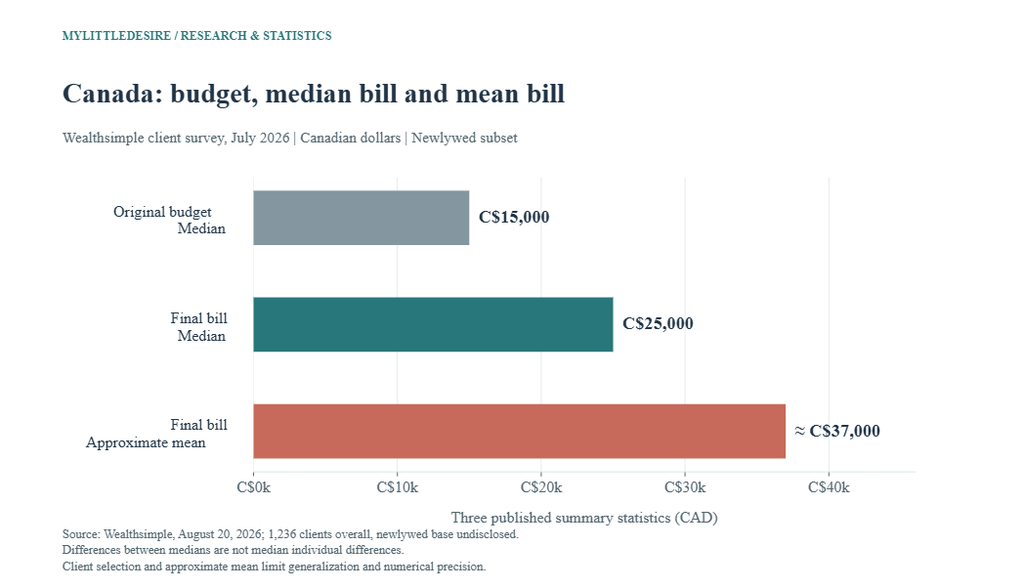
The medians differ by C$10,000, or approximately 66.7% relative to the starting median (C18–C19). Subtracting medians does not produce the median individual overrun. The mean final bill is approximately C$12,000, or 48.0%, above the median final bill (C20–C21), using a rounded approximate input.
Both payment stress and budget overruns were 12.0 percentage points higher in the C$150,000+ personal-income group than in the up-to-C$75,000 group (C22–C23). They are separate outcomes. The selected clients and unknown income-cell sizes do not support a conclusion that earning more causes wedding stress.
What do Canadians expect weddings and attendance to cost?
BMO/Ipsos respondents estimated a C$19,000 wedding and C$1,530 to attend one. These are expectations, rather than measured newlywed bills or final guest expenditure. BMO / Ipsos [S10].
| ID | Finding and essential qualification | Population, period and sample | Source and locator |
|---|---|---|---|
| F49 | Respondents estimated an average C$19,000 wedding cost. Expectation rather than retrospective expenditure. It is not directly comparable with Wealthsimple’s C$25,000 median or C$37,000 mean. | Canadian adults age 18+; wedding/guest questions use source-specific eligible respondents 2025-12-29 to 2026-01-27 2,503 adults overall; eligible item bases not published | Original research [S10] The Cost of Walking Down the Aisle — Something Borrowed and Something Budgeted |
| F50 | Estimated category costs included food/drink C$4,884, venue C$4,201, attire C$2,951, travel/accommodation C$2,834, decorations C$1,713, entertainment C$1,603 and photo/video C$1,648. Amounts are supplied “when applicable”; bases may differ. Their sum is not an independently verified national wedding total. | Canadian adults age 18+; wedding/guest questions use source-specific eligible respondents 2025-12-29 to 2026-01-27 2,503 adults overall; eligible item bases not published | Original research [S10] Something Borrowed and Something Budgeted, category amounts |
| F51 | Wedding guests expected to need C$1,530 on average to attend, including travel, attire, gifts and other expenses. Expected attendance cost, not the mean amount actually paid. Eligible item count not published. | Canadian adults age 18+; wedding/guest questions use source-specific eligible respondents 2025-12-29 to 2026-01-27 2,503 adults overall; eligible item bases not published | Original research [S10] Wedding Guest Stress, first bullet |
| F52 | 40% called attending friends’ or family weddings a major financial stress; the figure was 49% among Millennials. Respondents’ reported stress, not a measured affordability threshold. Generation cell sizes not supplied. | Canadian adults age 18+; wedding/guest questions use source-specific eligible respondents 2025-12-29 to 2026-01-27 2,503 adults overall; eligible item bases not published | Original research [S10] Wedding Guest Stress, second bullet |
BMO’s category amounts are given where applicable. They need not refer to identical respondents or packages, so they should not be forced to sum to the headline mean. Subtracting C$19,000 from Wealthsimple’s approximate C$37,000 would also mix expectations and retrospective client spending from different samples.
How do wedding costs affect invitation decisions?
TD’s April 2026 survey found a higher cost-related attendance response among Gen Z summer-wedding invitees than among invitees overall. The question combines declining invitations with becoming more selective. TD / Leger [S11].
| ID | Finding and essential qualification | Population, period and sample | Source and locator |
|---|---|---|---|
| F53 | 48% of people invited to summer weddings had declined or were becoming more selective about attendance because of costs. Conditional invitation base; the release’s comparator is interpreted in this invitation context, not as 48% of every Canadian adult. | Canadian survey respondents invited to summer weddings 2026-04-17 to 2026-04-27 1,500 adults overall; all-invitee and Gen Z invitee counts not supplied | Original research [S11] Why Gen Z is spending differently, wedding invitation paragraph |
| F54 | Among Gen Z respondents invited to summer weddings, 64% had declined or were being more selective. Gen Z invitee base not supplied. Includes selectivity, so not a 64% outright refusal rate. | Gen Z Canadian respondents invited to summer weddings 2026-04-17 to 2026-04-27 1,500 adults overall; all-invitee and Gen Z invitee counts not supplied | Original research [S11] Why Gen Z is spending differently, wedding invitation paragraph |
The difference was 16.0 percentage points, 64% minus 48% (C24). It is not a 64% refusal rate or a percentage of all Canadians. The two groups also overlap because Gen Z invitees are included in the overall invitee group.
What does US research on wedding debt and money conversations measure?
LendingTree’s March 2025 survey describes US adults married within the preceding two years. Its results are historical and do not measure 2027 couples. The main text’s 67% debt figure is retained with the conflicting 66% image description disclosed. LendingTree / QuestionPro [S12].
| ID | Finding and essential qualification | Population, period and sample | Source and locator |
|---|---|---|---|
| F55 | The main text says 67% of newlyweds took on wedding-related debt. March 2025 nonprobability survey, with marriages in the prior two years. Image description says 66%; retain discrepancy and use attributed text figure, not a precision claim. | US newlyweds ages 18–79 2025-03-12 to 2025-03-19; respondents married within the preceding two years 1,050 overall; conditional debtor and other item bases not published | Original research [S12] Key findings; 67% of newlyweds took on debt |
| F56 | 24% of all surveyed newlyweds still owed wedding debt; among those still owing, 41% expected at least another year to repay it. The 41% uses the remaining-debtor subset, not all newlyweds. Expected repayment is not an observed future outcome. | US newlyweds ages 18–79 2025-03-12 to 2025-03-19; respondents married within the preceding two years 1,050 overall; conditional debtor and other item bases not published | Original research [S12] Key findings, first bullet |
| F57 | Primary payment methods included savings (46%), credit cards (24%) and parents/relatives (16%). Selected primary-method categories only; not all ways people paid and not a full distribution. Card use does not equal unpaid debt. | US newlyweds ages 18–79 2025-03-12 to 2025-03-19; respondents married within the preceding two years 1,050 overall; conditional debtor and other item bases not published | Original research [S12] Key findings, first bullet |
| F58 | 32% exceeded their wedding budgets while 53% stayed close to them. “Close to budget” differs from exactly on budget. Do not rank this against other survey overrun rates as if questions and periods matched. | US newlyweds ages 18–79 2025-03-12 to 2025-03-19; respondents married within the preceding two years 1,050 overall; conditional debtor and other item bases not published | Original research [S12] A third of newlyweds felt pressured to spend more than they could afford |
| F59 | 52% regretted their spending amount: 26% wanted to have spent more and 26% less. Regret is not synonymous with excessive spending: it includes wishing the budget had been larger. | US newlyweds ages 18–79 2025-03-12 to 2025-03-19; respondents married within the preceding two years 1,050 overall; conditional debtor and other item bases not published | Original research [S12] Most newlyweds regret how much they spent on their weddings |
| F60 | 53% reported financial arguments with their partner before or after the wedding; 23% named money as their top wedding-planning stressor. Distinct questions and periods; self-reported experiences do not establish that wedding spending caused conflict or divorce. | US newlyweds ages 18–79 2025-03-12 to 2025-03-19; respondents married within the preceding two years 1,050 overall; conditional debtor and other item bases not published | Original research [S12] Key findings; Money was the biggest source of stress; Most newlyweds have argued |
Primary use of a credit card, taking on any debt and still owing debt are three different measures. Spending regret also includes wishing more had been spent. For the wider relationship context, see MyLittleDesire’s relationship satisfaction, trust and communication statistics and financial infidelity research. Wedding costs and finance arrangements do not themselves establish deception.
What reproducible comparisons does MyLittleDesire contribute?
The contribution is a convenient, traceable synthesis and transparent arithmetic. Several calculations restate differences already visible in or discussed by the original sources. They are not new scientific discoveries, original fieldwork or significance-tested effects.
| ID | Comparison | Result | Qualification and sources |
|---|---|---|---|
| C01 | US published mean minus median | USD 10,000 | Same report; rounded mean. Not mean household overpayment. The Knot / The Knot Worldwide [S01] |
| C02 | US mean above median, median as baseline | Approximately 41.7% | Uses PDF US$34,000, not companion US$34,200; ratio of summary statistics. The Knot / The Knot Worldwide [S01] |
| C03 | US median below mean, mean as baseline | Approximately 29.4% | A reverse percentage has a different denominator; not interchangeable with C02. The Knot / The Knot Worldwide [S01] |
| C04 | US 51–100 minus 1–50 guest mean | USD 10,100 | Unadjusted guest-band difference, not guaranteed savings or a marginal per-guest cost. The Knot / The Knot Worldwide [S02] |
| C05 | US >100 minus 1–50 guest mean | USD 26,200 | Open upper guest band; not a fixed number of additional guests or a causal effect. The Knot / The Knot Worldwide [S02] |
| C06 | US over-budget share after removing no-budget responses | Approximately 51.9% | Rebases rounded reported categories, 41/79. Approximately 51.9%, not an original published exact rate; item-level counts unavailable. The Knot / The Knot Worldwide [S01] |
| C07 | Scotland minus UK mean total wedding cost | GBP 133 | Same Hitched source; regional sample counts and uncertainty unavailable. Hitched / The Knot Worldwide [S04] |
| C08 | Scotland total-cost premium relative to UK mean | Approximately 0.6% | Descriptive ratio of unadjusted regional and UK means; not significance-tested. Hitched / The Knot Worldwide [S04] |
| C09 | Scotland minus UK cost per guest | GBP/guest 21 | Same reported per-guest measure, separate geographic aggregates. Hitched / The Knot Worldwide [S04] |
| C10 | Scotland per-guest premium relative to UK mean | Approximately 7.7% | Different denominator/estimand from total wedding cost; not evidence of a regional vendor-price effect. Hitched / The Knot Worldwide [S04] |
| C11 | UK 101+ guest mean minus national mean | GBP 13,601 | National mean includes weddings in that guest group; not independent samples or causal adjustment. Hitched / The Knot Worldwide [S04] |
| C12 | UK 101+ guest premium, national mean as baseline | Approximately 61.9% | 61.8%, rather than repeating the release’s unreproducible “nearly 40% more” wording. Hitched / The Knot Worldwide [S04] |
| C13 | UK Hitched headline minus Bridebook headline | GBP 1,386 | Separate survey programs and incomplete basket/answering-base details. A headline difference, not a time trend or error estimate. Hitched / The Knot Worldwide [S04], Bridebook [S05] |
| C14 | Australia final average minus starting average | AUD 8,781 | Mixed engaged/recently married survey; paired item bases not published. Difference of reported averages, not individual average overrun. Easy Weddings [S07] |
| C15 | Australia headline gap as share of starting average | Approximately 29.8% | 29.8% is the ratio from these headline means. It does not reproduce a mean individual overspend measure. Easy Weddings [S07] |
| C16 | Australia same headline gap as share of final average | Approximately 23.0% | 23.0% uses final cost as denominator. Numerically close to the publisher’s 23%; its actual method is unknown, so no explanation is asserted. Easy Weddings [S07] |
| C17 | Australia venue mean divided by total mean | Approximately 45.8% | Ratio of published averages, approximately 45.8%. Not necessarily the mean individual venue-budget share. Easy Weddings [S07] |
| C18 | Canada median final bill minus median original budget | CAD 10,000 | Client newlywed subset; difference of medians, not median person-level overrun. Wealthsimple [S09] |
| C19 | Canada median-bill gap relative to median starting budget | Approximately 66.7% | 66.7% compares two medians; not the mean/median individual overspend rate or a national rate. Wealthsimple [S09] |
| C20 | Canada approximate mean minus median final bill | CAD 12,000 | Approximate mean, rounded inputs and unsized client subset; not an exact national gap. Wealthsimple [S09] |
| C21 | Canada approximate mean above median final bill | Approximately 48.0% | Approximately 48.0%; no implied precision beyond the source’s approximate mean. Wealthsimple [S09] |
| C22 | Canada high-minus-lower personal-income payment stress | 12.0 percentage points | Personal incomes C$150,000+ versus C$75,000 or less, client sample; no causal income effect. Wealthsimple [S09] |
| C23 | Canada high-minus-lower personal-income budget overruns | 12.0 percentage points | Same income thresholds, different outcome from C22; sample cells and significance unavailable. Wealthsimple [S09] |
| C24 | Canada Gen Z minus all summer-invitee cost selectivity | 16.0 percentage points | Gen Z is a subset of all invitees. Declined OR more selective; not an outright-refusal gap. TD / Leger [S11] |
What cannot be concluded from these wedding statistics?
- There is no verified universal 2027 cost, country affordability ranking or pooled over-budget rate in this resource.
- The surveys are not interchangeable. Different samples, cost baskets, wedding periods and question wording can change their results.
- A difference of medians is not a median of individual differences; a ratio of averages is not necessarily an average individual ratio.
- A guest-count, month or income difference is not a controlled causal effect. No new significance tests are performed.
- Multiple funding methods can overlap. Card use is not automatically debt, and a primary method is not every method used.
- Selected clients and commercial-platform members do not represent every couple. Overall sample sizes are not the answering counts for every subgroup.
- Wedding spending and money arguments cannot establish that spending causes divorce. No such inference is made.
How were the statistics selected and verified?
For each finding, the research file records the value, units, actual period, geography, population, sample-size availability, method, source locator, caveats and verification status. Related response categories stay in one finding group; repeat articles from the same study are not counted as independent research.
The Knot’s original PDF was checked at the methodology, historical table, budget chart and cost-distribution pages. Public summaries were used for Bridebook and Easy Weddings; their contact-form downloads were not accessed. Exact field dates, item counts or weighting are marked unavailable where the original page does not provide them. Verification means checking what the source reports, not auditing respondents or independently validating its fieldwork.
Conflicting figures were either excluded or retained with explicit attribution and qualifications. Examples include the two Knot mean precisions, Easy Weddings’ unreconciled budget ratio, an Australian photography discrepancy, a Bridebook low-spending share inconsistency and LendingTree’s text/image debt discrepancy. Historical LendingTree findings stay dated to 2025 fieldwork.
Amounts remain in USD, GBP, AUD or CAD; no exchange-rate conversion, inflation adjustment or pooling is applied. Calculations are descriptive, rounded to useful precision and tied to named source inputs. Charts are MyLittleDesire’s designs based on third-party research. Static chart files must be rebuilt after changing the workbook or research inputs.
Complete original sources
- S01 · The Knot / The Knot Worldwide. The Knot Real Weddings Study 2026 — Data Read-Out. Published: 2026-02-18 release; PDF day not separately printed. Actual period: Weddings January–December 2025; report also includes ad hoc planning studies. Sample: 10,474 married couples in main study; item-level and ad hoc bases not fully disclosed. Method: Email-invited membership survey; retrospective self-report; ad hoc research also included. Limitations: Not a probability sample of every US marriage. Published mean is rounded US$34,000, while companion guide reports US$34,200. Budget/planning item bases are not separately supplied.
- S02 · The Knot / The Knot Worldwide. This Is the Average Wedding Cost, Backed By Data. Published: Updated 2026-09-29. Actual period: 2025 weddings, reported in 2026. Sample: 10,474 main-study couples; guest-band, season and budget-band cell sizes not published. Method: Companion analysis of The Knot 2026 Real Weddings Study. Limitations: Same underlying survey as S01, not independent confirmation. Groups are observational and differ in more than guest count. Headline US$34,200 differs in precision from PDF US$34,000.
- S03 · Zola. 2026 Wedding Trends: Zola’s First Look Report. Published: Updated 2026-10-16; original publication day not confirmed. Actual period: Couples preparing for 2026 weddings; exact field dates not published on article. Sample: More than 11,500 couples; conditional/generation cell sizes not published. Method: Publisher survey of engaged couples; public article does not supply full recruitment or weighting details. Limitations: Planning-stage research, not completed full-year 2026 spending. US-facing report; detailed geographic recruitment not published. Credit-card use may mean points/payment convenience rather than unpaid debt.
- S04 · Hitched / The Knot Worldwide. The average cost of a wedding in 2026? Around £21,990, according to Hitched. Published: 2026-01-07. Actual period: 2025 weddings; exact field dates not published. Sample: 2,020 newlyweds; subgroup counts not published. Method: Commissioned post-wedding survey; recruitment, weighting and item bases not supplied in release. Limitations: Release headline uses 2026, but observations concern 2025 weddings. Its “nearly 40% more” comparison is not reproducible with the national mean as denominator. Budget outcome categories sum to 94%; missing category not inferred. Basket exclusions not fully defined in cited release.
- S05 · Bridebook. The UK Wedding Report 2026 — public report summary. Published: 2026 report; exact publication and update day not printed. Actual period: 2025 weddings at a glance, alongside separate forward-looking 2026/2027 booking items. Sample: 7,000+ overall; cost-answering base not disclosed. Method: Platform survey summary; full report offered through a contact form. Limitations: No form submitted. Field dates and weighting not accessible in public summary. Page alternates 25% and 26% around the £10,000 threshold; that low-cost percentage is held out.
- S06 · Bridebook. Average Wedding Cost UK 2026: £20,604 Full Budget Breakdown. Published: Updated 2026-09-08. Actual period: 2026 report; companion summary labels completed-wedding results “2025 weddings at a glance”. Sample: Approximately 7,000 overall; category, month and region cell sizes not disclosed. Method: Original publisher’s companion cost tables. Limitations: Same survey as S05. Article’s year labels do not establish completed 2026 outcomes. Budget-share summary and conditional supplier averages are different measures; do not add supplier averages. No uncertainty intervals or adjusted seasonal effects supplied.
- S07 · Easy Weddings. How much does a wedding cost in 2026?. Published: Updated 2026-03-06. Actual period: 2026 annual report; recently married and engaged respondents; exact fieldwork/wedding-period split unavailable. Sample: 4,000+ overall; individual cost and funding item bases not supplied. Method: Annual commercial platform survey; public cost guide, not transaction audit. Limitations: Mixed planning/completed sample; no full weighting or paired-budget method. Quoted starting and final averages imply 29.8% relative to starting cost, while publisher says 23%; those estimands are not reconciled. Photography differs across official pages and is excluded.
- S08 · Easy Weddings. 2026 wedding industry: Why rising budgets and “human first” values are your biggest opportunity. Published: Updated 2026-02-18. Actual period: 2026 annual report; exact fieldwork dates not supplied. Sample: Companion guide says 4,000+ couples; luxury-item base not disclosed. Method: Original publisher’s public industry analysis. Limitations: Same underlying program as S07. Commercial interpretation is not evidence of causation. Full report contact form not submitted.
- S09 · Wealthsimple. The Market Mindset: most couples budget for their wedding. They overspend by nearly 70%.. Published: 2026-08-20. Actual period: July 2026 survey; recent weddings and invitation experiences, some within the past three years. Sample: 1,236 clients overall; subgroup counts not published. Method: Company-client survey; article defines “typical” as median; recruitment and weighting not published. Limitations: Not representative of all Canadians. Difference between medians is not median or mean individual overspend. Mean final bill is approximate. Survey includes promotional loan material, which is not adopted as advice.
- S10 · BMO / Ipsos. Til Debt Do Us Part: BMO Survey Reveals Many Canadians Are Unprepared for the Costs of Weddings and Divorces. Published: 2026-07-08. Actual period: 2025-12-29 to 2026-01-27. Sample: 2,503 adults overall; eligible item bases not published. Method: Ipsos survey with quotas and census weighting; full recruitment/mode not stated in release. Limitations: Costs are respondents’ estimates, not measured newlywed expenditure. Category amounts apply where relevant and must not be added as a universal budget. Publisher’s credibility interval is not treated as a probability-sample margin of error here.
- S11 · TD / Leger. Canadians cool down summer spending as cost pressures heat up: TD survey. Published: 2026-05-26. Actual period: 2026-04-17 to 2026-04-27. Sample: 1,500 adults overall; all-invitee and Gen Z invitee counts not supplied. Method: Leger Opinion online panel; weighted by age, gender, region and Quebec language to census. Limitations: Publisher describes representativeness; online-panel results are not a simple random sample. Its probability-sample margin is a comparison only. Wedding figures are conditional on invitations, not all Canadians.
- S12 · LendingTree / QuestionPro. Two-Thirds of Newlyweds Went Into Debt for Their Wedding, and a Third Felt Pressured to Overspend. Published: Updated 2025-04-28. Actual period: 2025-03-12 to 2025-03-19; respondents married within the preceding two years. Sample: 1,050 overall; conditional debtor and other item bases not published. Method: Online nonprobability sample; quotas and response quality checks. Limitations: Historical 2025 fieldwork, not 2027 prevalence or exclusively 2025 weddings. Main text says 67% debt; image description says 66%. Primary payment method is not the only payment method, and credit use need not imply remaining debt.
How to cite this research resource
For this compilation or a MyLittleDesire chart/calculation, cite the page and the underlying original research. For an individual survey finding, also consult and cite that study directly.
MyLittleDesire. Wedding Cost & Budget Statistics 2027: What Couples Plan and Spend. 2027 planning edition https://mylittledesire.com/wedding-cost-statistics/. Add your actual access date where required by your citation style.