
Wedding planning research reveals more than fashionable colors. It shows who handles the work, when decisions begin, which tasks couples delegate to AI and where personal preferences differ from supplier bookings. Understanding the question behind each percentage makes the findings more useful.
This resource contains 60 grouped findings from seven survey programs plus one signal-and-forecast program, documented in 10 original-source records. Four charts and 20 descriptive calculations make selected comparisons easier to check. Related response categories stay grouped; multiple documents are not independent studies. MyLittleDesire contributes verification, organization, chart design and qualified arithmetic, rather than original survey fieldwork.
What are the key wedding planning findings?
7 hours
64% vs 17%
Average weekly planning time in The Knot’s 2026 report; not total project hours. The Knot / The Knot Worldwide [S01].
Approximate shares of planning tasks handled by the primary and other partner, respectively. The Knot / The Knot Worldwide [S01].
90%
19%
Created a wedding website in The Knot’s research on 2025 weddings. The Knot / The Knot Worldwide [S01].
Zola respondents entered full planning mode before engagement. Zola [S03].
54%
63%
Used AI in wedding planning in Zola’s 2026 planning-cohort survey. Zola [S03].
Said AI should not write wedding vows in the same Zola report. Zola [S03].
11 points
79% / 92%
Gen Z’s lead over Millennials in social-first content plans: 29% versus 18% (C07). Zola [S03].
Bridebook reported cumulative venue bookings within four weeks / two months of first contact. Bridebook [S04].
74% vs 36%
37% + 42%
Would hire a photographer versus someone to film, in YouGov’s filtered UK preference survey. YouGov [S07].
Definite and maybe answers on down-payment gifts in Canada; eligibility includes knowing someone planning. Royal LePage / Burson / Leger Opinion [S08].
40% vs 19%
+315%
Unmarried US Gen Z adults aged 22+ in Affirm/Talker preferred small versus large weddings. Affirm / Talker Research [S09].
The Knot’s reported year-over-year beach-club search growth, based on 2026 signals; not 2027 adoption. The Knot / The Knot Worldwide [S10].
What do wedding planning statistics actually measure?
Behavior, plans, preferences and forecasts answer different questions. A supplier hired for a completed wedding is different from a service someone would choose if marrying now. Positive feelings about AI are different from using it. A rising search term shows changing activity on a platform, rather than the share of weddings adopting a style.
| Evidence type | Example in this resource | Safe interpretation |
|---|---|---|
| Completed-wedding research | The Knot’s 2025 weddings; Bridebook’s 2025 overview | What the sampled couples reported, with public item bases often unavailable. |
| Engaged-couple planning | Zola’s 2026 planning cohort | Plans and current self-reported activity, rather than final completed-wedding outcomes. |
| Hypothetical preferences | YouGov UK choices; Royal LePage Canadian questions | What eligible respondents would choose or consider; not confirmed bookings. |
| Early forward bookings | Bridebook’s 2027 barn figure | The composition of bookings to date, with an unpublished snapshot date and cell count. |
| Platform signals and forecast | The Knot’s September 2026 report for 2027 | Reported changes in on-site signals and editorial predictions; not realized 2027 prevalence. |
How much time and work does wedding planning involve?
The Knot reports an average seven hours a week and an average 14-month engagement. Those are different summaries. Engagement is not continuous planning time, and weekly intensity is not known to stay constant. Multiplying them into a total number of planning hours would create an unsupported estimate. The Knot / The Knot Worldwide [S01].
| ID | Finding and essential qualification | Population, period and sample | Source and locator |
|---|---|---|---|
| F01 | The report gives an average seven hours of wedding planning per week. Reported weekly average, not total project hours or a prescription; no constant planning intensity is assumed. | US adult The Knot/WeddingWire members; some items from separate engaged-couple studies 2025 weddings; report includes additional engaged-couple research 10,474 married couples in main study; item/ad hoc bases not fully published | Original research [S01] PDF physical p.9 / printed p.7, Key Planning Actions |
| F02 | Average engagement length was 14 months in the report’s planning overview. Engagement duration is not the number of months spent continuously planning. Do not multiply by weekly hours into a lifetime total. | US adult The Knot/WeddingWire members; some items from separate engaged-couple studies 2025 weddings; report includes additional engaged-couple research 10,474 married couples in main study; item/ad hoc bases not fully published | Original research [S01] PDF physical p.9 / printed p.7, opening paragraph |
| F03 | 41% of planning was done on a mobile device. Share of planning activity as reported, not the share of people who ever use a phone or a mobile-only share. | US adult The Knot/WeddingWire members; some items from separate engaged-couple studies 2025 weddings; report includes additional engaged-couple research 10,474 married couples in main study; item/ad hoc bases not fully published | Original research [S01] PDF physical p.9 / printed p.7, Key Planning Actions |
| F04 | 90% created a wedding website and 82% set up a registry. Different activities which can overlap; not a mutually exclusive distribution. Registry adoption does not specify gifts, cash or both. | US adult The Knot/WeddingWire members; some items from separate engaged-couple studies 2025 weddings; report includes additional engaged-couple research 10,474 married couples in main study; item/ad hoc bases not fully published | Original research [S01] PDF physical p.9 / printed p.7, Key Planning Actions |
| F05 | The primary partner handled roughly 64% of planning tasks and the other partner about 17%. Shares of work, not percentages of couples. Remaining tasks were shared with support networks; task counts are not hours or a gender-specific allocation. | US adult The Knot/WeddingWire members; some items from separate engaged-couple studies 2025 weddings; report includes additional engaged-couple research 10,474 married couples in main study; item/ad hoc bases not fully published | Original research [S01] PDF physical p.9 / printed p.7, Roles + Support System |
| F06 | Support networks provided input/guidance for 73% and emotional support for 66%. Support forms can overlap; do not add the percentages as different people or exclusive outcomes. | US adult The Knot/WeddingWire members; some items from separate engaged-couple studies 2025 weddings; report includes additional engaged-couple research 10,474 married couples in main study; item/ad hoc bases not fully published | Original research [S01] PDF physical p.9 / printed p.7, Roles + Support System |
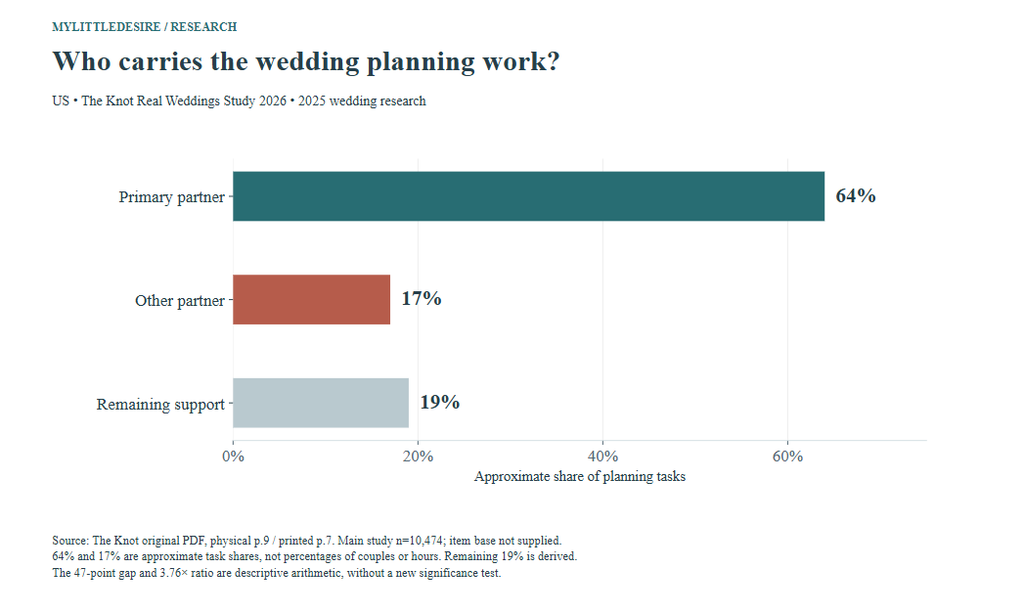
The reported primary partner handled roughly 47 percentage points more of the task load and approximately 3.76 times the other partner’s share (C01–C02). That is an imbalance in task shares. It does not establish a gender split, hours worked or the percentage of couples with an unequal relationship. The calculated remaining support share is approximately 19% (C03).
How do support and personalization shape the celebration?
Families, friends and wedding parties can advise, provide emotional support or carry out tasks. These roles can overlap. Likewise, including an additional event is not the same measure as the duration of the overall celebration.
| ID | Finding and essential qualification | Population, period and sample | Source and locator |
|---|---|---|---|
| F07 | 71% of celebrations spanned two to three days; reported related events included rehearsal dinner 75%, welcome drinks 26%, after-party 27% and next-day brunch 21%. Different reported event measures, with full item routing unavailable. Do not add overlapping events or equate a two–three-day celebration with three-or-more days. | US adult The Knot/WeddingWire members; some items from separate engaged-couple studies 2025 weddings; report includes additional engaged-couple research 10,474 married couples in main study; item/ad hoc bases not fully published | Original research [S01] PDF physical p.9 / printed p.7, Top of Mind |
| F08 | 90% aimed for an authentic, highly personalized wedding. A stated goal, not the measured share achieving a uniquely personalized event; item base unavailable. | US adult The Knot/WeddingWire members; some items from separate engaged-couple studies 2025 weddings; report includes additional engaged-couple research 10,474 married couples in main study; item/ad hoc bases not fully published | Original research [S01] PDF physical p.10 / printed p.8, opening paragraph |
| F09 | 71% prioritized advice from friends and family while planning. Advice priority is different from who executes tasks or pays; no causal influence estimate. | US adult The Knot/WeddingWire members; some items from separate engaged-couple studies 2025 weddings; report includes additional engaged-couple research 10,474 married couples in main study; item/ad hoc bases not fully published | Original research [S01] PDF physical p.10 / printed p.8, Digital Planning Evolution |
| F10 | Roughly 36% of engaged couples were using AI for planning by the end of 2025, according to the report. Engaged-couple research wave, not the full 10,474 married-couple base; exact wave count/field dates not provided here. Do not turn this into a harmonized country comparison. | Engaged US couples in the report’s additional research Reported by end of 2025; exact wave dates unavailable Wave-specific n not printed in this report | Original research [S01] PDF physical p.10 / printed p.8, The Growing Use of AI |
| F11 | 61% wrote their own wedding vows. Release reports couples, without an item-specific base. Actual reported behavior differs from hypothetical vow preferences in other surveys. | US couples in The Knot’s research program 2025 weddings; release also summarizes ad hoc research 10,474 main-study couples; specific item bases unavailable | Original research [S02] Key Findings, Gen Z Redefines the Celebration, vow-writing bullet |
| F12 | Reported vendor hiring included a venue (89%), photographer (88%) and caterer (85%). Multiple services can be hired; category rates are not exclusive and do not show vendor prices or conversion rates. | US couples in The Knot’s research program 2025 weddings; release also summarizes ad hoc research 10,474 main-study couples; specific item bases unavailable | Original research [S02] Key Findings, Building the Wedding Dream Team |
For broader relationship context, see MyLittleDesire’s relationship satisfaction, trust and communication statistics. Planning-task allocation alone does not measure relationship satisfaction.
How often does planning begin before engagement?
Zola reports that 19% entered full planning mode before the proposal; 10% toured and 7% booked a venue before engagement. The public report does not provide a linked person-by-person funnel, so the differences cannot be called tour-to-book conversion rates. Zola [S03].
| ID | Finding and essential qualification | Population, period and sample | Source and locator |
|---|---|---|---|
| F13 | 19% entered full planning mode before engagement; the report’s average engagement was 18 months. Planning mode and engagement length are different measures. The 2026 planning cohort is not a completed-wedding census. | Engaged couples in US-facing Zola planning survey Couples preparing for 2026 weddings; exact field dates not printed 11,500+ overall; item, generation and relationship-type bases not published | Original research [S03] 1 in 5 couples enter full planning mode before the proposal |
| F14 | 10% toured a venue and 7% booked one before getting engaged. Separate questions; underlying item routing/counts unavailable. A difference in percentages is not a matched-person funnel. | Engaged couples in US-facing Zola planning survey Couples preparing for 2026 weddings; exact field dates not printed 11,500+ overall; item, generation and relationship-type bases not published | Original research [S03] Pre-proposal section, vendor milestones paragraph |
| F15 | 37% planned an additional event and 18% a two-to-three-day wedding weekend. Related but different questions; an extra event is not automatically a multi-day weekend. Not directly comparable to The Knot’s 71% definition. | Engaged couples in US-facing Zola planning survey Couples preparing for 2026 weddings; exact field dates not printed 11,500+ overall; item, generation and relationship-type bases not published | Original research [S03] Average-cost section, celebration extension bullets |
The Knot’s 71% two-to-three-day celebrations and Zola’s 18% planned wedding weekends have different stages, wording and unavailable routing. Their numerical difference is not evidence that multi-day weddings rose or fell. Additional-event plans also should not be subtracted to create a supposedly separate population.
How are couples using AI, and where do they want people involved?
Zola’s 2026 planning-cohort report gives 54% using AI, while 63% said AI should not write vows. These findings can coexist: planning assistance and personal authorship are different decisions. Zola [S03].
| ID | Finding and essential qualification | Population, period and sample | Source and locator |
|---|---|---|---|
| F16 | 54% used AI in wedding planning; 53% used AI in daily personal or professional life. Different contexts and potentially overlapping respondents; no joint-use rate is inferred. Exact field dates and item counts unavailable. | Engaged couples in US-facing Zola planning survey Couples preparing for 2026 weddings; exact field dates not printed 11,500+ overall; item, generation and relationship-type bases not published | Original research [S03] AI wedding support sees triple-digit growth |
| F17 | 23% were excited to use AI wherever helpful, while 38% preferred specific efficiency tasks with important choices kept human. Selected attitude categories, not the complete distribution; public wording does not establish a universal automation-readiness score. | Engaged couples in US-facing Zola planning survey Couples preparing for 2026 weddings; exact field dates not printed 11,500+ overall; item, generation and relationship-type bases not published | Original research [S03] AI support section, cautious optimism paragraph |
| F18 | 63% said AI should not write vows, 44% rejected it for speeches and 36% for ceremony scripts. Attitudes, not the percentage actually using or avoiding AI. Responses can overlap; achieved item bases not published. | Engaged couples in US-facing Zola planning survey Couples preparing for 2026 weddings; exact field dates not printed 11,500+ overall; item, generation and relationship-type bases not published | Original research [S03] AI support section, emotional boundaries bullets |
The 27-point difference between rejection of AI-written vows and ceremony scripts (C06) describes responses to separate tasks. It does not mean that the remaining people used AI for either. Zola mentions practical uses such as etiquette, timelines and supplier emails, but their percentage denominators are not sufficiently explicit for inclusion here.
The Knot’s approximate 36% engaged-couple use figure, Zola’s 54% use figure and Australia’s 61% positive attitude toward functional AI are not a comparable adoption series. They differ in question, stage, sample and period. No country ranking or growth rate is calculated.
Do Gen Z and Millennials use social media in the same way?
Within Zola’s survey, Gen Z was more likely to plan social-first content, while Millennials were more likely to name Instagram their most essential planning platform. Both differences were 11 percentage points, in opposite directions. The questions measure different things. Zola [S03].
| ID | Finding and essential qualification | Population, period and sample | Source and locator |
|---|---|---|---|
| F19 | 29% of Gen Z planned social-first wedding content, compared with 18% of Millennials. Generation-specific plans, not uploads or national generation estimates; cell counts and definitions not fully supplied. | Engaged couples in US-facing Zola planning survey Couples preparing for 2026 weddings; exact field dates not printed 11,500+ overall; item, generation and relationship-type bases not published | Original research [S03] Couples are increasing budgets to achieve their online vision |
| F20 | Instagram was the most essential planning platform for 8% of Gen Z and 19% of Millennials. A top-platform selection, not any Instagram use. Do not compare it as the same outcome as creating content. | Engaged couples in US-facing Zola planning survey Couples preparing for 2026 weddings; exact field dates not printed 11,500+ overall; item, generation and relationship-type bases not published | Original research [S03] While TikTok trends, Instagram remains a staple |
| F21 | 25% overall and 30% of Gen Z called TikTok their most invaluable planning resource. Most-invaluable resource differs from any inspiration use. Gen Z is included in the overall group; not independent populations. | Engaged couples in US-facing Zola planning survey Couples preparing for 2026 weddings; exact field dates not printed 11,500+ overall; item, generation and relationship-type bases not published | Original research [S03] Half of all couples now get inspiration from TikTok, resource paragraph |
| F22 | 21% planned social-first content; 40% of those couples were asking photographers or videographers to capture it. The 40% is conditional on content planners, not all 11,500+ respondents; do not call it an overall professional-booking rate. | Engaged couples in US-facing Zola planning survey Couples preparing for 2026 weddings; exact field dates not printed 11,500+ overall; item, generation and relationship-type bases not published | Original research [S03] TikTok/social-first section, documentation paragraph |

This comparison separates making content from choosing a planning resource. It does not show that Gen Z uses Instagram less overall. Nor does the 40% professional-capture figure apply to all respondents: it applies to the couples already planning social-first content.
What did couples say about planning together?
| ID | Finding and essential qualification | Population, period and sample | Source and locator |
|---|---|---|---|
| F23 | 44% said planning had brought them closer, while 40% said their relationship stayed steady and loving. Self-reported appraisal, not a controlled effect of planning or evidence that every couple improves; other responses not inferred. | Engaged couples in US-facing Zola planning survey Couples preparing for 2026 weddings; exact field dates not printed 11,500+ overall; item, generation and relationship-type bases not published | Original research [S03] Couples are prioritizing mental wellbeing, and relationship health |
| F24 | Equal planning was reported by 13% of opposite-sex couples and 29% of same-sex couples. Relationship-type subgroups, with achieved counts unavailable. Equal planning prevalence is different from The Knot’s shares of tasks. | Engaged couples in US-facing Zola planning survey Couples preparing for 2026 weddings; exact field dates not printed 11,500+ overall; item, generation and relationship-type bases not published | Original research [S03] Relationship-health section, planning-load paragraph |
The 16-point equal-planning difference by relationship type (C09) has unpublished subgroup counts. It should not be interpreted as a causal effect of relationship type or as the same measure as The Knot’s task-share allocation.
What do UK research and early 2027 bookings show?
Bridebook’s public report combines a 2025 wedding overview with separate forward-booking indicators. Its 28% barn figure for 2027 concerns bookings to date, rather than completed 2027 weddings or a final market share. The snapshot date and year-specific sample sizes are not published in the public summary. Bridebook [S04].
| ID | Finding and essential qualification | Population, period and sample | Source and locator |
|---|---|---|---|
| F25 | Average engagement length was 23.8 months; 68% were under 24 months. Mixed married/engaged survey overall; the achieved duration base is not published. Not directly harmonized with other countries’ samples. | UK married and engaged couples in Bridebook survey 2025 wedding overview; separate 2026 and early 2027 booking figures 7,000+ overall; planning, booking-year and item bases undisclosed | Original research [S04] Data Deep Dive, 2025 weddings at a glance, Engagement |
| F26 | 47% of weddings were on Saturdays, 27% Monday–Thursday and 17% Friday. Selected categories only; do not invent the omitted category from a remainder or use these as 2027 outcomes. | UK married and engaged couples in Bridebook survey 2025 wedding overview; separate 2026 and early 2027 booking figures 7,000+ overall; planning, booking-year and item bases undisclosed | Original research [S04] 2025 weddings at a glance, Day of Week |
| F27 | 22% considered one venue type only; 25% considered castles while 4% booked them. Consideration and booking may use different stages/bases; do not calculate castle conversion as 4/25 or a matched abandonment rate. | UK married and engaged couples in Bridebook survey 2025 wedding overview; separate 2026 and early 2027 booking figures 7,000+ overall; planning, booking-year and item bases undisclosed | Original research [S04] Venue Trends, Barns lead the way |
| F28 | Barns hosted 21% of 2025 weddings, compared with 23% for 2026 and 28% of bookings to date for 2027 in the summary. Different completion/booking cohorts. Exact snapshot date, answering counts and scope of 2026 percentage not given; no final-year share or market-wide forecast. | UK married and engaged couples in Bridebook survey 2025 wedding overview; separate 2026 and early 2027 booking figures 7,000+ overall; planning, booking-year and item bases undisclosed | Original research [S04] Venue Trends, Barns in 2026, accompanying text |
| F29 | 79% booked within four weeks of first contact and 92% within two months. Cumulative booking measures; not mutually exclusive shares. Base/cutoff definitions are not fully published; two months is not assumed to equal exactly eight weeks. | UK married and engaged couples in Bridebook survey 2025 wedding overview; separate 2026 and early 2027 booking figures 7,000+ overall; planning, booking-year and item bases undisclosed | Original research [S04] Booking Behavior, Booking Speed, 2025 |
| F30 | 83% made a sustainable effort in at least one element; 23% included second-hand or vintage details. Broad effort and a specific practice are different measures; no intersection or individual adoption path is inferred. | UK married and engaged couples in Bridebook survey 2025 wedding overview; separate 2026 and early 2027 booking figures 7,000+ overall; planning, booking-year and item bases undisclosed | Original research [S04] What’s Trending, Sustainability and second-hand touches |
| F31 | 14% married outside their home region in 2025, compared with 22% in 2024. As summarized within the current report; historical comparison’s full sampling details unavailable. Region crossing is not a destination-country wedding. | UK married and engaged couples in Bridebook survey 2025 wedding overview; separate 2026 and early 2027 booking figures 7,000+ overall; planning, booking-year and item bases undisclosed | Original research [S04] Regional breakdown, Where couples travel to marry |
| F32 | The guest panel reports 74 at the ceremony and 21 additional evening guests on average. The same panel headlines 80 guests without reconciling its bases. Use the named components separately; do not sum means into an invented single national guest count. | UK married and engaged couples in Bridebook survey 2025 wedding overview; separate 2026 and early 2027 booking figures 7,000+ overall; planning, booking-year and item bases undisclosed | Original research [S04] 2025 weddings at a glance, Guest Count detail |
The 79% booking within four weeks and 92% within two months are cumulative thresholds. Their 13-point difference (C10) describes the additional reported share between the cutoffs; calendar months are not forced to mean exactly eight weeks. It is not a 13% venue conversion rate.
Considering a castle and booking one also use different stages and potentially different bases. Dividing 4 by 25 would not establish a matched conversion rate. Similarly, the guest panel’s 74 ceremony guests and 21 additional evening guests should not simply be added or reconciled to the unexplained 80-guest headline.
What matters in Australian supplier selection and AI trust?
Easy Weddings’ public 2026 analysis reports positive feelings about functional AI alongside a preference for human trust and connection. Willingness to try a tool and trust in its recommendations are separate dimensions. Easy Weddings [S05]; Easy Weddings [S06].
| ID | Finding and essential qualification | Population, period and sample | Source and locator |
|---|---|---|---|
| F33 | 61% were happy to use AI for functional wedding-planning tasks. An attitude/willingness measure, not observed AI adoption. Do not rank it against Zola’s 54% use rate. | Australian engaged/recently married couples in annual survey 2026 annual report; exact field dates/stage split unavailable Companion original cost guide reports 4,000+ overall; item counts not supplied | Original research [S05] The Human Premium: AI isn’t replacing humans |
| F34 | 54% trusted AI recommendations less than human ones; 12% did not trust AI recommendations at all. Public summary does not provide complete response options or routing. Keep categories separate; do not assume whether they overlap or compute trust from the 61% positive figure. | Australian engaged/recently married couples in annual survey 2026 annual report; exact field dates/stage split unavailable Companion original cost guide reports 4,000+ overall; item counts not supplied | Original research [S05] The Human Premium, trust paragraph |
| F35 | 31% cited reviews as their primary way of sourcing and vetting suppliers. A primary-route measure, not any review use or evidence that reviews cause a booking. | Australian engaged/recently married couples in annual survey 2026 annual report; exact field dates/stage split unavailable Companion original cost guide reports 4,000+ overall; item counts not supplied | Original research [S05] Trust is a currency |
| F36 | The publisher reports that 53% of venue tours converted to bookings. Tour/supplier denominator and sampling are not supplied. Treat as a publisher-reported platform figure, not a general conversion benchmark for every venue. | Australian engaged/recently married couples in annual survey 2026 annual report; exact field dates/stage split unavailable Companion original cost guide reports 4,000+ overall; item counts not supplied | Original research [S05] The venue is the anchor |
| F37 | 88% booked based on trust and personal connection, according to the report summary. Question wording, priority/routing and achieved base unavailable; not an experimental effect of building trust. | Australian couples in Easy Weddings annual program 2026 report; recently married and engaged survey; exact dates unavailable 4,000+ overall reported by companion guide; item n unavailable | Original research [S06] Trust is the new currency |
| F38 | The companion analysis gives an 85-guest average. Mixed-stage report, with full guest definition/base not published. Do not treat it as directly comparable with Bridebook’s ceremony count or a measured 2027 total. | Australian couples in Easy Weddings annual program 2026 report; recently married and engaged survey; exact dates unavailable 4,000+ overall reported by companion guide; item n unavailable | Original research [S06] The Quality Over Quantity shift |
The public articles do not supply the full trust-response routing or venue-tour denominator. The 54% trusting AI less and 12% not trusting it at all are therefore kept as reported categories rather than added into a new distrust total. The 53% tour-to-booking figure is a publisher-reported measure with an incomplete public base, rather than a universal venue benchmark.
What would UK adults choose if planning a wedding now?
YouGov’s August 2026 preference questions used a filtered unweighted base of 1,200 people who had married or wanted to marry; the weighted base was 1,206. They describe hypothetical choices. They are not all 1,784 respondents, actual supplier purchases or measured 2027 behavior. YouGov [S07].
| ID | Finding and essential qualification | Population, period and sample | Source and locator |
|---|---|---|---|
| F39 | 62% preferred a smaller wedding, 22% a larger one and 12% a private registry-office ceremony; 4% were unsure. Qualitative size descriptions, not fixed guest-number bands or actual booked events. | UK adults who have been married or wish to marry; hypothetical choices now 2026-08-07 to 2026-08-09 Unweighted n=1,200; weighted base=1,206; full survey n=1,784 | Original research [S07] PDF physical p.15, GuestNos, Total column |
| F40 | Preferred seasons were spring 32%, summer 31%, autumn 20% and winter 6%; 11% were unsure. A stated preference among the filtered group, not the seasonal distribution of marriages. | UK adults who have been married or wish to marry; hypothetical choices now 2026-08-07 to 2026-08-09 Unweighted n=1,200; weighted base=1,206; full survey n=1,784 | Original research [S07] PDF physical p.15, WeddingSeason, Total column |
| F41 | First-choice venues included a religious building 20%, country house 20%, registry office 17%, hotel 10%, beach 9% and marquee/outdoor 7%. Selected categories; 8% selected another venue and 9% did not know. Venue type is not identical to ceremony type. | UK adults who have been married or wish to marry; hypothetical choices now 2026-08-07 to 2026-08-09 Unweighted n=1,200; weighted base=1,206; full survey n=1,784 | Original research [S07] PDF physical p.20, WeddingType, Total column |
| F42 | 74% would hire a photographer, 36% someone to film the wedding and 15% a wedding planner. Separate yes/no items with a common reported base; people may choose several services. Not supplier booking or conversion rates. | UK adults who have been married or wish to marry; hypothetical choices now 2026-08-07 to 2026-08-09 Unweighted n=1,200; weighted base=1,206; full survey n=1,784 | Original research [S07] PDF physical p.16, WeddingPref_2–4, I would, Total column |
| F43 | 47% would write their own vows and 33% would have a religious ceremony. Separate non-exclusive choices. Own-written vows and religious ceremony are not opposite categories. | UK adults who have been married or wish to marry; hypothetical choices now 2026-08-07 to 2026-08-09 Unweighted n=1,200; weighted base=1,206; full survey n=1,784 | Original research [S07] PDF physical pp.16–17, WeddingPref_1 and _8, I would |
| F44 | 85% would jointly cut a cake, 74% have a first dance and 60% have guests throw confetti. Hypothetical practices, with overlapping responses; no claim these are their 2027 plans. | UK adults who have been married or wish to marry; hypothetical choices now 2026-08-07 to 2026-08-09 Unweighted n=1,200; weighted base=1,206; full survey n=1,784 | Original research [S07] PDF physical p.18, WeddingPref_10–12, I would |
| F45 | 36% would make a gift list/registry, 48% would not and 16% were unsure. Hypothetical registry interest, not measured registry use. Not comparable as a country gap against The Knot’s US 82% adoption. | UK adults who have been married or wish to marry; hypothetical choices now 2026-08-07 to 2026-08-09 Unweighted n=1,200; weighted base=1,206; full survey n=1,784 | Original research [S07] PDF physical p.17, WeddingPref_7, Total column |
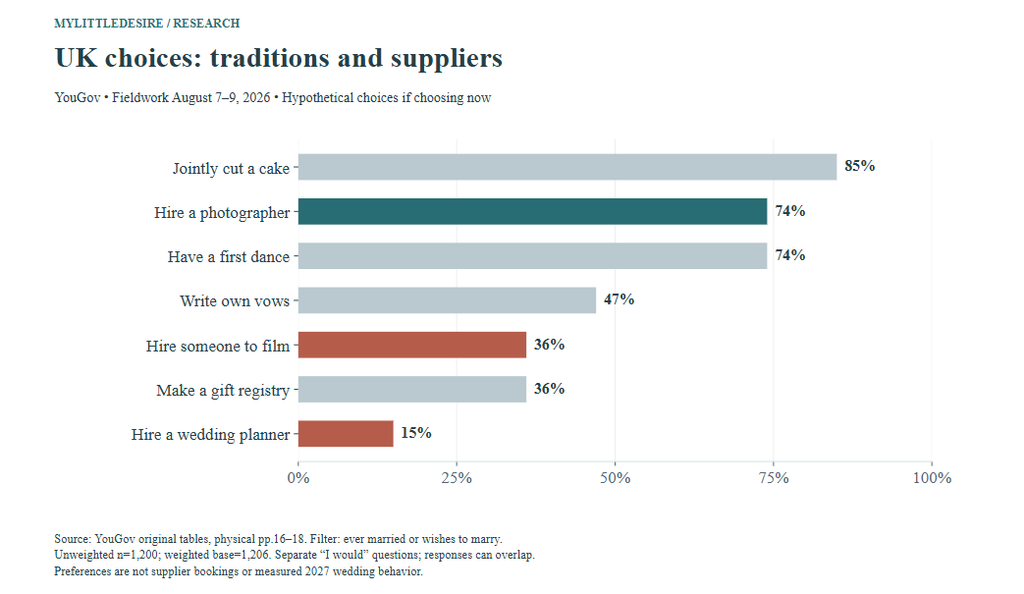
Photographer preference exceeded filming by 38 percentage points and planner preference by 59 points (C14–C15). Each was a separate “I would” question. The differences do not count people who wanted photography without another service. Traditions and personalized choices can also coexist in the same hypothetical wedding.
Who must be invited, and which extra events would people choose?
The guest-obligation questions below return to the full UK adult base of 1,784. They should not be silently treated as the filtered planning group.
| ID | Finding and essential qualification | Population, period and sample | Source and locator |
|---|---|---|---|
| F46 | 51% thought couples must invite close family, 20% wider family and 11% closest colleagues. Public opinions about obligations; different base from the filtered planning-preference questions. | All UK adults age 18+ 2026-08-07 to 2026-08-09 Unweighted n=1,784; weighted base=1,784 | Original research [S07] PDF physical pp.13–14, Guests_1, _2, _7, obligation response |
| F47 | 22% would have a destination wedding, 14% a themed wedding, 27% a rehearsal and 12% a rehearsal dinner. Distinct format choices, not one distribution. Rehearsal and rehearsal dinner are different questions. | UK adults who have been married or wish to marry; hypothetical choices now 2026-08-07 to 2026-08-09 Unweighted n=1,200; weighted base=1,206; full survey n=1,784 | Original research [S07] PDF physical pp.17 and 19, WeddingPref_5, _15, _16, _17, I would |
| F48 | Reception-music choices were a DJ 40%, live band 29%, other 7%, unsure 15% and no reception 10%. Rounded categories total 101%; not an error to silently normalize. A preferred music option is not a booked performance. | UK adults who have been married or wish to marry; hypothetical choices now 2026-08-07 to 2026-08-09 Unweighted n=1,200; weighted base=1,206; full survey n=1,784 | Original research [S07] PDF physical p.21, WeddingBand, Total column |
How much of a Canadian wedding “yes” is only “maybe”?
For down-payment gifts, the published 79% yes NET combines 37% definitely and 42% maybe. About 53.2% of that NET is therefore tentative (C17). The original question includes people planning their own wedding or knowing someone planning one. It is not a forecast that 79% of Canadian couples will request cash. Royal LePage / Burson / Leger Opinion [S08].
| ID | Finding and essential qualification | Population, period and sample | Source and locator |
|---|---|---|---|
| F49 | For down-payment gifts, 37% said definitely and 42% maybe; the published yes NET was 79%. Conditional on own or someone else’s wedding planning. “Maybe” is not a firm registry plan; overall adult n is not this item’s denominator. | Canadian respondents planning a wedding or knowing someone planning one 2026-03-27 to 2026-04-15 Overall n=1,717; achieved filtered item base not disclosed | Original research [S08] PDF physical p.1, first question, National Total |
| F50 | 46% would definitely forgo or scale back a wedding for a down payment, 36% maybe; the published yes NET was 82%. Same prospective eligibility filter as gift question; hypothetical willingness, not the share who have cancelled or downsized weddings. | Canadian respondents planning a wedding or knowing someone planning one 2026-03-27 to 2026-04-15 Overall n=1,717; achieved filtered item base not disclosed | Original research [S08] PDF physical p.1, third question, National Total |
| F51 | Among married respondents, 57% would have liked to request down-payment money, while 10% said they did request money for their wedding. Retrospective counterfactual versus separate actual-request response. Public options do not identify the exact purpose of every past cash request. | Married Canadian survey respondents 2026-03-27 to 2026-04-15 Overall n=1,717; married item base not disclosed | Original research [S08] PDF physical p.1, second question, National Total |
| F52 | 55% of married respondents would have forgone or reduced their wedding for a home down payment: 30% definitely and 25% maybe. A counterfactual looking back at their own wedding, not an observed reduction or matched trend from prospective respondents. | Married Canadian survey respondents 2026-03-27 to 2026-04-15 Overall n=1,717; married item base not disclosed | Original research [S08] PDF physical p.1, fourth question, National Total |
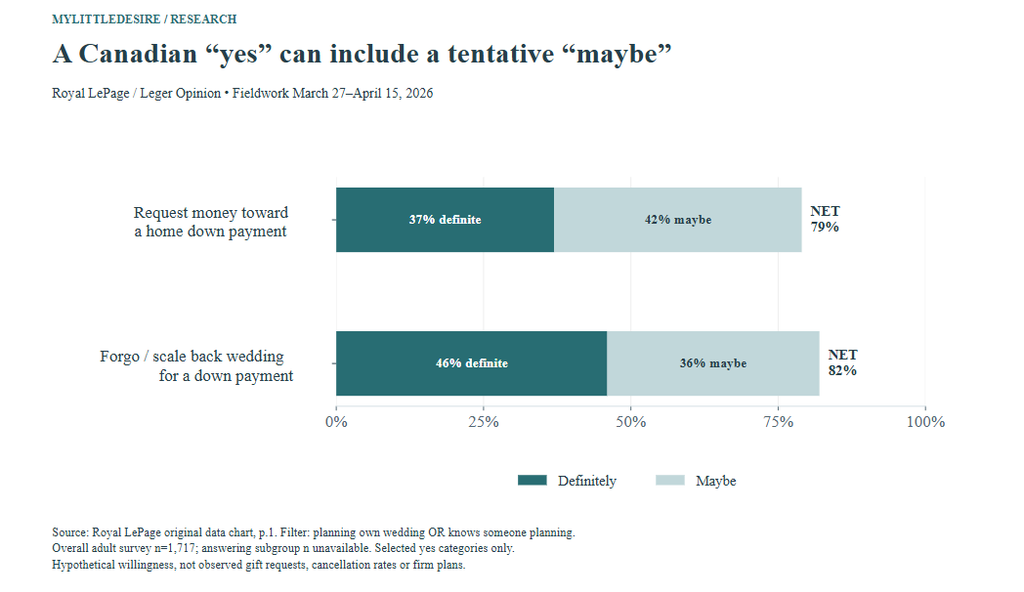
The same distinction applies to the 82% NET willing to forgo or scale back a wedding for a down payment. “Maybe” contributes approximately 43.9% of that NET (C18). Willingness does not measure observed cancellation or downsizing. Questions for married respondents are retrospective counterfactuals; the separate 10% who said they requested money should not be turned into a trend or a measure of missed opportunity.
What does US Gen Z wedding research say about wedding culture?
Affirm/Talker respondents favored personal details and smaller celebrations while reporting pressure around wedding culture. The May 2026 study surveyed 2,000 US Gen Z adults aged 22 and older. Its findings do not cover every Gen Z age or compare generations. Affirm / Talker Research [S09].
| ID | Finding and essential qualification | Population, period and sample | Source and locator |
|---|---|---|---|
| F53 | 69% said weddings feel more like productions; 75% felt wedding culture pressures unwanted spending. Opinions of sampled Gen Z adults age 22+, not observed behavior of all engaged couples or all young adults. | US Gen Z adults aged 22+ with internet access; some items unmarried-only 2026-05-07 to 2026-05-13 2,000 overall; unmarried and other conditional item n not supplied | Original research [S09] Opening findings, wedding culture paragraph |
| F54 | 44% considered one night the ideal length for a bachelor or bachelorette trip. A preference about a pre-wedding trip, not the length of the wedding or an observed booking. | US Gen Z adults aged 22+ with internet access; some items unmarried-only 2026-05-07 to 2026-05-13 2,000 overall; unmarried and other conditional item n not supplied | Original research [S09] Travel paragraph, ideal bachelor/bachelorette trip |
| F55 | 40% of unmarried participants wanted a smaller intimate ceremony and 19% a large wedding. Unmarried-only answering base not supplied; size definitions differ from YouGov’s. Do not pool into a Gen Z or international small-wedding rate. | Unmarried US Gen Z participants age 22+ 2026-05-07 to 2026-05-13 2,000 overall; unmarried subgroup n not supplied | Original research [S09] Less spectacle, more meaning, dream-wedding paragraph |
| F56 | Favored trends included personalized details 31%, budget-conscious/DIY elements 30% and smaller guest lists 29%. Preference responses, with full routing/selection method not published; no claim that the percentages describe adopted wedding features. | US Gen Z adults aged 22+ with internet access; some items unmarried-only 2026-05-07 to 2026-05-13 2,000 overall; unmarried and other conditional item n not supplied | Original research [S09] Less spectacle, more meaning, preferences sentence |
The unmarried-only size preferences have an unpublished subgroup count. The one-night trip preference concerns bachelor or bachelorette travel, rather than the length of a wedding celebration. Sponsor research is retained with its public-method limitations; no financing product recommendation is adopted.
Which 2027 wedding trends have measurable early signals?
The Knot’s September 28, 2026 forecast reports rising on-site interest in several styles, using signals from January–June 2026. Its forecast also incorporates existing research, editorial judgment and vendor review. The stated 1.7-million-couple footprint is not a 1.7-million-person survey sample. The Knot / The Knot Worldwide [S10].
| ID | Finding and essential qualification | Population, period and sample | Source and locator |
|---|---|---|---|
| F57 | The publisher reports year-over-year search increases of 315% for coastal Italian beach-club weddings and 167% for Italian-themed suites. Relative growth within a commercial platform ecosystem; no absolute volumes or adoption shares supplied. Signals analyzed January–June 2026, supporting a 2027 forecast. | US users/couples in The Knot marketplace, websites, paper and registry ecosystem On-site signals January–June 2026; source calls changes year-over-year; exact comparator/extraction details not fully supplied Publisher states footprint of 1.7 million US couples; not a 1.7-million-person opinion survey | Original research [S10] Opening top findings, beach-club and Italian suites |
| F58 | Reported search growth was 280% for antique-lace/Victorian themes, 195% for fine-art inspiration and 106% for balletcore/Swan Lake styling. Relative changes for different query categories, not shares choosing each style; no national fashion ranking or verified 2027 outcome. | US users/couples in The Knot marketplace, websites, paper and registry ecosystem On-site signals January–June 2026; source calls changes year-over-year; exact comparator/extraction details not fully supplied Publisher states footprint of 1.7 million US couples; not a 1.7-million-person opinion survey | Original research [S10] Key Findings, Couples as Creative Directors |
| F59 | Searches for wedding brands/crests/monograms rose 100%, interactive food/drink 66% and experiential stationery 77%. Search interest is different from purchase, use, or prevalence. Different absolute baselines are unknown; one cannot infer which category has more total searches. | US users/couples in The Knot marketplace, websites, paper and registry ecosystem On-site signals January–June 2026; source calls changes year-over-year; exact comparator/extraction details not fully supplied Publisher states footprint of 1.7 million US couples; not a 1.7-million-person opinion survey | Original research [S10] Key Findings, Creative Directors and Hospitality at its Highest |
| F60 | Searches for silver flatware, platinum jewelry and cool-toned decor rose 133% year-over-year. A grouped search signal in the publisher’s forecast, not proof that silver has replaced gold in wedding purchases. | US users/couples in The Knot marketplace, websites, paper and registry ecosystem On-site signals January–June 2026; source calls changes year-over-year; exact comparator/extraction details not fully supplied Publisher states footprint of 1.7 million US couples; not a 1.7-million-person opinion survey | Original research [S10] Key Findings, The Silver (Ag)e |
A 315% increase describes relative growth from an undisclosed starting search count. It does not mean 315% of weddings, establish absolute demand or prove that the style will dominate 2027. The original report does not publish enough query definitions, raw counts or comparator details to reproduce those search-growth estimates independently.
The useful contribution here is to keep the evidence ladder visible: a search signal can motivate a forecast; a forecast is not an adopted booking; an early booking is not a completed full-year outcome. The reported 2027 barn indicator and these style signals belong in separate categories.
What comparisons does MyLittleDesire contribute?
The contribution is a convenient synthesis with transparent arithmetic and denominators. Some differences are already evident in, or discussed by, the original research. These are 20 reproducible descriptive calculations, rather than 20 new scientific discoveries or original fieldwork.
| ID | Comparison | Result | Expression using downloadable input IDs | Qualification and sources |
|---|---|---|---|---|
| C01 | Primary minus other partner’s task share | 47.0 percentage points | k_primary-k_other | Approximate task shares, not share of couples or difference in hours. The Knot / The Knot Worldwide [S01] |
| C02 | Primary-to-other partner task-share ratio | Approximately 3.76× | k_primary/k_other | Ratio of rounded task shares. Not a ratio of planning time or a gender comparison. The Knot / The Knot Worldwide [S01] |
| C03 | Remaining task share after the two partners | 19 % of tasks | 100-k_primary-k_other | Approximate remainder of reported shares, assigned by the source to support networks; not a new observed response. The Knot / The Knot Worldwide [S01] |
| C04 | Pre-proposal planning minus pre-proposal venue booking | 12.0 percentage points | z_preplan-z_prebook | Separate questions; not a measured matched-person drop-off or an unbooked-planner count. Zola [S03] |
| C05 | Additional-event minus multi-day-weekend plans | 19.0 percentage points | z_extra-z_weekend | Different overlapping concepts. Not the percentage having only one extra event or skipping a weekend. Zola [S03] |
| C06 | Reject AI vows minus reject AI ceremony script | 27.0 percentage points | z_no_vows-z_no_script | Attitude difference across two non-exclusive questions; no individual intersection or significance claim. Zola [S03] |
| C07 | Gen Z minus Millennial social-first content plans | 11.0 percentage points | z_genz_create-z_mill_create | Generation-specific intentions in one survey; cells unsized, no statistical significance test. Zola [S03] |
| C08 | Millennial minus Gen Z Instagram top-platform preference | 11.0 percentage points | z_mill_instagram-z_genz_instagram | Most-essential platform, not any platform use or content creation. Zola [S03] |
| C09 | Same-sex minus opposite-sex equal-planning reports | 16.0 percentage points | z_same_equal-z_opp_equal | Relationship subgroups with unpublished counts; descriptive difference, not causation. Zola [S03] |
| C10 | Additional cumulative venue bookings between source cutoffs | 13.0 percentage points | b_book2m-b_book4w | 92% within two months minus 79% within four weeks. Calendar months are not forced to equal eight weeks; full base unknown. Bridebook [S04] |
| C11 | Any sustainable effort minus second-hand/vintage practice | 60.0 percentage points | b_sustainable-b_secondhand | Broad versus specific practice; not a verified share who act sustainably without using second-hand items. Bridebook [S04] |
| C12 | Change in outside-home-region weddings, 2025 minus 2024 | -8.0 percentage points | b_out25-b_out24 | Two annual samples summarized in the current report; no causal attribution or destination-country inference. Bridebook [S04] |
| C13 | UK smaller minus larger wedding preference | 40.0 percentage points | y_small-y_large | Same single-choice hypothetical size question, filtered n=1,200; not observed guest-count distribution. YouGov [S07] |
| C14 | UK photographer minus film preference | 38.0 percentage points | y_photo-y_film | Same published filtered base, separate yes/no service questions; not the share hiring a photographer only. YouGov [S07] |
| C15 | UK photographer minus planner preference | 59.0 percentage points | y_photo-y_planner | Separate hypothetical service questions; not a booking conversion rate. YouGov [S07] |
| C16 | UK DJ minus live-band preference | 11.0 percentage points | y_dj-y_band | Same single-choice hypothetical music question; rounded responses, not supplier bookings. YouGov [S07] |
| C17 | Canada maybe share within down-payment-gift yes NET | Approximately 53.2% | c_cash_maybe/c_cash_net*100 | 42/79 of the rounded yes NET is tentative. Conditional survey group includes people knowing a planner; not firm plans. Royal LePage / Burson / Leger Opinion [S08] |
| C18 | Canada maybe share within scale-back yes NET | Approximately 43.9% | c_scale_maybe/c_scale_net*100 | 36/82 from rounded reported categories. Willingness, not observed downsizing. Royal LePage / Burson / Leger Opinion [S08] |
| C19 | Canada definite scale-back minus definite cash-gift preference | 9.0 percentage points | c_scale_def-c_cash_def | Two separate questions with the same stated eligibility; no individual joint-response inference. Royal LePage / Burson / Leger Opinion [S08] |
| C20 | Canada retrospective cash wish minus actual cash-request response | 47.0 percentage points | c_past_cash_wish-c_past_cash_actual | 57% retrospective yes NET versus separate 10% did-request response; not measured lost opportunity or a time trend. Royal LePage / Burson / Leger Opinion [S08] |
What cannot be concluded from these statistics?
- There is no verified completed full-year 2027 planning result or harmonized international adoption ranking here.
- Completed weddings, current plans, hypothetical preferences, forward bookings and platform signals are not interchangeable.
- Tasks, hours, activity shares and percentages of respondents are different units. Nonexclusive responses need not sum to 100%.
- Commercial-platform members, client panels and opt-in respondents do not automatically represent every couple. Overall sample sizes are not subgroup counts.
- Differences between questions do not establish individual overlap, matched conversions, causal effects or statistical significance.
- Search growth with undisclosed raw volumes is not measured search demand for this article’s keywords or proof of future wedding adoption.
- Several studies share commercial interests or publishers. Separate source records and programs are not independent replications.
How were the findings selected and verified?
Original reports, research tables and publisher releases were checked by October 24, 2026. Each finding records the value, units, actual period, population, sample-size availability, method, source locator and caveats. Verification means checking what the source reports; it does not audit respondents or independently reproduce the fieldwork. Related response categories remain grouped, and repeated documents from the same program are identified.
The Knot planning and digital/AI pages, YouGov’s original UK cross-tabs and Royal LePage’s original data chart were checked directly, including the printed bases and question filters. Bridebook and Easy Weddings findings use public summaries; their contact-form reports were not obtained. Affirm’s sponsor article was read through public web retrieval after a separate direct fetch returned an unavailable-content placeholder. Unknown field dates, routing, weights and item counts remain labelled as unknown.
Seven programs supply survey findings; one supplies platform signals and an editorial forecast. Ten source records do not mean ten independent studies. The Knot’s two survey documents share a program, as do the two Easy Weddings articles. The Knot’s survey and forecast share a publisher. Generation and relationship-type comparisons lack published cell counts. No new significance tests, pooled prevalence estimate or causal model is introduced.
MyLittleDesire’s calculations use named source inputs and rounded, readable precision. The charts are original designs built from third-party data, with sources, periods and limitations attached. Changing the editable workbook does not automatically rebuild static PNG, SVG or HTML files. Review and rebuild them together before publication.
Research downloads: 60 grouped findings · 138 numeric inputs · 20 calculations · Editable workbook · Public data and chart pack. Relative links work after extracting the complete package. Use actual uploaded media URLs on WordPress.
Complete original sources
- S01 · The Knot / The Knot Worldwide. The Knot Real Weddings Study 2026 — Data Read-Out. Published: Release 2026-02-18; PDF day not separately printed. Actual period: 2025 weddings; report includes additional engaged-couple research. Sample: 10,474 married couples in main study; item/ad hoc bases not fully published. Method: Retrospective membership survey recruited by email; ad hoc engaged-couple research also included. Limitations: Main sample is not every US marriage. Item n is often absent. Shares of tasks, activity, respondents and event types are different measures. AI figures concern an engaged-couple wave, not all 10,474 newlyweds.
- S02 · The Knot / The Knot Worldwide. The Knot Worldwide Unveils 2026 Real Wedding Study. Published: 2026-02-18. Actual period: 2025 weddings; release also summarizes ad hoc research. Sample: 10,474 main-study couples; specific item bases unavailable. Method: Original publisher release accompanying S01. Limitations: Same program as S01, not independent confirmation. Selected hiring and vow-writing results are reported without subgroup bases.
- S03 · Zola. 2026 Wedding Trends: Zola’s First Look Report. Published: Updated 2026-10-16; original publication day unconfirmed. Actual period: Couples preparing for 2026 weddings; exact field dates not printed. Sample: 11,500+ overall; item, generation and relationship-type bases not published. Method: Publisher survey of engaged couples; public article lacks full recruitment/weighting details. Limitations: Plans, self-reported current behavior and hypothetical views differ. No national probability inference. AI task percentages with unclear routing are excluded. Generation comparisons have no published cell counts.
- S04 · Bridebook. The UK Wedding Report 2026 — public summary. Published: 2026 report; exact public-page publication/update day unavailable. Actual period: 2025 wedding overview; separate 2026 and early 2027 booking figures. Sample: 7,000+ overall; planning, booking-year and item bases undisclosed. Method: Commercial platform survey; public summary with full report behind contact form. Limitations: No contact form submitted. Mixed stages and cohort definitions; full weights/field dates not public. 2027 bookings-to-date are incomplete forward bookings, not final 2027 market share.
- S05 · Easy Weddings. 2026 wedding industry: Why rising budgets and “human first” values are your biggest opportunity. Published: Updated 2026-02-18. Actual period: 2026 annual report; exact field dates/stage split unavailable. Sample: Companion original cost guide reports 4,000+ overall; item counts not supplied. Method: Original public industry analysis; full survey offered through contact form. Limitations: Full weighting, item routing and denominator for tour conversion absent. Positive feelings about AI do not measure actual AI use or trust.
- S06 · Easy Weddings. The 2026 wedding budget pivot: couples are spending more on expertise. Published: Updated 2026-02-26. Actual period: 2026 report; recently married and engaged survey; exact dates unavailable. Sample: 4,000+ overall reported by companion guide; item n unavailable. Method: Original publisher’s companion analysis. Limitations: Same program as S05. Trust/connection statement and guest mean are reported without full questionnaire or achieved item bases. Cost figures intentionally remain in the separate Cost & Budget Hub.
- S07 · YouGov. Big Survey: Weddings — UK18 results, August 7–9, 2026. Published: Companion articles published 2026-08-27. Actual period: 2026-08-07 to 2026-08-09. Sample: 1,784 overall. Planning-preference unweighted n=1,200; weighted base=1,206. Guest-obligation items n=1,784.. Method: Public original weighted cross-tab tables; achieved and weighted bases printed per question. Limitations: Preferences if choosing a wedding now, not bookings or measured 2027 behavior. Full poll-specific recruitment/weighting variables not detailed in table. Totals may differ from 100% due to rounding.
- S08 · Royal LePage / Burson / Leger Opinion. Royal LePage 2026 Survey: Rings vs Real Estate — Data Chart. Published: Released 2026-05-21. Actual period: 2026-03-27 to 2026-04-15. Sample: 1,717 overall; item/conditional subgroup counts not published. Method: Leger Opinion nonprobability web panel, regional oversamples, weighting by age/gender within regions/cities using 2021 census. Limitations: Overall n is not the answering base of each question. Definite and maybe responses are not firm plans. Married respondents’ counterfactual wishes are not actual past actions. Published NETs may differ from sums of rounded components.
- S09 · Affirm / Talker Research. Why Gen Z is ditching performative weddings. Published: 2026-06-15. Actual period: 2026-05-07 to 2026-05-13. Sample: 2,000 overall; unmarried and other conditional item n not supplied. Method: Sponsor describes random double-opt-in online survey by Talker Research; public weighting not supplied. Limitations: Not all generations or all Gen Z ages. An opt-in survey is not established as a national probability sample. Opinions/preferences are not observed wedding choices. No financial product recommendation is adopted.
- S10 · The Knot / The Knot Worldwide. The Knot 2027 Wedding Trends Report: Couples Embrace Italian Beach Clubs, The Silver Age, and Maximizing Every Moment. Published: 2026-09-28. Actual period: On-site signals January–June 2026; source calls changes year-over-year; exact comparator/extraction details not fully supplied. Sample: Publisher states footprint of 1.7 million US couples; not a 1.7-million-person opinion survey. Method: Search/save/spend signals combined with editorial filters and vendor-council review; underlying existing research also used. Limitations: Relative search growth is not share of weddings, absolute search volume or proof of realized 2027 adoption. Query definitions, raw counts and complete comparator window not public. Forecast narratives remain forecasts.
How to cite this research resource
For this compilation or a MyLittleDesire chart/calculation, cite this resource and the underlying original study. For an individual survey result, also consult and cite that study directly.
Suggested citation after publication: MyLittleDesire. Wedding Planning Trends & Statistics 2027: AI, Timing and Couples’ Choices. 2027 planning edition; sources reviewed October 24, 2026. https://mylittledesire.com/wedding-planning-statistics/. Add the actual access date where your citation style requires it.