
Stepfamilies are measured in several ways: through a child’s home, a couple’s parenting history or an adult’s wider family network. This resource organizes 55 grouped source findings, four charts and 20 reproducible calculations about family composition, prior children, household finances and connections across homes. Original sources and their actual data years accompany the findings.
What is a stepfamily or blended family?
There is no single denominator that makes all the figures below interchangeable. A child can live with a half sibling and both of their own parents; an adult can have a stepchild who lives elsewhere; and an official “blended” category can be narrower than everyday usage.
| Source framework | Population measured | Meaning and important restriction |
|---|---|---|
| US, Pew/SIPP | Children under 18; separate household and support analyses | Blended includes a resident stepparent, stepsibling and/or half sibling. Relationships outside the child’s usual home are not comprehensively counted. Pew Research Center; Jake Hays [S01] |
| US, NCFMR/NSFG | Partnered respondents or recent first-marriage entrants, with specified ages | Prior children can live elsewhere. A respondent’s first marriage can form a stepfamily even if the partner married before. National Center for Family & Marriage Research; Karen B. Guzzo [S07]; National Center for Family & Marriage Research; Lisa Carlson [S13] |
| England and Wales, ONS | Families and dependent children; some analyses use households | Step-family can include a lone-parent family with step relationships. A blended family contains both a shared child and a stepchild; identification is restricted to households of five or fewer. Office for National Statistics [S02] |
| Canada, census | Couple families with children of any age; separate child measures for ages 0–14 | Simple/complex describe parent–child and sibling composition. These are technical labels, not ratings of family functioning. Statistics Canada [S04]; Statistics Canada [S05] |
| Australia, ABS/AIFS | Couple families with dependent children; separate child-age base | Step and blended are distinct categories: blended requires a child shared by the couple as well as a stepchild. Known 2021 classification error must be disclosed. Australian Institute of Family Studies; analysis of ABS Census [S09]; Australian Bureau of Statistics [S10] |
| Historical US adult survey | Adults aged 18+ with any step relative | Includes an adult’s stepparent, step/half sibling or stepchild, often outside the household. Pew Research Center [S11] |
What are the key findings?
Each figure below belongs to its named population and period. Keep those qualifications when quoting it.
17%
50%
US children under 18 living in blended families in December 2023, under Pew’s sibling-inclusive definition. Original source [S01]
Of US children in blended families lived with a half sibling and no stepparent, in 2023. Original source [S01]
66%
8.8%
Of US children living with a parent and stepparent lived with a couple married to each other, in 2023. Original source [S01]
Dependent children living in step-families in England and Wales, Census 2021. Original source [S02]
51.6%
65.2%
Blended share of E&W step-families with dependent children in households of five people or fewer, 2021. Original source [S02]
Canadian children aged 0–14 in step-families who had a resident half- or stepsibling, 2021. Original source [S05]
15.6% / 17.8%
$86,300
Active-military / Veteran couple families with children that were step-families in Canada, 2021; non-military: 11.5%. Original source [S06]
Median net worth in the US blended-family household comparison, versus $194,400 non-blended, in 2023 dollars. Original source [S01]
$400
14% / 16%
Median monthly cash support among the relevant blended-family cash-support recipients, pooled 2022–2023, in 2023 dollars. Original source [S01]
Men / women who entered a recent first marriage with stepchildren, NSFG 2015–2019; includes nonresident children. Original source [S13]
19% → 41%
42%
Cohabiting share of step-family unions among US women under 45, 1988 to 2017. This is historical composition. Original source [S08]
US adults with any step relative in a 2010 survey. This is an extended-family network measure, not children’s current residence. Original source [S11]
How many US children live in blended families?
Pew’s 2026 analysis found that 17% of US children under 18 lived in a blended family in 2023. Its definition includes stepparents, stepsiblings and half siblings, so some children counted had no resident stepparent.
| ID | Finding and interpretation | Population and actual data period | Source |
|---|---|---|---|
| F01 | The share of US children living in blended families was 17% in 2023, compared with 23% in 2013. Children under 18 living with specified relatives most/all of the time. Not all lifetime stepfamily experiences; 2026 is publication year. | Children under 18 living with family members most/all of the time; financial/support analyses use specified households/families December 2013 and December 2023 | Original source [S01] |
| F02 | The share of children living with a half sibling fell from 17% in 2013 to 12% in 2023. Half-sibling, stepparent and stepsibling categories overlap. A five-point change cannot be assigned a causal share of the six-point overall change by division. | Children under 18 living with family members most/all of the time; financial/support analyses use specified households/families December 2013 and December 2023 | Original source [S01] |
| F03 | Blended-family residence was reported for 13% of children aged five or younger, 18% of those aged 6–12 and 22% of teens aged 13–17. Cross-sectional age groups, not the same children followed as they grew older. | Children under 18 living with family members most/all of the time; financial/support analyses use specified households/families December 2023 | Original source [S01] |
| F04 | The share was 28% with parent education of high school or less, 23% with some college and 9% with a bachelor’s degree or more. Descriptive association; not a causal effect of education or family structure. | Children under 18 living with family members most/all of the time; financial/support analyses use specified households/families December 2023 | Original source [S01] |
| F05 | Among children, blended-family residence was 28% for Black children, 19% for Hispanic children, 15% for White children and 7% for Asian children. Group-specific child denominators; racial/ethnic categories follow the original analysis. No inference about individual family quality. | Children under 18 living with family members most/all of the time; financial/support analyses use specified households/families December 2023 | Original source [S01] |
| F06 | Among children in blended families, 46% lived with a parent and stepparent: 33% with their mother and a stepparent and 13% with their father and a stepparent. Denominator is children in blended families, not all US children. Siblings may also be present. | US children under 18 in blended families December 2023 | Original source [S01] |
| F07 | Half of children in blended families had no resident stepparent but at least one half sibling: 27% lived with both parents and 23% with one parent. This broad sibling-inclusive definition differs from a simple count of children with a resident stepparent. | US children under 18 in blended families December 2023 | Original source [S01] |
| F08 | Among children living with a parent and stepparent, 66% lived with a married couple and 34% with an unmarried couple. Conditional on resident parent and stepparent, not all blended-family children. Stepparent includes an unmarried cohabiting partner in this analysis. | US children under 18 living with a parent and stepparent December 2023 | Original source [S01] |
| F09 | Among children living with a parent and stepparent, 27% also lived with half siblings only, 15% with stepsiblings only and 14% with both. Only the listed sibling arrangements; these shares are not presented as an exhaustive all-child distribution. | US children under 18 living with a parent and stepparent December 2023 | Original source [S01] |
A clearer trend comparison: overall blending and half siblings
MyLittleDesire calculates a six-percentage-point decline in blended-family residence and a five-point decline in half-sibling residence between 2013 and 2023. Pew says the drop mainly involved half-sibling arrangements. Because kinship categories overlap, dividing five by six would not establish an exact causal contribution. [C01–C02] Pew Research Center; Jake Hays [S01]

What do the US data show about household finances and support?
Pew reported lower median net worth and homeownership in its blended-family comparison. These are descriptive differences between groups; household net worth, homeowner equity and child-support receipt have different bases.
| ID | Finding and interpretation | Population and actual data period | Source |
|---|---|---|---|
| F10 | Median household net worth was $86,300 for households with children in blended families versus $194,400 for the non-blended comparison. Group medians, not each family’s wealth or the causal cost of becoming a stepfamily. | Households with children in blended versus non-blended families 2023; inflation-adjusted 2023 USD | Original source [S01] |
| F11 | A resident parent with a bachelor’s degree was reported for 24% of children in blended families versus 53% in non-blended families. This is the education composition of each family group; it differs from the probability of a blended family within an education group in F04. | Children under 18 living with family members most/all of the time; financial/support analyses use specified households/families December 2023 | Original source [S01] |
| F12 | Homeownership was 55% in the blended-family comparison and 66% in the non-blended comparison; homeowner median equity was $132,000 versus $195,000. Equity excludes non-homeowners and is not the same universe as overall net worth. Differences are descriptive, with no causal adjustment. | Blended/non-blended families; equity comparison restricted to homeowners 2023; equity in 2023 USD | Original source [S01] |
| F13 | A formal or informal child-support agreement existed for 46% of blended families with at least one child living with one parent but not the other. Not 46% of every blended family. Pooling improves sample availability; it is not a single 2023-only estimate. | Blended families with at least one child living with one parent but not the other 2022–2023 pooled | Original source [S01] |
| F14 | Among blended families with a child-support agreement, 64% received cash payments. Conditional agreement base. Do not call the remaining percentage unpaid legally required support: agreements can be formal or informal. | Blended families with a child-support agreement 2022–2023 pooled | Original source [S01] |
| F15 | Cash-support recipients with cash agreements received a median $400 monthly; the report describes support as 12% of monthly household income on average. Median amount and reported average income share are different summaries. Do not divide the median amount by 12% to infer median family income. | Blended families with cash support agreements that receive payments 2022–2023 pooled; 2023 USD | Original source [S01] |
| F16 | In-kind support was received by 15% of blended families with a child living with one parent but not the other. Can occur with or without a support agreement; not mutually exclusive with cash support. No combined unique-recipient rate can be calculated from the marginals. | Blended families with a child living with one parent but not the other 2022–2023 pooled | Original source [S01] |
The wealth comparison changes when the sample is homeowners
The overall median net-worth gap is $108,100: $194,400 − $86,300. Relative to the non-blended median, that is 55.6%. Among homeowners, the median home-equity gap is $63,000, or 32.3% of the non-blended homeowner benchmark. This puts two financial comparisons in one place without treating their eligibility bases as identical. [C03–C07] Pew Research Center; Jake Hays [S01]

Support has another denominator. An agreement, a cash payment and in-kind help are separate measures. The agreement and recipient shares are conditional and are pooled over 2022–2023. They should not be presented as one universal support rate. A median payment divided by an average income share does not identify median household income.
How common are step-families in England and Wales?
The 2021 Census identified about 781,000 step-families, including 547,000 with dependent children. These are England-and-Wales estimates, rather than a UK-wide count.
| ID | Finding and interpretation | Population and actual data period | Source |
|---|---|---|---|
| F17 | There were about 781,000 step-families in 2021; 547,000, or 70.0%, contained dependent children. England and Wales only. Approximate headline counts; do not substitute them for exact rounded-to-five table cells when reproducing calculations. | Usual residents in families; dependent children use ONS age/education definition Census 2021; 2011 figures reprocessed to the 2021 method | Original source [S02] |
| F18 | Dependent children living in step-families accounted for 8.8% (about 1.1 million) in 2021, down from 9.7% (about 1.2 million) in reprocessed 2011 estimates. Use the 2011 estimates reprocessed under the 2021 definition; older previously published 2011 estimates use another method. | Usual residents in families; dependent children use ONS age/education definition Census 2021; 2011 figures reprocessed to the 2021 method | Original source [S02] |
| F19 | Blended families were 51.6% of step-families with dependent children in households of five people or fewer. Restriction is essential: blended families are not reliably identified in larger households. This is not 51.6% of every step-family. | Step-families with dependent children in households of five or fewer people Census 2021; 2011 figures reprocessed to the 2021 method | Original source [S02] |
| F20 | Men accounted for 81.6% of stepparents identified in the 2021 analysis. People, not families or children. A person can be both a parent and a stepparent; identity and household classification may differ. | Usual-resident stepparents identified by the ONS analysis Census 2021; 2011 figures reprocessed to the 2021 method | Original source [S02] |
| F21 | Cohabiting couple families contained 48.6% of dependent children in step-families versus 13.3% of dependent children in non step-families. Child-based shares. The bulletin’s “3.5 times” wording does not exactly match division of these reported percentages; publish the percentages or label independent arithmetic explicitly. | Dependent children in step-families versus non step-families Census 2021; 2011 figures reprocessed to the 2021 method | Original source [S02] |
| F23 | Step-families with dependent children numbered 530,275 within 5,019,155 opposite-sex couple families and 8,685 within 28,470 same-sex couple families. Cross-sectional composition, not a causal effect or a child-wellbeing measure. Counts rounded to five. | Couple families with dependent children, grouped by couple sex composition Census day 2021-03-21; revised-method 2011 comparisons where specified | Original source [S03] |
| F25 | The tables identify 92,870 step-families in households of six or more people, 251,165 blended families in smaller households and 436,845 non-blended step-families in smaller households. The blended/non-blended split is unclassified in large households. Do not describe every unclassified case as non-blended. Component sum differs from published total by five through rounding. | All step-families, including those with only non-dependent children Census day 2021-03-21; revised-method 2011 comparisons where specified | Original source [S03] |
What do the data reveal about connections across two homes?
ONS measures both children’s second parent/guardian addresses and households receiving additional children. These views help explain family connections beyond a usual residence, but they cannot be added or interpreted as equal parenting time.
| ID | Finding and interpretation | Population and actual data period | Source |
|---|---|---|---|
| F22 | A second parent/guardian address used for more than 30 days a year was reported for 12.6% of dependent step-family children and 12.8% of non-step lone-parent-family children. Not the proportion in legal shared custody or a measure of equal parenting time. Do not infer no contact from the absence of a second-address report. | Usual-resident dependent children in the specified family types Census 2021; 2011 figures reprocessed to the 2021 method | Original source [S02] |
| F24 | Among couple step-family households, 31,675 had one additional dependent child staying, 14,190 had two and 3,040 had three or more; corresponding non-step couple-household counts were 82,285, 31,835 and 5,555. Receiving-household measure, not the usual-resident-child measure in F22. Bases include households with and without their own dependent children. Counts cannot be added to children’s second-address counts. | Single-family couple households; nonresident dependent children staying more than 30 days yearly Census day 2021-03-21; revised-method 2011 comparisons where specified | Original source [S03] |
The usual-home view and the receiving-home view
Using ONS Table 1h, we added the mutually exclusive one-, two- and three-or-more additional-child categories and divided by the relevant household total. The result is 6.9% of couple step-family households and 1.2% of non-step couple households receiving additional dependent children for more than 30 days per year. These are household percentages, separate from the 12.6% and 12.8% child-address measures. [C13–C14] Office for National Statistics [S03]
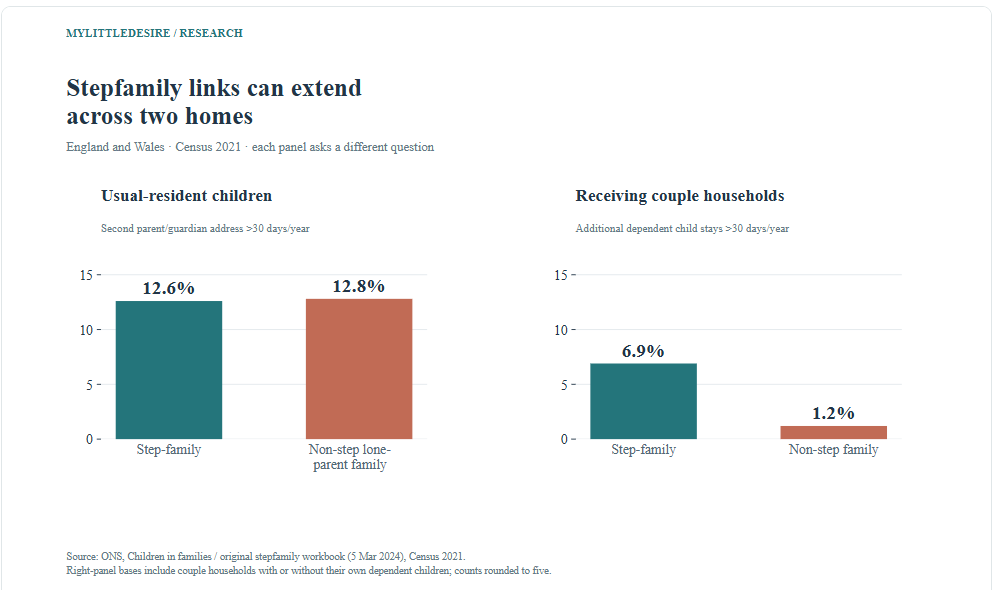
For step-family households, the calculation is (31,675 + 14,190 + 3,040) ÷ 711,155 × 100. The receiving-household bases include households with or without their own dependent children. Do not add the two panels, call the figures legal shared-custody rates or infer the level of contact among families without a reported second address.
What do Canadian stepfamily statistics measure?
Canada’s census distinguishes simple and complex stepfamilies and reports both children and couple families. The all-age family tables include adult children living at home; the child-focused figures below are limited to ages 0–14.
| ID | Finding and interpretation | Population and actual data period | Source |
|---|---|---|---|
| F26 | Married-couple step-families numbered 261,015 in 2011 and 252,945 in 2021; common-law step-families numbered 247,690 and 250,530. Children of any age living at home, not only minor children. Rounded census counts. Raw denominators retained for transparent within-country calculations. | Census families with children of any age in private households; two-parent married/common-law families 2021, 2016 and 2011 censuses; Canada; age-of-youngest-child total selected | Original source [S04] |
| F27 | The average number of resident children was 2.0 in both married and common-law step-families, compared with 1.9 and 1.7 in their respective non-step-family groups. Averages, not percentages. Children can be adults. Family composition and age differences prevent a causal interpretation. | Census families with children of any age in private households; two-parent married/common-law families 2021 Census | Original source [S04] |
| F28 | Simple step-families averaged 1.5 resident children and complex step-families 2.9, in both married and common-law groups. Complex classification itself involves more elaborate sibling/parent combinations. This is not evidence that complexity causes larger families or difficulties. | Census families with children of any age in private households; two-parent married/common-law families 2021 Census | Original source [S04] |
| F29 | Among children aged 0–14 in private households, 9% lived in step-families, 70% with both biological/adoptive parents and 19% in one-parent families. Child denominator, unlike all-age couple-family counts. Remaining children have other living arrangements; do not silently force displayed rounded shares to 100%. | Children aged 0–14 in private households; sibling composition conditional on living in a stepfamily 2021 Census | Original source [S05] |
| F30 | Among children aged 0–14 in step-families, 65.2% had a half- or stepsibling; 19.6% lived with a stepfather and no half/stepsibling and 15.2% with a stepmother and no half/stepsibling. The 19.6% and 15.2% categories are explicitly without half/stepsiblings; they are not total stepfather/stepmother prevalence. | Children aged 0–14 living in step-families 2021 Census | Original source [S05] |
| F31 | Step-families were 15.6% of active-military couple families with children, 17.8% of Veteran couple families and 11.5% of non-military couple families. Couple families with children of any age. Descriptive 2021 association; does not show military service causes stepfamily formation. | Active-military, Veteran and non-military couple families living with children of any age 2021 Census | Original source [S06] |
| F32 | Complex step-families were 7.1% of active-military couple families with children, 5.4% of Veteran couples and 4.4% of non-military couples; simple shares were 8.4%, 12.4% and 7.1%. All shares use couple families with children in the specified military-status group, not only step-families. Rounding can make subtypes miss the published total by 0.1 point. | Active-military, Veteran and non-military couple families living with children of any age 2021 Census | Original source [S06] |
Prevalence and composition answer different Canadian questions
From the same 2021 table, 31.0% of common-law couples with resident children were stepfamilies, compared with 7.3% of married couples with resident children. Yet a different question is “what share of stepfamilies is common-law?” That answer is 49.8%, compared with 18.8% of all couple families with children. The same census can support all four figures because their denominators differ. [C08–C11] Statistics Canada [S04]
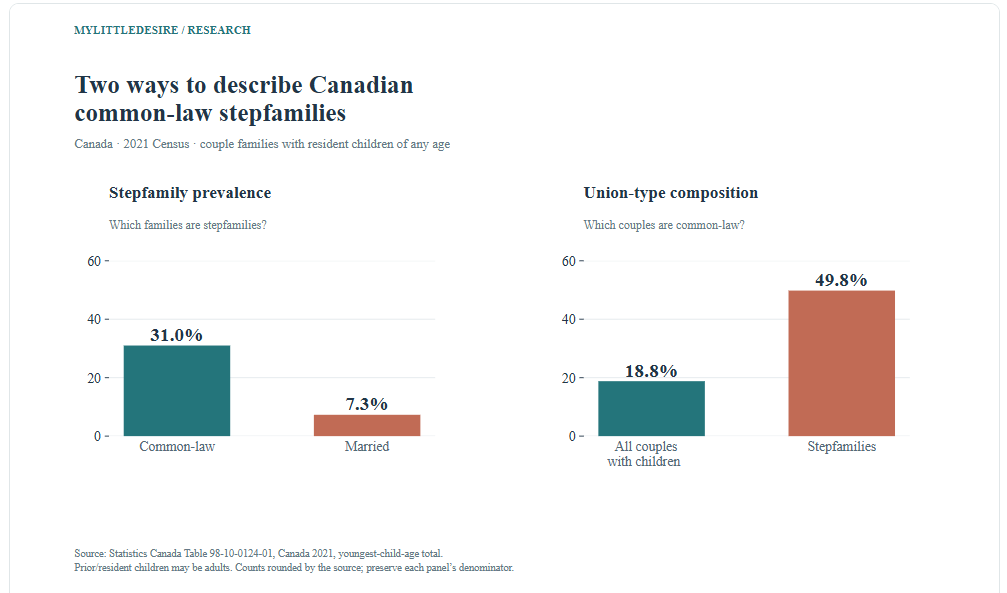
The two published stepfamily counts sum to 503,475 couple stepfamilies in 2021. This is a transparent sum of separately rounded married and common-law counts, with children of any age at home. It should not be substituted for the count of minor children living with stepparents. [C12] Statistics Canada [S04]
Do stepfamilies occur only after remarriage?
No. US NSFG analyses identify stepfamilies in first marriages and cohabiting unions as well as remarriages. These studies include prior children who live elsewhere, which makes their estimates different from resident-child census measures.
| ID | Finding and interpretation | Population and actual data period | Source |
|---|---|---|---|
| F33 | Among partnered respondents under 50, 35% of women’s unions and 25% of men’s unions were classified as step-families. 2015–2019 NSFG weighted to 2017; can include nonresident prior children. Not the percentage of all US households. | Currently cohabiting or married men and women under 50; prior children can be resident or nonresident 2015–2019 NSFG cycles, weighted to represent 2017 | Original source [S07] |
| F34 | The step-family share in first marriages was 13% for men and 19% for women; in second-or-later marriages it was 54% and 83%. Currently partnered under-50 respondents, not recent marriage entrants. Remarriage does not imply that every marriage has stepchildren. | Currently cohabiting or married men and women under 50; prior children can be resident or nonresident 2015–2019 NSFG cycles, weighted to represent 2017 | Original source [S07] |
| F35 | Among never-married cohabiters, 33% of men’s and 41% of women’s unions were step-families; among previously married cohabiters, 82% and 87%. Prior children need not live in the current household; relationship histories and age composition differ. | Currently cohabiting or married men and women under 50; prior children can be resident or nonresident 2015–2019 NSFG cycles, weighted to represent 2017 | Original source [S07] |
| F36 | Step-family shares for partnered men/women were 41%/50% without high school, 33%/45% with high school/GED/some college, 26%/41% with an associate degree and 11%/18% with a bachelor’s degree or more. Under-50 person-level groups, weighted to 2017; observational differences, not estimates of causal educational effects. | Currently cohabiting or married men and women under 50; prior children can be resident or nonresident 2015–2019 NSFG cycles, weighted to represent 2017 | Original source [S07] |
| F37 | Step-family shares among partnered men/women were 23%/33% for White adults, 46%/56% for Black adults, 25%/35% for Hispanic adults and 18%/27% in the profile’s Other category. Use original categories and age/partnered restrictions. Not a measure of children’s wellbeing or individual relationship quality. | Currently cohabiting or married men and women under 50; prior children can be resident or nonresident 2015–2019 NSFG cycles, weighted to represent 2017 | Original source [S07] |
| F52 | Of respondents recently entering a first marriage, 85% had no stepchildren; the share entering with stepchildren was 16% among women and 14% among men. Recent first marriage of the respondent; their partner may have married before. Includes resident and nonresident stepchildren; not all current first marriages. | Men and women recently entering a first marriage, with resident or nonresident stepchildren counted 2015–2019 NSFG; first marriages occurring within five years before interview | Original source [S13] |
| F53 | Among recent first-marriage entrants with a high school diploma, 26% had at least one stepchild. Historical 2015–2019 NSFG, stepchildren in/out of the home. Not a causal education effect. | Recent first-marriage entrants with a high school diploma 2015–2019 NSFG; first marriages occurring within five years before interview | Original source [S13] |
| F54 | Stepchildren at first-marriage entry were reported by 28% of Black respondents, 13% of White respondents, 15% of Hispanic respondents and 14% in the Other category. Recent first marriage of individual respondents. Original categories, age/history composition and nonresident children retained. | Men and women recently entering a first marriage, with resident or nonresident stepchildren counted 2015–2019 NSFG; first marriages occurring within five years before interview | Original source [S13] |
| F55 | Among recent first-marriage entrants, 12% of those aged 25–29 at marriage had stepchildren, compared with 24% of those aged 30 or older. Historical cohort comparison, not the effect of waiting to marry. The profile’s ambiguous youngest age label is excluded. | Recent first-marriage entrants, by age at marriage 2015–2019 NSFG; first marriages occurring within five years before interview | Original source [S13] |
Current status and marriage entry are different samples. The under-50 profile describes respondents currently in a first marriage. The first-marriage-entry profile describes people whose own first marriage occurred in the preceding five years. Do not compare their percentages as a trend or assume both spouses are marrying for the first time. National Center for Family & Marriage Research; Karen B. Guzzo [S07]; National Center for Family & Marriage Research; Lisa Carlson [S13]
How have US stepfamily unions changed historically?
Among partnered women under 45, the share of unions involving prior children increased between 1988 and 2017, and cohabitation accounted for a larger share of these unions. This is a historical NSFG comparison, not a 2027 measurement.
| ID | Finding and interpretation | Population and actual data period | Source |
|---|---|---|---|
| F38 | Among partnered women under 45, step-family unions rose from 24% in 1988 to 33% in 2017; marriage shares were 21% to 27%, and cohabitation shares 48% to 49%. Different from S07’s under-50 base; this profile limits women to under 45. All prior children count regardless of residence. | Women under 45 currently living with a spouse or partner; prior children count regardless of residence 1988 NSFG and 2015–2019 NSFG weighted to represent 2017 | Original source [S08] |
| F39 | Cohabitation accounted for 19% of step-family unions among women under 45 in 1988 and 41% in 2017; marriage accounted for 81% and 59%. Composition within step-families, not step-family prevalence within all cohabitations. Denominators differ from the previous finding. | Step-family unions among partnered women under 45 1988 NSFG and 2015–2019 NSFG weighted to represent 2017 | Original source [S08] |
| F40 | Among step-family unions, both partners having prior children rose from 22% in 1988 to 35% in 2017; female-only history changed from 50% to 34% and male-only from 29% to 31%. Parenthood history, not the resident child mix. Rounded 1988 components sum to 101%; retain reported values. | Step-family unions among partnered women under 45 1988 NSFG and 2015–2019 NSFG weighted to represent 2017 | Original source [S08] |
| F41 | Both partners having prior children accounted for 29% of cohabiting step-family unions in 1988 and 41% in 2017; corresponding married shares were 20% and 31%. Separate union-type bases; these are historical composition shares, not outcomes of blending households. | Step-family unions among women under 45, by marriage/cohabitation 1988 NSFG and 2015–2019 NSFG weighted to represent 2017 | Original source [S08] |
The cohabiting share within stepfamily unions rose 22 percentage points, from 19% to 41%. That does not mean 41% of all cohabitations were stepfamilies: the 2017 prevalence within cohabitations in this under-45 profile was 49%. Keeping the question visible prevents a denominator switch. [C17] National Center for Family & Marriage Research; Karen B. Guzzo [S08]
What can the Australian 2021 estimates tell us?
AIFS reported that about 12% of couple families with dependent children were step or blended families. ABS subsequently documented an overcount affecting some 2021 stepfamily classifications, so these published figures require a visible quality qualification.
Known Australian data-quality limitation. ABS identifies overcounted stepchildren and incorrectly classified stepfamilies in some jurisdictions, affecting couple families where a spouse was temporarily absent. The source provides no quantified correction here. We retain the published values with that warning and do not turn the 2016–2021 increase into a claimed social trend. Australian Bureau of Statistics [S10]
| ID | Finding and interpretation | Population and actual data period | Source |
|---|---|---|---|
| F42 | AIFS reported 182,229 step-families and 99,564 blended families with dependent children in the 2021 Census, together about 12% of couple families with dependent children. Published classification estimates; ABS warns of overcounted stepchildren/step-families in some jurisdictions when a spouse was temporarily absent. No correction or clean 2016–2021 social trend is inferred. | Couple families with dependent children; separate Figure 6 base: children aged 0–14 in couple/one-parent families 2021 Census (historical context from earlier censuses) | Original source [S09] |
| F43 | Figure 6 reported step/blended shares of 2.7%/5.2% for infants under one, compared with 6.9%/4.4% for children aged 14. Published classification estimates; ABS warns of overcounted stepchildren/step-families in some jurisdictions when a spouse was temporarily absent. No correction or clean 2016–2021 social trend is inferred. Cross-sectional age comparison, not transitions of the same children. | Children aged 0–14 in couple or one-parent families, by single year of age 2021 Census (historical context from earlier censuses) | Original source [S09] |
| F44 | Across children aged 0–14 in the figure’s family base, reported shares were 4.7% step, 4.7% blended, 72.7% intact and 17.9% one-parent families. Published classification estimates; ABS warns of overcounted stepchildren/step-families in some jurisdictions when a spouse was temporarily absent. No correction or clean 2016–2021 social trend is inferred. “Intact” is the source’s technical label, not a quality judgment. | Children aged 0–14 in couple or one-parent families; very small other-couple category excluded 2021 Census (historical context from earlier censuses) | Original source [S09] |
Why can a household relationship label change a count?
A US Census analysis found that men living with a partner’s children were not always identified as stepfathers in the relationship roster. This concerns how respondents label relationships, rather than whether a man is involved or caring.
| ID | Finding and interpretation | Population and actual data period | Source |
|---|---|---|---|
| F49 | The Census analysis estimated four million men living with a spouse/partner’s children; 1.8 million did not also live with their own biological/adopted minor children. Men, not families or stepchildren. Historical SIPP population estimates, not sample sizes or 2027 counts. | Men living with a spouse/partner’s children; restricted subgroup has no own biological/adopted resident children 2014 SIPP Wave 1, collected February–June 2014; household composition at interview | Original source [S12] |
| F50 | Within the no-own-resident-minor-child subgroup, 59.9% of men were identified as stepfathers and 40.1% were not. Household respondent’s relationship label; not evidence that 40.1% of all stepfathers deny parenting or are uninvolved. | Men living with spouse/partner children but no own biological/adopted minor resident children 2014 SIPP Wave 1, collected February–June 2014; household composition at interview | Original source [S12] |
| F51 | Identification as a stepfather was 43.8% among the subgroup living with partner children aged 0–5 and 54.7% with children aged 6–11; it was 64.9% with ages 12–17. Original Table 6 supplies 64.9% (article rounds to almost 65%). Child-age groups can overlap; they do not track the same men or measure relationship closeness. | Men living with spouse/partner children and no own biological/adopted minor resident children, by child age 2014 SIPP Wave 1, collected February–June 2014; household composition at interview | Original source [S12] |
The original report confirms that its household composition was measured at interviews conducted in February–June 2014. Its age-group categories can overlap when a man lives with children of different ages. Labels and counts should therefore be interpreted in the original survey design, rather than as a count of parents who accept or reject their family role. US Census Bureau; Brian Knop and Lindsay M. Monte [S12]
What do historical surveys say about extended stepfamily networks?
A 2010 Pew survey measured adults’ step relatives, family satisfaction and perceived obligations. It captures relationships that can extend across households and adulthood; it should not be substituted for a current child-residence rate.
| ID | Finding and interpretation | Population and actual data period | Source |
|---|---|---|---|
| F45 | In the 2010 adult survey, 42% had a step relative; 30% had a step/half sibling, 18% a living stepparent and 13% a stepchild. Historical adult network, including relatives outside the home. Categories overlap. Not 42% of children living in blended households in 2027. | Adults aged 18+; selected relationship/obligation questions have further eligibility bases 2010-10-01 to 2010-10-21 | Original source [S11] |
| F46 | Very high family-life satisfaction was reported by 70% of adults with step relatives and 78% without them. 2010 self-reports, with different respondent histories. Not a causal effect of step relationships or a current success/failure rate. | Adults aged 18+; selected relationship/obligation questions have further eligibility bases 2010-10-01 to 2010-10-21 | Original source [S11] |
| F47 | Family life had turned out differently than expected for 54% of adults with step relatives, versus 41% of adults without them. 2010 attitudes; “different” does not mean worse or imply unhappiness. | Adults aged 18+; selected relationship/obligation questions have further eligibility bases 2010-10-01 to 2010-10-21 | Original source [S11] |
| F48 | Among adults with both a living parent and a living stepparent, 85% felt very obligated to help the parent in serious need and 56% the stepparent. Stated perceived obligation, not actual care, financial transfers or willingness of every individual. Historical 2010 survey. | Adults who had both a living parent and living stepparent 2010-10-01 to 2010-10-21 | Original source [S11] |
Which claims should writers avoid?
- A country league table. The US sibling-inclusive child measure, Canadian all-age family counts, E&W dependent-child estimate and Australian classifications do not share one definition.
- A universal stepfamily divorce or failure rate. Remarriage, having prior children and living with a stepchild are different populations. This research does not establish one failure probability.
- A universal adjustment deadline. No specific number of years for every blended family follows from these demographic tables.
- A causal story from an association. Wealth, education, marriage history and family composition are related in observational data. The reported gaps do not establish that stepfamily formation caused an outcome.
- A judgment about children or family quality. “Simple,” “complex” and “intact” are technical source labels. They do not establish the warmth, stability or capability of a particular family.
How were the statistics checked?
MyLittleDesire checked original research pages, methods, source PDFs and official data tables. The database records each finding’s values, original organization, direct link, publication and observation periods, geography, population, sample-size availability, source locator, definitions, caveats and verification status. Related categories remain grouped instead of being advertised as independent studies.
The package contains 55 grouped findings, 180 numeric source inputs and 20 reproducible calculations. Thirteen source records include twelve with numeric findings and one ABS definition/quality source. They do not represent thirteen independent surveys. The NCFMR profiles share NSFG cycles, Canadian publications share the 2021 Census, and several US analyses use SIPP. The largest single source supplies sixteen grouped findings. MyLittleDesire conducted no new survey.
- Edition and observation years: 2027 is a planning label. US child-residence findings mainly describe December 2023; support findings pool 2022–2023. Census estimates mostly describe 2021. Historical adult-network, NSFG and SIPP observations retain their actual periods.
- Different units: children, adults, couples, families and households remain distinct. Survey-weighted population counts are not sample sizes. Where analytical sample counts are not disclosed, the database says so.
- Australia: three rows are verified as published estimates with a known classification error, not independently corrected estimates. The ABS limitation is shown beside those rows and no Australian trend chart is drawn.
- Historical comparability: ONS’s 2011 estimates use the revised method supplied with the 2021 release. Older 2011 publications should not be mixed into that comparison.
- Rounding and arithmetic: percentage-point changes, relative percentage gaps, dollar differences and counts have explicit units. Calculations use raw published inputs before final rounding, so subtracting displayed rounded percentages can differ by 0.1 point. No new confidence intervals, significance tests or causal estimates are claimed.
- Source checks: an ambiguous youngest age band in the first-marriage profile is omitted. ONS’s ratio wording is not repeated where it differs from division of the displayed percentages. Blocked later-life research was not treated as a completed full-text review and contributes no findings.
- Coverage: residential rosters miss some relationships elsewhere. Historical adult-network surveys and prior-parenthood studies help explain that measurement boundary but are not interchangeable with current residential prevalence.
MyLittleDesire contributed verification, organization, reproducible arithmetic and chart design. These are original editorial comparisons of published research, not new scientific discoveries or MyLittleDesire fieldwork. All findings should be rechecked before later publication or material reuse.
What are the original sources?
- [S01] Pew Research Center; Jake Hays. 5 facts about U.S. children living in blended families. Published: 2026-04-21. Observations: December 2023; December 2013 historical comparison; child-support analysis pools 2022–2023. Blended includes a stepparent, stepsiblings or half siblings, including arrangements without a resident stepparent. No complete nonresident family network. Support questions have nested bases; dollars are 2023 USD. Original methods, tables or supporting research record.
- [S02] Office for National Statistics. Children in families in England and Wales: Census 2021. Published: 2024-03-05. Observations: Census 2021; 2011 figures reprocessed to the 2021 method. England and Wales, not the whole UK. Step-family includes some lone-parent families with step relationships. Blended classification limited to households of five or fewer people. Not directly comparable to older 2011 publications. Original methods, tables or supporting research record.
- [S03] Office for National Statistics. Step-families, blended families and dependent children: Census 2021 — data tables. Published: 2024-03-05. Observations: Census day 2021-03-21; revised-method 2011 comparisons where specified. Source count totals may differ through rounding. Second addresses require more than 30 days per year; not a legal shared-custody measure. Receiving-household and usual-resident child totals cannot be added. Original methods, tables or supporting research record.
- [S04] Statistics Canada. Table 98-10-0124-01: Census family structure including detailed information on stepfamilies, number of children, average number of children and age of youngest child. Published: 2022-07-13 release; table metadata also records later maintenance. Observations: 2021, 2016 and 2011 censuses; Canada; age-of-youngest-child total selected. Counts randomly rounded; do not silently reconcile small component/total differences. All-age children base differs from children under 15 or couples with a child under 25. Simple/complex are composition labels, not measures of difficulty. Original methods, tables or supporting research record.
- [S05] Statistics Canada. Home alone: More persons living solo than ever before, but roomies the fastest growing household type — children/stepfamily findings. Published: 2022-07-13. Observations: 2021 Census. Child-based denominator differs from couple-family tables. Half/stepsibling relationships require household co-residence. Percentages are rounded and should not be treated as a full extended-kin count. Original methods, tables or supporting research record.
- [S06] Statistics Canada. A portrait of military families in Canada from the 2021 Census. Published: 2025-01-13. Observations: 2021 Census. Descriptive associations, not effects of military service. Military status belongs to the family definition in the report. Independent rounding can make simple+complex differ from a published total.
- [S07] National Center for Family & Marriage Research; Karen B. Guzzo. Variation in Stepfamilies Among Currently Cohabiting and Married Men and Women Under 50, FP-21-22. Published: 2021 profile; website maintenance stamp July 2026 is not a new study. Observations: 2015–2019 NSFG cycles, weighted to represent 2017. Person-level histories, not all children or households. Sex differences do not indicate that a matched couple has two incompatible family statuses: respondents and prior-child reporting differ. Original methods, tables or supporting research record.
- [S08] National Center for Family & Marriage Research; Karen B. Guzzo. Stepfamilies among Currently Cohabiting and Married Women Under 45, 1988 and 2017, FP-21-21. Published: 2021. Observations: 1988 NSFG and 2015–2019 NSFG weighted to represent 2017. Historical comparison; do not recast as a 2027 rate. Having a prior child is not limited to living with a minor child, and some first marriages are stepfamilies. Rounded component percentages can sum to 101. Original methods, tables or supporting research record.
- [S09] Australian Institute of Family Studies; analysis of ABS Census. Families and family composition. Published: 2023-08-01. Observations: 2021 Census (historical context from earlier censuses). Known ABS 2021 classification error overcounts some stepchildren and stepfamilies where a spouse was temporarily absent. Published figures retained only as reported classification estimates with this warning; no corrected total or social trend inferred. Original methods, tables or supporting research record.
- [S10] Australian Bureau of Statistics. Family blending (FBLF), 2021 Census dictionary — definitions and data-use considerations. Published: 2021-10-15 initial dictionary release; page includes later data-quality notes. Observations: 2021 Census. Overcount identified for WA, NSW, Queensland, NT and Other Territories; Victoria partially affected. SA, Tasmania and ACT unaffected by the described error. No quantified correction is provided on this page.
- [S11] Pew Research Center. A Portrait of Stepfamilies. Published: 2011-01-13. Observations: 2010-10-01 to 2010-10-21. Historical adult extended-family network, not current children’s household arrangements. Full-sample ±2.6-point error does not apply to every subgroup. Obligation is stated willingness, not actual caregiving.
- [S12] US Census Bureau; Brian Knop and Lindsay M. Monte. Stepdad or Mom’s Boyfriend?. Published: 2019-06-13; later web revision is not new data. Observations: 2014 SIPP Wave 1, collected February–June 2014; household composition at interview. Identification by the household respondent is not a measure of affection, involvement or a legal relationship. Do not extrapolate this restricted subgroup’s 40.1% to all stepparents. Original methods, tables or supporting research record. Original methods, tables or supporting research record.
- [S13] National Center for Family & Marriage Research; Lisa Carlson. Stepfamilies in First Marriages, FP-20-28. Published: 2020. Observations: 2015–2019 NSFG; first marriages occurring within five years before interview. An adult entering a first marriage with stepchildren is not necessarily a couple in which both people are marrying for the first time. Youngest age band has a boundary-label gap (<24 then 25–29), so that band is not used. Original methods, tables or supporting research record.
How should this page and its charts be cited?
MyLittleDesire. Stepfamily & Blended Family Statistics 2027. 2027 planning edition; sources reviewed October 23, 2026. https://mylittledesire.com/stepfamily-blended-family-statistics/.
For an underlying study finding, also consult and cite the original research as appropriate. For our calculation, include its calculation ID and original source. Suggested chart credit: “Chart and calculations: MyLittleDesire; underlying data:” A link to the article lets readers inspect the definitions and methods. Original publications and datasets retain their own terms.