
Financial infidelity statistics cover several different questions: whether someone deliberately hides money, whether they know a partner’s finances, and how seriously they judge financial secrecy. Each question needs its own denominator and definition.
This resource contains 55 grouped findings from 11 research programs, plus a peer-reviewed definition source. Four charts and 20 reproducible descriptive calculations make useful comparisons easier to check. Related answer categories remain grouped: the database’s 191 numeric inputs are not 191 independent studies or headline discoveries.
What are the key financial infidelity findings?
40%
43%
Reported past/current financial infidelity against their current partner in Bankrate’s December 2024 relationship sample. Bankrate / YouGov [S02]
Of all US adults rated financial secrecy at least as bad as physical infidelity in December 2025. This is an attitude. Bankrate / YouGov [S01]
55%
67% vs 30%
Said both partners knew everything about each other’s finances in that December 2025 relationship sample. Bankrate / YouGov [S01]
Gen Z versus boomers reporting past/current behavior against their current partner, December 2024. Bankrate / YouGov [S02]
43% / 42%
85%
Own versus partner-attributed listed deception among US adults who ever combined finances, in NEFE’s 2021 release. National Endowment for Financial Education / The Harris Poll [S03]
Reported some relationship effect among the NEFE respondents reporting their own and/or a partner’s deception. National Endowment for Financial Education / The Harris Poll [S03]
32% → 36%
27% → 34%
Canada’s 2018 ever-lied percentage before/after removing not-applicable answers. A denominator change, not a trend. Financial Planning Standards Council (now FP Canada) / Credit Canada / Leger [S04]
Canada’s 2018 current-secret percentage before/after the same type of eligibility filter. Financial Planning Standards Council (now FP Canada) / Credit Canada / Leger [S04]
30% / 24%
21%
UK committed-relationship versus married respondents reporting a financial secret, August–September 2023. Starling Bank / Opinium [S05]
Australian adults admitting money lies to a partner OR family member in December 2024. Compare the Market Australia [S07]
27%
About 14%
People aged 18–35 in Experian’s January 2024 UK campaign survey who said they lied about their finances to a partner. Experian UK / 3Gem [S11]
Coupled Wealthsimple client respondents admitting financial infidelity in its 2026 release; a selected client result. Wealthsimple [S10]
What counts as financial infidelity?
The academic definition combines a financial behavior the person expects their partner would disapprove of with an intentional failure to disclose it. A difference in knowledge or account ownership does not, on its own, establish both elements. Emily N. Garbinsky, Joe J. Gladstone, Hristina Nikolova and Jenny G. Olson [S12].
Agreed privacy and independent accounts can be compatible with trust. These surveys generally cannot establish whether privacy was mutually agreed or necessary for someone’s safety. Financial control, coercion and unpaid bills placed in another person’s name should not automatically be framed as ordinary mutual disagreement. The statistics do not justify surveillance, demands for passwords or confrontation.
The research below therefore labels intentional concealment, knowledge gaps, financial arrangements, attitudes and broader financial strain separately.
Which financial infidelity percentage should a writer use?
Use the figure matching the behavior, relationship scope, time reference and respondent base in the story. There is no single harmonized four-country financial-infidelity rate.
| Research question | Suitable source | Published measure | Essential qualification |
|---|---|---|---|
| Past/current behavior in a current live-in US relationship | Bankrate / YouGov [S02] | 40% | December 2024; eligible relationship respondents; not all adults or all lifetime partners |
| Listed deception after ever combining finances | National Endowment for Financial Education / The Harris Poll [S03] | 43% own admission | Current/past relationships; 2021 release; source field-year discrepancy disclosed |
| Mutual financial knowledge in a US relationship | Bankrate / YouGov [S01] | 55% everything / 45% not everything | December 2025; not-everything is not a deception rate |
| Canadian ever lying versus current secrets | Financial Planning Standards Council (now FP Canada) / Credit Canada / Leger [S04] | 36% / 34% in filtered bases | January 2018; different filtered samples, 1,367 and 1,230 |
| UK committed respondents keeping a secret | Starling Bank / Opinium [S05] | 30% | August–September 2023; married subset is 24% |
| Australia money lies to partner or family | Compare the Market Australia [S07] | 21% | December 2024; family-inclusive, sponsor methods limited |
| Canadian clients in a 2026 release | Wealthsimple [S10] | About 14% | Selected Wealthsimple coupled clients; not a national estimate |
What does the latest Bankrate release measure?
The January 2026 release uses December 2025 fieldwork. It distinguishes all-adult attitudes from relationship respondents’ mutual knowledge and their own secrets. Incomplete knowledge must not be relabelled as confirmed deception. Bankrate / YouGov [S01].
| ID | Finding and interpretation | Population and actual data period | Original source and locator |
|---|---|---|---|
| F01 | 43% viewed financial secrecy as at least as bad as physical infidelity: 38% equally bad and 5% worse; 31% less bad and 26% no opinion. Attitudes, not behavior. All-adult base differs from the 2025 release’s relationship-only attitude base. | All US adults 18+ in survey 2025-12-02 to 2025-12-08 | Original source [S01] Original press PDF p.1, opening paragraphs |
| F02 | 55% said they and their partner knew everything about each other’s finances; 29% most things, 11% some details, 3% almost nothing and 2% nothing. The published not-everything total is 45%. Respondents describe mutual knowledge. Incomplete knowledge is not by itself intentional financial deception. | US married, civil-partnered or cohabiting respondents 2025-12-02 to 2025-12-08 | Original source [S01] Original press PDF p.1, mutual financial knowledge |
| F03 | Reported secrets included minor debt/expenses/income (25%), undiscussed credit or savings/investment details (11%), major debt/expenses/income (9%), other secrets (3%) and uncategorized secrets (9%). Categories may overlap. Do not add them to estimate an any-secret rate or substitute the separate 45% knowledge measure. | US married, civil-partnered or cohabiting respondents 2025-12-02 to 2025-12-08 | Original source [S01] Original press PDF pp.1–2, types of financial information |
| F04 | Among those not sharing financial information, 43% thought the partner would not care, 28% said some finances should stay private, 15% did not want the partner to know and 14% were embarrassed. Conditional reasons, not shares of all adults. Privacy and embarrassment do not themselves establish malicious intent. | Relationship respondents not sharing financial information 2025-12-02 to 2025-12-08 | Original source [S01] Survey article, reasons for not sharing financial information |
| F05 | Saying both partners knew everything about each other’s finances ranged from 64% of baby boomers to 53% of millennials, 51% of Gen X and 44% of Gen Z. Cross-sectional groups; generation differences cannot establish aging effects or deception by a particular partner. | Relationship respondents in each generation; source age labels: Gen Z 18–29, millennials 30–45, Gen X 46–61, boomers 62–80 2025-12-02 to 2025-12-08 | Original source [S01] Original press PDF p.1, generational mutual knowledge |
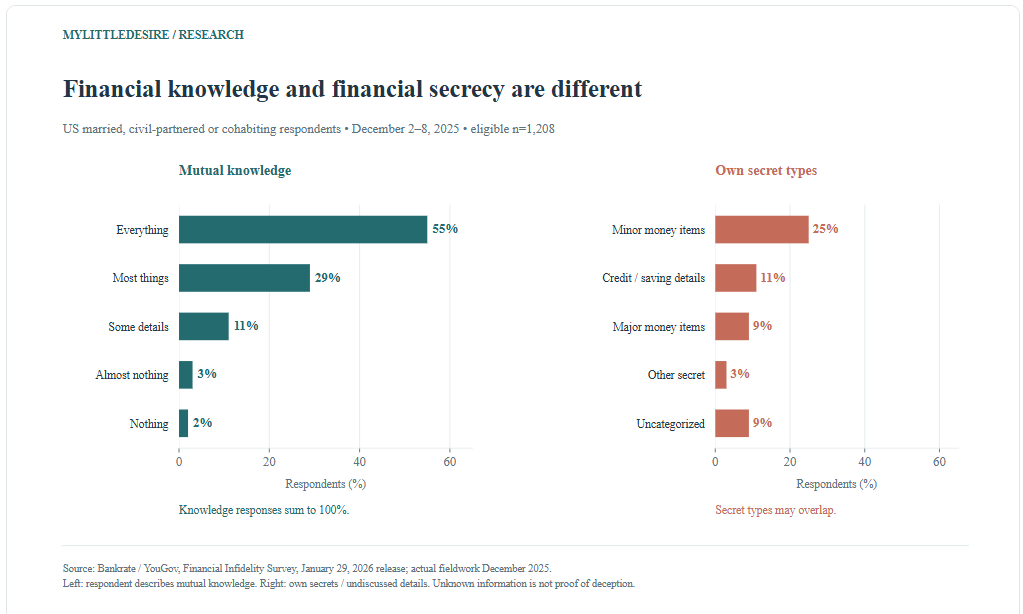
Editorial comparison: boomers’ complete-mutual-knowledge percentage exceeded Gen Z’s by 20.0 percentage points (64 − 44; calculation C20). This describes different age cohorts at one point in time, not an effect of aging.
How common are hidden debt and money secrets in US live-in relationships?
Bankrate’s 2025 release reported 40% with past or current financial infidelity against their current partner. Its December 2024 sample provides separate figures for overspending, debt and accounts. Those categories overlap. Bankrate / YouGov [S02].
| ID | Finding and interpretation | Population and actual data period | Original source and locator |
|---|---|---|---|
| F06 | 40% reported current or past financial infidelity against their current partner; 31% reported past behavior and 21% current behavior. Past and current groups overlap. They must not be added. This is about the current relationship, not any lifetime partner. | Married, civil-partnered or cohabiting adults 18+; questions about their current partner 2024-12-09 to 2024-12-11 | Original source [S02] Survey article, financial-infidelity overview |
| F07 | 33% reported spending more than their partner would approve of at some point in the current relationship; 19% reported past and 13% current overspending. Published rounded components do not reconstruct the 33% net. Disapproval is respondent-reported; no amount threshold is specified. | Married, civil-partnered or cohabiting adults 18+; questions about their current partner 2024-12-09 to 2024-12-11 | Original source [S02] Survey article, behavior table: spending more than partner would be OK with |
| F08 | 23% reported hidden debt at some point in the current relationship: 13% in the past and 10% currently. Past/current entries can overlap; rounded figures are reproduced as published, not used as mutually exclusive categories. | Married, civil-partnered or cohabiting adults 18+; questions about their current partner 2024-12-09 to 2024-12-11 | Original source [S02] Survey article, behavior table: secret debt |
| F09 | Secret accounts reported at some point in the current relationship included credit cards (17%), savings accounts (15%) and checking accounts (13%). Account types can overlap. Secret accounts are distinct from mutually agreed separate accounts. | Married, civil-partnered or cohabiting adults 18+; questions about their current partner 2024-12-09 to 2024-12-11 | Original source [S02] Survey article, behavior table: account types |
| F10 | 38% had only joint accounts, 34% mixed joint/separate accounts and 27% only separate accounts. Bankrate separately reported 62% with at least some separate finances. Rounding means 34 + 27 differs from the published 62% net. Account structure alone is not evidence of betrayal. | Married, civil-partnered or cohabiting adults 18+; questions about their current partner 2024-12-09 to 2024-12-11 | Original source [S02] Survey article, account-structure section |
| F11 | 45% viewed money secrecy as at least as bad as physical infidelity: 38% equally bad and 7% worse; 33% less bad. Relationship-only base. Do not chart against the 2026 release’s all-adult 43% as an equivalent year-to-year series. | Married, civil-partnered or cohabiting adults 18+; questions about their current partner 2024-12-09 to 2024-12-11 | Original source [S02] Survey article and official press release, attitudes |
How do behavior and judgment differ by generation?
Younger relationship respondents reported more past/current financial infidelity in that survey. They also expressed stronger disapproval. The two aggregate questions do not identify which individuals gave both answers. Bankrate / YouGov [S02].
| ID | Finding and interpretation | Population and actual data period | Original source and locator |
|---|---|---|---|
| F12 | Past/current financial infidelity versus judging it at least as bad as physical cheating: Gen Z 67%/63%; millennials 54%/51%; Gen X 33%/45%; boomers 30%/36%. Aggregate comparisons do not identify which individuals both disapprove and report behavior. Subgroup counts and comparison uncertainties are not provided. | Relationship respondents in each generation; source age labels: Gen Z 18–28, millennials 29–44, Gen X 45–60, boomers 61–79 2024-12-09 to 2024-12-11 | Original source [S02] Survey article, generation behavior and attitude comparisons |
| F13 | At least some separate finances were reported by 88% of Gen Z, 70% of millennials, 59% of Gen X and 52% of boomers. Gen Z’s published split was 42% mixed accounts and 46% only separate. Account separation may be mutually agreed. These aggregate associations do not establish that separate accounts cause dishonesty. | Married, civil-partnered or cohabiting adults 18+; questions about their current partner 2024-12-09 to 2024-12-11 | Original source [S02] Survey article, generation account-structure section |
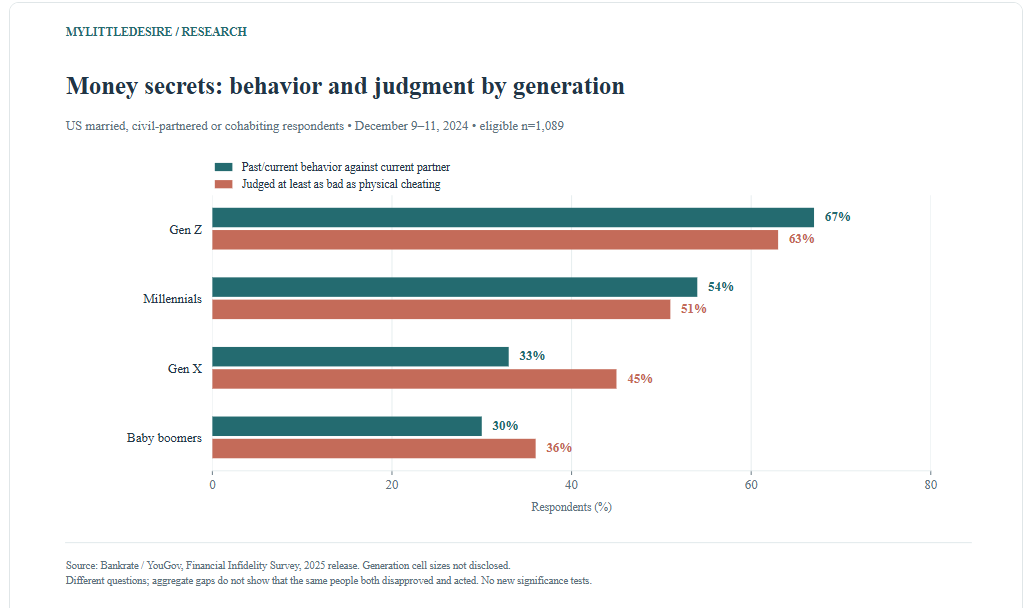
The behavior-minus-judgment gaps are +4.0 points for Gen Z, +3.0 for millennials, −12.0 for Gen X and −6.0 for boomers (C01–C04). These are comparisons of published answers, without new significance testing. They should not be used to label a generation hypocritical.
What do own and partner-attributed reports show?
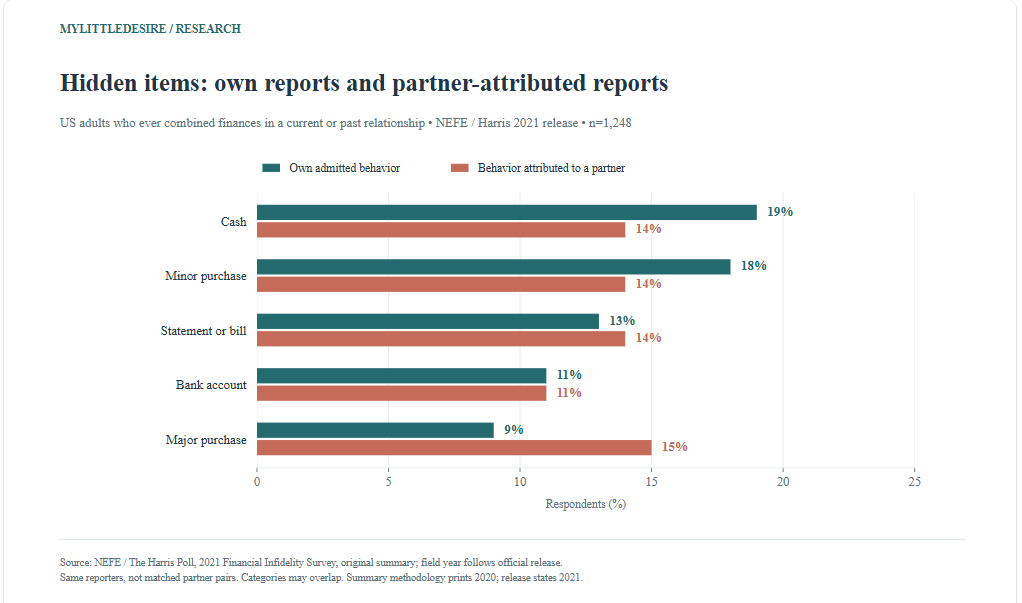
NEFE’s survey looks at adults who have ever combined finances, including past relationships. It separately asks about their own deception and a partner’s behavior. Both accounts come from the respondent; they are not matched reports from two partners. National Endowment for Financial Education / The Harris Poll [S03].
| ID | Finding and interpretation | Population and actual data period | Original source and locator |
|---|---|---|---|
| F14 | Among adults who ever combined finances, 43% admitted a listed financial deception and 42% attributed a listed deception to a partner. Official documents conflict on fieldwork year. Use the release’s 2021 attribution with this discrepancy visible. Self and partner reports are from the same respondents, not matched partners. Reasons/effects permit multiple responses. | US adults who ever combined finances in a current/past relationship June 28–30, 2021 according to official release; summary methodology prints 2020 | Original source [S03] Original summary: Financial Deceptions–Self and Financial Deceptions–Spouse/Partner |
| F15 | Own versus partner-attributed reports were 39%/36% for hiding an item and 21%/24% for lying about finances, debt or earnings. Hiding and lying can overlap; self and partner answers are not independently verified matched-couple reports. | US adults who ever combined finances June 28–30, 2021 according to official release; summary methodology prints 2020 | Original source [S03] Original summary: hiding and lying nets |
| F16 | Own hidden items included cash (19%), a minor purchase (18%), a statement/bill (13%), a bank account (11%) and a major purchase (9%). Official documents conflict on fieldwork year. Use the release’s 2021 attribution with this discrepancy visible. Self and partner reports are from the same respondents, not matched partners. Reasons/effects permit multiple responses. | US adults who ever combined finances June 28–30, 2021 according to official release; summary methodology prints 2020 | Original source [S03] Original summary: Financial Deceptions–Self, hidden-item list |
| F17 | Partner-attributed hidden items included a major purchase (15%), minor purchase (14%), statement/bill (14%), cash (14%) and bank account (11%). Official documents conflict on fieldwork year. Use the release’s 2021 attribution with this discrepancy visible. Self and partner reports are from the same respondents, not matched partners. Reasons/effects permit multiple responses. | US adults who ever combined finances June 28–30, 2021 according to official release; summary methodology prints 2020 | Original source [S03] Original summary: Financial Deceptions–Spouse/Partner, hidden-item list |
| F18 | 47% of men and 39% of women admitted a listed financial deception after ever combining finances. Published binary categories; subgroup achieved sizes not supplied. This is a descriptive comparison, not proof of a gender cause. | Men and women who ever combined finances June 28–30, 2021 according to official release; summary methodology prints 2020 | Original source [S03] Official release, men/women comparison |
| F19 | Own deception was reported by 52% of employed versus 31% of non-employed respondents, and 59% with versus 32% without children under 18 in the household. Current status was measured at survey time; deception may have occurred earlier under different circumstances. Neither employment nor children is shown to cause deception. | Adults who ever combined finances, grouped by current employment and household children June 28–30, 2021 according to official release; summary methodology prints 2020 | Original source [S03] Official release, employment and children comparisons and footnotes |
Why do people report secrecy, and what relationship effects do they report?
Reasons apply to respondents admitting their own deception. Relationship effects apply to the broader group reporting deception by themselves and/or a partner. Keeping those bases distinct prevents an inflated claim about all relationships. National Endowment for Financial Education / The Harris Poll [S03].
| ID | Finding and interpretation | Population and actual data period | Original source and locator |
|---|---|---|---|
| F20 | Reasons included wanting privacy (38%), anticipated disapproval after a prior discussion (34%), embarrassment/fear (33%) and anticipated disapproval without a prior discussion (27%). Multiple reasons could be selected. This is a conditional base; an asserted privacy motive does not establish whether the arrangement was consensual. | Adults who ever combined finances and admitted own financial deception June 28–30, 2021 according to official release; summary methodology prints 2020 | Original source [S03] Original summary: Reasons Committed Listed Financial Deceptions |
| F21 | 85% reported some relationship effect and 15% no effect among respondents reporting their own and/or a partner’s financial deception. This is not 85% of all Americans or only the 555 own-admission respondents. Effects are retrospective respondent attributions. | Ever-combined respondents reporting self and/or partner deception June 28–30, 2021 according to official release; summary methodology prints 2020 | Original source [S03] Original summary: Effects of Financial Deception; official release body defines n=650 |
| F22 | Reported effects included arguments (42%), less trust (32%), less privacy (20%), growing closer (19%), separating finances (16%), proactive communication (16%), divorce (16%) and separating as a couple (13%). Multiple effects; not causal estimates or a national divorce probability. Currently never-married respondents were not offered divorce, couple-separation or proactive-communication options. | Ever-combined respondents reporting self and/or partner deception June 28–30, 2021 according to official release; summary methodology prints 2020 | Original source [S03] Original summary: Effects of Financial Deception; official release footnote on response options |
| F23 | Arguments were reported by 47% of women versus 37% of men, and 47% with versus 36% without children under 18 at home, among deception-affected respondents. Reported effects are retrospective; current household status need not match the circumstances at the time of deception. | Deception-affected ever-combined respondents, divided by gender/current household children June 28–30, 2021 according to official release; summary methodology prints 2020 | Original source [S03] Official release, argument comparisons and current-status footnotes |
Interpretation: an effect someone attributes to past deception is not an experimentally established consequence. The divorce response is especially unsuitable as a population divorce probability because it comes from a selected, affected base and questionnaire routing excluded currently never-married respondents from that option.
Why do Canadian percentages change with the denominator?
In the same January 2018 Canadian survey, removing not-applicable responses changes ever lying from 32% to 36% and current secrets from 27% to 34%. Both sets are published results; the larger figures do not represent a later increase. Financial Planning Standards Council (now FP Canada) / Credit Canada / Leger [S04].
| ID | Finding and interpretation | Population and actual data period | Original source and locator |
|---|---|---|---|
| F24 | 36% reported experiencing a listed financial-infidelity behavior by a current/former partner. Categories included hidden credit balances (14%), income-relative under-contribution (13%), income lies (8%), major purchases (7%), hidden cash (7%), taking all money (6%) and unexpected bankruptcy (4%). Historical 2018 measure. The listed behaviors include perceived under-contribution; not all fit a narrow intentional-concealment definition. | All Canadian survey respondents 2018-01-02 to 2018-01-05 | Original source [S04] Physical PDF p.5, Q2 |
| F25 | Reported victim experience was 47% at ages 18–34, 41% at 35–44, 41% at 45–54, 30% at 55–64 and 18% at 65+. The report’s broad age comparison was 44% at 18–54 versus 24% at 55+. All-respondent age groups; cross-sectional 2018 data, not evidence that a person’s victimization probability falls with aging. | Canadian respondents; all-respondent questions include not-applicable answers; eligible filtered bases differ by question 2018-01-02 to 2018-01-05 | Original source [S04] Physical PDF p.5, Q2 age chart and callout |
| F26 | 32% of all respondents said they had ever lied to a partner about money. Excluding not-applicable answers raised the published rate to 36%. Same survey, different denominator. This four-point difference is not a change over time or an improvement in precision. | All respondents versus respondents after removing not-applicable answers 2018-01-02 to 2018-01-05 | Original source [S04] Physical PDF p.6, Q3a all-respondent pie and filtered table |
| F27 | Among respondents excluding not-applicable answers, ever lying about money was 38% at ages 18–34, 41% at 35–44, 39% at 45–54 and 30% in both older groups. Historical data. Victim measure includes perceived under-contribution. Removing not-applicable responses changes the denominator. Report’s classical margin-of-error wording is not independently endorsed for an opt-in panel. | Age groups after removal of not-applicable answers 2018-01-02 to 2018-01-05 | Original source [S04] Physical PDF p.6, Q3a filtered age table |
| F28 | 27% of all respondents said they were currently keeping financial secrets from a partner. Excluding not-applicable answers raised the published rate to 34%. Current secrets differ from ever lying. The seven-point denominator effect is not a historical rise. | All respondents versus respondents after removing not-applicable answers 2018-01-02 to 2018-01-05 | Original source [S04] Physical PDF p.7, Q3b all-respondent pie and filtered table |
| F29 | Current financial secrets in the filtered base were reported by 34% at ages 18–34, 36% at 35–44, 41% at 45–54 and 30% in each older group. Historical data. Victim measure includes perceived under-contribution. Removing not-applicable responses changes the denominator. Report’s classical margin-of-error wording is not independently endorsed for an opt-in panel. | Age groups after removal of not-applicable answers 2018-01-02 to 2018-01-05 | Original source [S04] Physical PDF p.7, Q3b filtered age table |
| F30 | 72% of current secret-keepers versus 16% of others reported ever lying. In the reverse conditional comparison, 70% of ever-liars versus 15% of never-liars reported a current secret. Reverse conditional probabilities have different denominators. These associations do not establish causal direction. | Question-specific filtered bases and nested groups 2018-01-02 to 2018-01-05 | Original source [S04] Physical PDF pp.6–7, Q3a/Q3b relationship callouts |
| F31 | 41% of respondents classified as single versus 32% classified as married reported victim experience involving a former or current partner. Current relationship status differs from relationship status when a former-partner event occurred. This is not a comparison of risk within current single versus married couples. | All respondents classified as single or married 2018-01-02 to 2018-01-05 | Original source [S04] Physical PDF p.5, Q2 relationship-status callout |

The denominator increases are 4.0 and 7.0 percentage points (C11–C12). The current-secret percentage is approximately 1.26 times as large after filtering (34 ÷ 27; C13). That is a ratio of percentages with different eligible bases, not relative risk or change over time.
How do UK secrecy, financial knowledge and privacy differ?
Starling’s 2023 release reports direct secrecy alongside knowledge and account arrangements. The latter two can describe how a couple organizes money without establishing intentional deception. Starling Bank / Opinium [S05].
| ID | Finding and interpretation | Population and actual data period | Original source and locator |
|---|---|---|---|
| F32 | 30% of committed-relationship respondents, including 24% of married respondents, reported keeping a financial secret from their partner. Married respondents are a subset of the committed base. Measures refer to respondent reports, not a census of couples. | Committed-relationship respondents and married subset 2023-08-25 to 2023-09-01 | Original source [S05] Original release, main secrecy paragraph |
| F33 | 14% of committed respondents and 9% of married respondents did not know their partner’s income. Among committed respondents under 25, 41% knew their partner’s salary. The under-25 figure measures knowing, while the other two measure not knowing. Knowledge gaps are not proven deception. | Committed respondents, married subset and under-25 subset 2023-08-25 to 2023-09-01 | Original source [S05] Original release, partner salary paragraphs |
| F34 | 11% of married respondents versus 31% of engaged respondents did not know how much debt their partner had. Debt knowledge is not a direct measure of hidden debt. Subgroup counts and uncertainty intervals are not supplied. | Married and engaged respondent subsets 2023-08-25 to 2023-09-01 | Original source [S05] Original release, married versus engaged debt paragraph |
| F35 | Among respondents owning a home with a partner, 10% did not know ownership shares, 8% the outstanding mortgage and 9% monthly mortgage payments. Three knowledge questions, not a summed secret rate or evidence of legal ownership. No inference about deliberate concealment. | Respondents owning a home with a partner 2023-08-25 to 2023-09-01 | Original source [S05] Original release, shared-home knowledge paragraph |
| F36 | Entirely separate finances were reported by 19% of committed respondents and 12% of married respondents. Consensual financial independence is not financial infidelity. | Committed respondents and married subset 2023-08-25 to 2023-09-01 | Original source [S05] Original release, financial arrangement paragraph |
The engaged-versus-married gap in not knowing partner debt is 20.0 percentage points (31 − 11; C15). Cell sizes and uncertainty intervals are not published, so this should remain a qualified descriptive comparison.
What do the UK behavior and hidden-savings findings show?
Weightmans’ survey asks whether listed behavior occurred in the relationship, a broader reporting direction than admitting one’s own behavior. Its displayed 2025 update retains October 2023 fieldwork. Weightmans / OnePoll [S06].
| ID | Finding and interpretation | Population and actual data period | Original source and locator |
|---|---|---|---|
| F37 | Reported relationship occurrences included debt lies (17%), secret purchases (15%), unapproved lending (13%), secret gambling (12%), income lies (9%), secret savings accounts (8%) and missing joint money (7%). Respondents aged 25–64 in relationships. Occurrence in a relationship does not identify who acted or whether categories overlap. | Respondents aged 25–64 in a relationship 2023-10-06 to 2023-10-12 | Original source [S06] Original page, question beginning Which, if any … occurred in your relationship? |
| F38 | Undisclosed savings bands were £1–100 (8%), £101–500 (10%), £501–1,000 (8%), £1,001–5,000 (9%) and more than £5,000 (7%). Use published bands. The headline says 9% have over £1,000 but the body separately lists 9% at £1,001–5,000 and 7% above £5,000. This inconsistency is unresolved. Privacy motives and relationship safety were not adjudicated. | Respondents aged 25–64 in a relationship 2023-10-06 to 2023-10-12 | Original source [S06] Original page, How much money, if any … stashed away? paragraph |
| F39 | 24% said they did not know how much their partner earned. A knowledge question in a 25–64 relationship sample, not proof of hidden earnings; full item base is not separately shown. | Respondents aged 25–64 in a relationship 2023-10-06 to 2023-10-12 | Original source [S06] Original page, Key Survey Findings |
| F40 | 20% said they were fairly likely to leave their partner if the partner committed financial infidelity. Hypothetical likelihood, not actual breakup incidence, and only the stated fairly-likely response category. | Respondents aged 25–64 in a relationship 2023-10-06 to 2023-10-12 | Original source [S06] Original page, Key Survey Findings and explanatory paragraph |
A headline that needs qualification: the source’s savings bands imply 24% above £500 (8 + 9 + 7) and 16% above £1,000 (9 + 7), assuming one mutually exclusive band question and a common base. The page’s headline instead says 9% above £1,000. We preserve the bands, flag the inconsistency and do not substitute an unqualified replacement headline. Calculations C17–C18 document the arithmetic.
What do the Australian sources actually measure?
The Compare the Market survey concerns money lies to a partner or family member. Its detailed lie-type table is conditional on admitting a money lie. Finder’s separate survey concerns judgments about cheating, not admissions. Compare the Market Australia [S07]; Finder Australia [S08].
| ID | Finding and interpretation | Population and actual data period | Original source and locator |
|---|---|---|---|
| F41 | 21% admitted lying to a partner or family member about finances. Includes family relationships, not just romantic partners. Sponsor methods do not support calling this a romantic-only national prevalence estimate. | Australian adults; money lies to a partner OR family; types among admitted money-liars December 2024 | Original source [S07] Original release, opening paragraphs and survey footnote |
| F42 | Among admitted money-liars, 32.86% lied about spending, 24.88% about debt and 23.94% about coffee/takeaway spending. Conditional overlapping types, not percentages of all Australian adults. Source precision is preserved for reproducibility, not a claim of that level of population accuracy. | Respondents admitting a money lie to a partner or family member December 2024 | Original source [S07] Original release, Data for journalists table |
| F43 | Among admitted money-liars, 23.00% lied about savings, 22.53% about income and 19.24% about clothing spending. These are conditional item percentages. Multiple topics can apply to one respondent. | Respondents admitting a money lie to a partner or family member December 2024 | Original source [S07] Original release, Data for journalists table |
| F44 | Among admitted money-liars, the table reports 14.08% for alcohol, 13.14% for gambling, 11.73% for having a credit card and 7.51% for a bank account. Use named data-table values. The narrative’s 14% gambling figure conflicts with table 13.14%; 14.08% belongs to alcohol. | Respondents admitting a money lie to a partner or family member December 2024 | Original source [S07] Original release, Data for journalists table, alcohol through bank-account rows |
| F45 | 21% rated financial infidelity worse than physical cheating, while 79% selected physical cheating as worse. Published binary comparison does not supply an equal category. It cannot be compared directly with a US at-least-as-bad percentage. | Survey respondents; generation subsets as labelled by publisher January 2024 | Original source [S08] Original release, main comparison and table |
| F46 | Financial infidelity was rated worse than physical cheating by 23% of boomers, 22% of millennials, 21% of Gen X and 18% of Gen Z. Attitude, not behavior. Generation definitions and answer options differ from the Bankrate surveys. | Finder generation groups; exact age cutoffs and cell sizes not supplied on release January 2024 | Original source [S08] Original release, generation comparison table |
Among Compare the Market’s admitted money-liars, the spending-versus-debt gap is 8.0 percentage points after rounding (32.86 − 24.88; C19). This is not an eight-point gap across all Australian adults. We use the named data table for gambling because its 13.14% conflicts with the narrative’s 14%.
What does recent academic research show about financial secrecy?
The 2026 journal-issue paper examines differences between partners’ financial-infidelity proneness. Its app pilot and selected couple samples add evidence about associations and measurement, rather than a national rate of cheating. The accessible main article does not report fieldwork dates. Hristina Nikolova, Jenny G. Olson and Joe J. Gladstone [S09].
| ID | Finding and interpretation | Population and actual data period | Original source and locator |
|---|---|---|---|
| F47 | In the 622-couple app pilot, the account-visibility proxy and reported FI-proneness were positively correlated, r = 0.21 (p < .001). Account-visibility settings are a proxy, not a determination that someone deceived a partner. Correlation is not prevalence, causation or 21% cheating. | 622 selected couples using a financial app; survey from one partner Fieldwork dates not reported in accessible main article | Original source [S09] Author PDF p.6, pilot measure validation |
| F48 | In Study 2, greater partner FI-proneness asymmetry was associated with lower financial well-being (b = −0.57, SE 0.11) and relationship satisfaction (b = −0.44, SE 0.11). Reported b coefficients from observational regressions, not percentages or causal effects. Financial well-being and satisfaction use different scales; effect magnitudes are not directly comparable. | Study 2 selected US married male–female MTurk couples Fieldwork dates not reported in accessible main article | Original source [S09] Author PDF p.12, section 7.2 Financial and relationship well-being |
| F49 | In Study 2, greater FI-proneness asymmetry was associated with more individualized financial goals (b = 0.87, SE 0.13; p < .001). Goals scored from shared toward individualized on a reversed 1–7 scale. Observational mediation does not prove the mechanism causes outcomes or that individual goals are dishonest. | Study 2 selected US married male–female MTurk couples Fieldwork dates not reported in accessible main article | Original source [S09] Author PDF p.12, section 7.2 Mediation via individualized (vs. shared) financial goals |
The reported regression coefficients are not percentages. They should not become claims that secrecy causes a fixed loss in wealth, or that encouraging shared access to every account is a proven intervention. The observational associations do not establish either conclusion.
What does the 2026 Canadian client study add?
Wealthsimple’s release adds a recent customer perspective with limited published methods. It belongs alongside a clear sample warning, rather than replacing population research. Wealthsimple [S10].
| ID | Finding and interpretation | Population and actual data period | Original source and locator |
|---|---|---|---|
| F50 | About 14% of the couples Wealthsimple surveyed admitted financial infidelity. Limited-method client result, not Canadian population prevalence. Approximate figure; question wording, eligibility and couple base are not supplied. April year inferred from 2026 release context. | Coupled Wealthsimple client respondents; overall survey also included singles and other households April, year inferred as 2026 from release context; exact dates unstated | Original source [S10] Original newsroom article, Financial infidelity is more common … paragraph |
No decline from Canada’s 2018 figures can be inferred: the client population, definition, eligibility and fieldwork differ.
What do UK young adults report about money and trust?
Experian’s January 2024 campaign survey covers people aged 18–35. It includes admissions, partner-attributed incidents and broader financial strain. Those are different outcomes. Experian UK / 3Gem [S11].
| ID | Finding and interpretation | Population and actual data period | Original source and locator |
|---|---|---|---|
| F51 | 27% said they had lied to a partner about their financial situation. People aged 18–35 in this campaign survey; item-specific eligible relationship base is not supplied. Not an all-UK-adult rate. | People aged 18–35; item-specific relationship eligibility not separately published January 2024 | Original source [S11] Original release, narrative paragraph on lying about financial situation |
| F52 | 29% had discovered that a partner made a big purchase without telling them. Partner-attributed discovery, not own admission. Big purchase is not given a uniform monetary threshold. | People aged 18–35; item-specific relationship eligibility not separately published January 2024 | Original source [S11] Original release, partner big-purchase paragraph |
| F53 | 15% said a partner had put bills in their name and failed to pay, damaging their credit score. Self-reported credit damage, not independently linked credit records. This may involve coercion or abuse; do not frame all such cases as ordinary mutual disagreement. | People aged 18–35; item-specific relationship eligibility not separately published January 2024 | Original source [S11] Original release, bills and credit-score paragraph |
| F54 | 19% did not trust a partner enough to open a joint account, while 51% were cautious about the partner’s spending habits. Attitudes or concerns, not proven financial deception. Separate accounts can be a consensual and appropriate arrangement. | People aged 18–35; item-specific relationship eligibility not separately published January 2024 | Original source [S11] Original release, joint account and spending-habit paragraphs |
| F55 | 19% reported a relationship ending because of financial troubles; 37% said a partner’s financial anxiety negatively affected the relationship. Financial troubles and anxiety are broader than financial infidelity. These figures must not be labelled breakup rates caused by hidden money. | People aged 18–35; item-specific relationship eligibility not separately published January 2024 | Original source [S11] Original release, relationship-end and financial-anxiety paragraphs |
For broader context, see MyLittleDesire’s relationship satisfaction, trust and communication research and cohabitation and living-together statistics. Money secrecy within an existing relationship also differs from romance scams and catfishing.
Which original comparisons are useful to journalists?
MyLittleDesire contributes the side-by-side presentation and reproducible arithmetic below. The underlying surveys belong to their original researchers. Some contrasts are already apparent in or discussed by those researchers; these are editorial comparisons, not newly discovered scientific effects.
| ID | Comparison | Result | Citing qualification |
|---|---|---|---|
| C01 | Gen Z: behavior minus at-least-as-bad attitude | +4.0 percentage points | Aggregate percentages from different questions. Does not identify individual inconsistency; no new significance test. Bankrate relationship respondents; Dec 9–11, 2024 Bankrate / YouGov [S02] |
| C03 | Gen X: behavior minus at-least-as-bad attitude | -12.0 percentage points | Aggregate percentages from different questions. Does not identify individual inconsistency; no new significance test. Bankrate relationship respondents; Dec 9–11, 2024 Bankrate / YouGov [S02] |
| C05 | Gen Z minus boomer past/current behavior | 37.0 percentage points | Cross-sectional cohorts; not an effect of age, and not nationally inferred subgroup precision. Bankrate relationship respondents; December 2024 Bankrate / YouGov [S02] |
| C07 | Partner-attributed minus own hidden major purchase | 6.0 percentage points | Same reporters, not matched partner reports. This is not a measure of who is more truthful. NEFE ever-combined respondents; 2021 release (summary year conflict) National Endowment for Financial Education / The Harris Poll [S03] |
| C08 | Own minus partner-attributed hidden cash | 5.0 percentage points | Different reporting directions; behavior categories may overlap. NEFE ever-combined respondents; 2021 release (summary year conflict) National Endowment for Financial Education / The Harris Poll [S03] |
| C11 | Ever lied: filtered minus all-respondent percentage | 4.0 percentage points | Denominator effect within the same survey, not a temporal increase. Leger Canada January 2018; n=1,367 filtered versus 1,550 all Financial Planning Standards Council (now FP Canada) / Credit Canada / Leger [S04] |
| C12 | Current secret: filtered minus all-respondent percentage | 7.0 percentage points | Denominator effect within the same survey, not a temporal increase. Leger Canada January 2018; n=1,230 filtered versus 1,550 all Financial Planning Standards Council (now FP Canada) / Credit Canada / Leger [S04] |
| C15 | Unknown partner debt: engaged minus married | 20.0 percentage points | Knowledge gap, not confirmed hidden debt; subgroup sample sizes not supplied. Starling/Opinium August–September 2023, separate relationship-status groups Starling Bank / Opinium [S05] |
| C19 | Spending minus debt lies within admitted money-liars | 8.0 percentage points | Conditional overlapping responses. Does not compare all-adult prevalence or show mutually exclusive motives. Compare the Market Australia December 2024; partner OR family lies Compare the Market Australia [S07] |
| C20 | Mutual complete knowledge: boomers minus Gen Z | 20.0 percentage points | Cross-sectional knowledge difference; not a deception gap or effect of aging. Bankrate relationship respondents, December 2025 Bankrate / YouGov [S01] |
What cannot be concluded from these statistics?
- No survey here measures realized behavior in 2027. A publication-year label does not change a study’s field dates.
- The available US, UK, Canadian and Australian studies do not form a harmonized country ranking. Populations, definitions, response options and periods differ.
- Self-report may understate stigmatized behavior, but these data do not quantify the size or direction of every reporting error.
- Secret accounts, mutually agreed separate accounts, independent spending and safety-related privacy must not be treated as interchangeable.
- Commercially commissioned research is attributed to its sponsor. Several releases do not provide full questionnaires, recruitment details, weighting or conditional sample counts.
- Percentages from different questions cannot establish an individual-level link without a cross-tabulation. Cross-sectional associations and retrospective attributions do not establish causation.
How were the findings selected and checked?
We reviewed original sponsor releases, research reports and accessible academic manuscripts available by October 24, 2026. Each included finding was checked against its original published page, table or report passage. The database records source URL, publication and data dates, population, sample information, methods, locator, definition, caveats and verification status.
Inclusion means the value is verified as reported; it does not independently validate the underlying fieldwork or make every sample nationally representative. Related response categories remain grouped. Eleven numeric research programs are represented in 12 source records, including a separate definition paper. Bankrate contributes two surveys run with YouGov; the records are not 12 wholly independent research institutions.
Historical 2018, 2021 and 2023 findings are retained because they explain definitions, reporting directions or denominators. They are not presented as current-year prevalence. The Wealthsimple client result has a separate limited-method flag. Uncertain claims and unresolved source conflicts are excluded or explicitly qualified in the audit.
Percentages are stored on a 0–100 scale. Differences use percentage points; ratios are dimensionless. Calculations use the published, rounded inputs and have reader-friendly display precision. Chart data reproduce those inputs without combining incompatible surveys into a trend. The workbook links editable inputs to results and chart-data tables.
Complete original sources
- S01 · Bankrate / YouGov. Financial Infidelity Survey, 2026 release. Published: 2026-01-29. Data period: 2025-12-02 to 2025-12-08. Sample: 2,564 adults; relationship subset 1,208; subgroup/reason bases not published. Online non-probability YouGov panel; demographic quotas and weighting. Attitudes use all adults. Knowledge and secrecy questions use the relationship subset. Secret types may overlap. Fieldwork predates the 2026 release. Supporting original material: Original document 1, Original document 2.
- S02 · Bankrate / YouGov. Financial Infidelity Survey, 2025 release. Published: 2025-01-27. Data period: 2024-12-09 to 2024-12-11. Sample: 2,217 adults; relationship subset 1,089; generation cell sizes not published. Online YouGov non-probability panel; demographic quotas and weighting described in official press release. Ever/current categories overlap; rounded components need not sum to a displayed net. Separate accounts do not by themselves constitute deception. Supporting original material: Original document 1, Original document 2.
- S03 · National Endowment for Financial Education / The Harris Poll. 2021 Financial Infidelity Survey. Published: Summary dated 2021-07-07; release 2021-11-18. Data period: June 28–30, 2021 according to official release; summary methodology prints 2020. Sample: 2,073 adults; ever combined 1,248; own deception 555; own and/or partner deception 650. Opt-in online Harris panel; demographic and propensity-score weighting. Official documents conflict on fieldwork year. Use the release’s 2021 attribution with this discrepancy visible. Self and partner reports are from the same respondents, not matched partners. Reasons/effects permit multiple responses. Supporting original material: Original document 1, Original document 2.
- S04 · Financial Planning Standards Council (now FP Canada) / Credit Canada / Leger. Financial Infidelity: Leger omnibus report. Published: 2018-01-09. Data period: 2018-01-02 to 2018-01-05. Sample: 1,550 all respondents; ever-lied filtered base 1,367; current-secret filtered base 1,230. LegerWeb online panel; methodology on physical PDF page 3. Historical data. Victim measure includes perceived under-contribution. Removing not-applicable responses changes the denominator. Report’s classical margin-of-error wording is not independently endorsed for an opt-in panel.
- S05 · Starling Bank / Opinium. Financial infidelity? A quarter of married people keep financial secrets from their spouse. Published: 2023-09-19. Data period: 2023-08-25 to 2023-09-01. Sample: 2,191 UK adults; committed subset 1,577; smaller cell sizes not disclosed. Opinium survey; recruitment, mode and weighting not detailed in release. Respondents are not necessarily matched couples. Not knowing a figure is not proof of intentional concealment. Some hidden-item percentages have unclear conditional bases and are excluded.
- S06 · Weightmans / OnePoll. Financial infidelity across the UK. Published: Originally 2023-11-15; displayed update 2025-04-25. Data period: 2023-10-06 to 2023-10-12. Sample: 2,000 respondents; item-specific bases not separately published. OnePoll survey; sampling, weighting and full questionnaire not supplied. Relationship occurrence is not necessarily own admission. Hypothetical leaving is not an observed breakup. Savings headline conflicts with published bands; use the bands and flag the discrepancy.
- S07 · Compare the Market Australia. One in five Aussies admit to financial infidelity – the financial fibs we tell revealed. Published: 2025-03-20. Data period: December 2024. Sample: 1,010 adults; achieved conditional liar subset not disclosed. Sponsor-published survey; recruitment, mode and weighting not disclosed. Not romantic-partner-only. Detailed table percentages are conditional, may overlap and are not percentages of all adults. Gambling narrative rounds inconsistently with the named data table; use table 13.14%.
- S08 · Finder Australia. Your body or your cash: 1 in 5 Australians say money cheats are worse than adulterers. Published: 2024-04-09. Data period: January 2024. Sample: 1,096 respondents; generation cell sizes not published. Finder survey; recruitment, weighting and full questionnaire not detailed on release. Published comparison supplies worse-financial versus worse-physical categories without an equal option. Not interchangeable with Bankrate’s at-least-as-bad measure. No population extrapolation used.
- S09 · Hristina Nikolova, Jenny G. Olson and Joe J. Gladstone. Financial infidelity asymmetry predicts couples’ financial and relationship well-being. Published: Online 2025-07-12; journal issue June 2026, 43(2):362–382. Data period: Fieldwork dates not reported in accessible main article. Sample: Pilot 622 couples; Study 2 165 couples / 330 individuals. Peer-reviewed multi-study research; observational app pilot and couple surveys; additional vignette experiments not used for prevalence. Selected samples are not national prevalence data. Pilot account-visibility proxy is not adjudicated deception. Study 2 coefficients are reported regression b values, not percentages or causal financial losses. Main article Study 1 N/df inconsistency is not resolved here. Supporting original material: DOI, Original document 2.
- S10 · Wealthsimple. The Market Mindset: How Canadian households split, share, and hide their finances. Published: 2026-06-04. Data period: April, year inferred as 2026 from release context; exact dates unstated. Sample: 1,742 clients overall; coupled achieved base not published. Client survey; recruitment, weighting, age/residency eligibility and questionnaire not disclosed. Approximately 14% is a sponsor-reported client-couple result. It is not a nationally representative Canadian estimate or a trend comparison with Leger 2018.
- S11 · Experian UK / 3Gem. The Cost of Loving: new data reveals the rise of financial infidelity. Published: 2024 campaign; exact publication day not independently confirmed. Data period: January 2024. Sample: 2,000 respondents; conditional item bases not disclosed. 3Gem commissioned survey; full questionnaire, recruitment, mode and weighting not supplied. Young-adult campaign research, not all UK adults. Reported credit harm is self-report, not administrative credit data. Financial trouble is broader than financial infidelity. Companion page is the same study, not an independent sample. Supporting original material: Original document 1.
- S12 · Emily N. Garbinsky, Joe J. Gladstone, Hristina Nikolova and Jenny G. Olson. Love, Lies, and Money: Financial Infidelity in Romantic Relationships. Published: Online 2019; June 2020, Journal of Consumer Research 47(1):1–24. Data period: Multiple studies; no one field period used in this resource. Sample: Multiple study-specific samples; not used for a national prevalence estimate. Peer-reviewed conceptual and scale-development research. Definition and measurement source only; the FI-proneness instrument is not a population incidence rate. Instrument text is not reproduced. Supporting original material: DOI, Original document 2.
How should this resource be cited?
When citing a survey result, credit the original research organization and retain its year, population and definition. Cite MyLittleDesire for the synthesis, charts or calculations you use, and consult the linked original source to verify the underlying research.
MyLittleDesire. (2026). Financial Infidelity Statistics 2027: Hidden Money, Debt & Trust (2027 planning edition; sources reviewed October 24, 2026). https://mylittledesire.com/financial-infidelity-statistics/. Add your actual access date when required by your citation style.