
Work friendships can provide companionship, practical help and a reason to stay in a job. The evidence also shows why friendship should not stand in for every other part of working life. People with close colleagues can feel engaged and still plan a job search; professional boundaries can coexist with valuing connection.
The resource contains 60 grouped findings, four original chart designs and 20 descriptive calculations. Eleven original-source records cover 13 survey waves: the Canadian and US Express releases each report separate employer and job-seeker surveys. Seven principal research publishers or commissioning organizations are represented; fieldwork providers overlap, and these are not independent replications. Some findings measure related support, mentorship or belonging rather than friendship itself.
What are the key workplace friendship statistics?
65%
64% / 49%
Had a close friend at work in Pew’s February 2023 survey of US employees who were not self-employed. Pew Research Center / Ipsos [S01].
Were highly satisfied with coworkers / their job overall in Pew’s separate October 2024 survey. Different questions. Pew Research Center / SSRS [S02].
49% / 42%
78% vs 32%
Close personal friends had the highest always-engaged rate and very-likely-to-job-search rate in KPMG/CivicScience’s April 2026 study. Different item bases. KPMG US / CivicScience [S03].
Felt their manager cared about them among close personal friends versus non-socializers in that study. Association only. KPMG US / CivicScience [S03].
57%
≈18.2%
Preferred a hypothetical lower-pay job with close friendships over a higher-pay job without them in KPMG’s 2025 professional survey. KPMG US [S04].
The reduction from a salary index of 110 to 90, relative to the higher offer. The offers are 20 market-baseline points apart (C01–C02). KPMG US [S04].
75%
64%
Said finances or the economy inhibited social meetings with colleagues in the restricted KPMG professional cohort. KPMG US [S04].
Of Canadian job seekers recalled staying at a job longer than intended because of work friendships; late-2024 fieldwork. Express Employment Professionals / The Harris Poll, Canada [S05].
75% vs 50%
40% vs 30%
Reported staying longer among Gen Z versus Boomer Canadian job seekers. Subgroup counts were not published. Express Employment Professionals / The Harris Poll, Canada [S05].
Women versus men reported emotional support from friendly colleagues in Santander’s January 2025 UK survey. Santander UK / OnePoll [S07].
82%
87% vs 74%
Of Australian participants trusted colleagues in Randstad’s October 2025 talent survey, reported in its 2026 edition. Trust is not friendship prevalence. Randstad / Evalueserve [S09].
Reported belonging when in their preferred work location versus outside it in APA’s 2024 survey. This is preference fit, not remote versus office. American Psychological Association / The Harris Poll [S10].
What do workplace friendship statistics actually measure?
Friendship, supportive relationships and retention are separate measures. Before quoting a percentage, identify who answered, the question, its timeframe and whether the number describes a preference, a recalled experience or an observed outcome.
| Measure | What it describes | Interpretation boundary |
|---|---|---|
| Current close friend | Having a close friend at the present workplace | Different from ever making friends during a career or strongly endorsing a best-friend item. |
| Mentor or professional contact | Developmental guidance or comfort seeking help | A mentor need not be a personal friend; approach comfort does not measure actual mentor access. |
| Relationship category | Close personal, workday, casual or no socializing in a specific survey | Categories depend on that study’s definitions, not a universal friendship scale. |
| Retention belief or intention | What an employer expects or a job seeker says they would do | Does not measure actual future stays or departures. |
| Recalled tenure decision | A person’s explanation of a previous job decision | Not a longitudinal estimate of the effect of friendship on turnover. |
| Hypothetical salary choice | Preference between specified employer scenarios | Not an observed pay cut or an identical question to accepting an unspecified amount less. |
| Belonging, respect and trust | Related features of a social work environment | None alone establishes that a worker has a close friend. |
How many employees have close friends and mentors at work?
Pew found that most eligible US employees had a close work friend in February 2023, while fewer had a mentor. Its report excludes self-employed workers and focuses on people with one job or a primary job. The findings are a dated benchmark rather than a new 2027 estimate. Pew Research Center / Ipsos [S01].
| ID | Finding and qualification | Population, actual period and sample | Original source and locator |
|---|---|---|---|
| F01 | 65% had at least one close friend at work; 35% did not. Not self-employed; one or primary job. A close friend is different from a best-friend strong-agreement item. | Employed adults 18+, not self-employed, with one job or a primary job 2023-02-06 to 2023-02-12 5,188 in the report analysis; subgroup counts not printed beside selected findings | Original research [S01] PDF physical pp.13, 38 / printed pp.12, 37; WRKFRIEND |
| F02 | 68% of women and 62% of men reported a close work friend. Separate gender groups; unadjusted descriptive rates. No explanation of why the difference exists is inferred. | Employed adults 18+, not self-employed, with one job or a primary job 2023-02-06 to 2023-02-12 5,188 in the report analysis; subgroup counts not printed beside selected findings | Original research [S01] PDF physical p.14 / printed p.13, gender paragraph |
| F03 | 44% had a workplace mentor; 55% did not. Mentor means an experienced person who cares about professional development. Rounded categories need not total 100%. | Employed adults 18+, not self-employed, with one job or a primary job 2023-02-06 to 2023-02-12 5,188 in the report analysis; subgroup counts not printed beside selected findings | Original research [S01] PDF physical pp.13, 38 / printed pp.12, 37; WRKMENTOR |
| F04 | 48% of women and 41% of men reported having a mentor. Mentorship and friendship are different constructs; subgroup n unavailable beside finding. | Employed adults 18+, not self-employed, with one job or a primary job 2023-02-06 to 2023-02-12 5,188 in the report analysis; subgroup counts not printed beside selected findings | Original research [S01] PDF physical p.14 / printed p.13 |
| F05 | Mentor access was 56% at ages 18–29, 46% at 30–49, 34% at 50–64 and 33% at 65+. Age groups in one historical cross-section, not a cohort’s progression over a career. | Employed adults 18+, not self-employed, with one job or a primary job 2023-02-06 to 2023-02-12 5,188 in the report analysis; subgroup counts not printed beside selected findings | Original research [S01] PDF physical p.14 / printed p.13 |
The gender difference was 6 percentage points for close-friend prevalence and 7 points for mentor access (C15–C16). These describe different questions within the same survey. They do not show whether a particular friend also served as a mentor. The age pattern in mentorship is a cross-section, rather than evidence that an individual loses access as they grow older.
What other kinds of support did workers report?
Workers distinguished personal relationships from respect, authenticity and organizational care. Those broader measures help describe the setting in which friendships may develop, but should not be renamed friendship rates.
| ID | Finding and qualification | Population, actual period and sample | Original source and locator |
|---|---|---|---|
| F06 | 67% were highly satisfied with coworker relationships and 62% with their manager relationship. Highly satisfied means extremely or very. Separate questions can both be endorsed. | Employed adults 18+, not self-employed, with one job or a primary job 2023-02-06 to 2023-02-12 5,188 in the report analysis; subgroup counts not printed beside selected findings | Original research [S01] PDF physical p.5 / printed p.4; satisfaction chart |
| F07 | 78% said they were treated with respect at work all or most of the time. Respect does not establish a personal friendship or good management in every other respect. | Employed adults 18+, not self-employed, with one job or a primary job 2023-02-06 to 2023-02-12 5,188 in the report analysis; subgroup counts not printed beside selected findings | Original research [S01] PDF physical p.13 / printed p.12, workplace-experience chart |
| F08 | 72% said they could be themselves at work all or most of the time. Self-reported authenticity is not the same measure as friend counts or clinical wellbeing. | Employed adults 18+, not self-employed, with one job or a primary job 2023-02-06 to 2023-02-12 5,188 in the report analysis; subgroup counts not printed beside selected findings | Original research [S01] PDF physical p.13 / printed p.12 |
| F09 | 52% felt their employer cared about their wellbeing a great deal or fair amount; 28% said some and 20% little or not at all. Organizational care is distinct from a supervisor’s personal care or a coworker friendship. | Employed adults 18+, not self-employed, with one job or a primary job 2023-02-06 to 2023-02-12 5,188 in the report analysis; subgroup counts not printed beside selected findings | Original research [S01] PDF physical pp.13, 38 / printed pp.12, 37; WRKCARE |
For the broader subject of human friend counts, friendship quality and social support, see our friendship statistics resource.
Can people like their coworkers more than their job overall?
Pew’s October 2024 findings show higher satisfaction with coworker relationships than with the job overall. These are separate ratings, so their difference is not the share of people who like colleagues but dislike their job.
| ID | Finding and qualification | Population, actual period and sample | Original source and locator |
|---|---|---|---|
| F10 | 64% were highly satisfied with coworker relationships; 59% with their manager relationship. These items exclude self-employed workers. Do not use the overall n as an achieved item n. | US employees who are not self-employed 2024-10-07 to 2024-10-13 5,273 overall; non-self-employed and item-specific counts not printed beside cited charts | Original research [S02] PDF physical p.13 / printed p.12 |
| F11 | 86% said coworkers and 82% said supervisors treated them with respect all or most of the time. Relationship-specific respect differs from the general workplace-respect item in 2023; no direct trend calculated. | US employees eligible for coworker/supervisor items 2024-10-07 to 2024-10-13 5,273 overall; non-self-employed and item-specific counts not printed beside cited charts | Original research [S02] PDF physical p.17 / printed p.16, respect by supervisors and coworkers |
| F12 | 49% of non-self-employed workers were highly satisfied with their job overall. Overall job satisfaction is a different outcome from satisfaction with coworkers. Rate differences cannot identify which people are happy with colleagues but not their jobs. | US employees who are not self-employed 2024-10-07 to 2024-10-13 5,273 overall; non-self-employed and item-specific counts not printed beside cited charts | Original research [S02] PDF physical p.13 / printed p.12, overall-job row |
The coworker-versus-overall-job difference is 15 percentage points (C17). It is a comparison of marginal rates. The respect questions also exclude respondents without the relevant supervisor or coworkers. They should not be compared directly with the earlier general workplace-respect item as a trend.
Does workplace friendship guarantee that people will stay?
The 2026 KPMG/CivicScience study shows that high engagement can coexist with job-search intentions at the group level. The close-personal-friend group led both measures, which used different question samples. The chart preserves the actual next-year search-intention wording.
| ID | Finding and qualification | Population, actual period and sample | Original source and locator |
|---|---|---|---|
| F13 | Always-engaged rates were 49% for close personal friends, 22% for workday friends, 31% for casual acquaintances and 35% for non-socializers. Self-described relationship groups; engagement is a frequency response, not Gallup’s engagement index. The pattern is not a steadily increasing ladder. | Employed US adults, grouped by self-described workplace relationships 2026-04-17 to 2026-04-22 741 item respondents; four relationship-cell n not shown | Original research [S03] PDF p.10, engagement frequency chart |
| F14 | Very likely to job-search in the next year: 42% close personal friends, 16% workday friends, 13% casual acquaintances and 16% non-socializers. Very likely intention, not current search, an actual departure, or a causal effect of having friends. | Employed US adults, grouped by self-described workplace relationships 2026-04-17 to 2026-04-22 657 item respondents; relationship-cell n not shown | Original research [S03] PDF p.9, next-12-month job-search question |
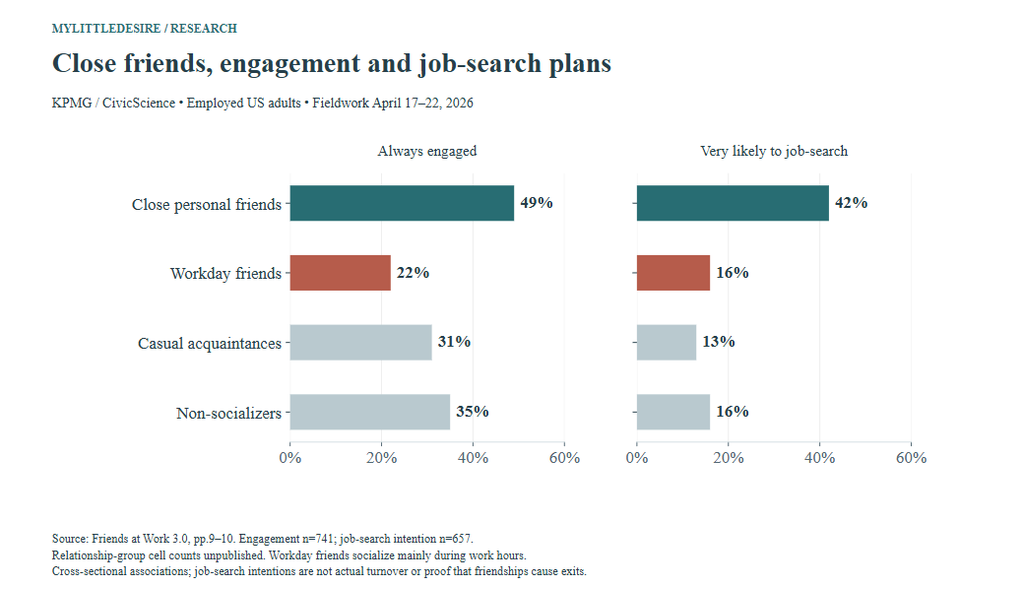
The close-friend group exceeded non-socializers by 14 percentage points on always feeling engaged and by 26 points on being very likely to job-search (C06–C07). Their search-intention rate was approximately 2.63 times the non-socializer rate (C08). None is a causal estimate of turnover. The study does not establish the person-by-person overlap between engagement and search plans.
The engagement results also resist a simple more-social-is-always-better interpretation: workday friends had a lower always-engaged rate than non-socializers. Different group composition and unmeasured circumstances may matter. This study’s frequency question is not Gallup’s engagement classification.
How do care, trust and emotional experiences differ by relationship group?
Close personal friends reported more manager care and stronger trust, while also reporting more intense positive and negative work emotions. The four groups are close personal friends, friends mainly during work hours, casual acquaintances and non-socializers.
| ID | Finding and qualification | Population, actual period and sample | Original source and locator |
|---|---|---|---|
| F15 | Manager-care agreement was 78%, 71%, 60% and 32% across close friends, workday friends, casual acquaintances and non-socializers. Perceptions by selected groups; age, management status, role and other confounders are not held constant. | Employed US adults, grouped by self-described workplace relationships 2026-04-17 to 2026-04-22 681+ respondents across statement items; exact cell n unavailable | Original research [S03] PDF p.13, manager-care statement |
| F16 | Work-mattering agreement was 84%, 75%, 75% and 62% across the same four relationship groups. Meaning is not objective productivity. This is a separate statement from manager care. | Employed US adults, grouped by self-described workplace relationships 2026-04-17 to 2026-04-22 681+ across statement items; exact cell n unavailable | Original research [S03] PDF p.13, personally meaningful work statement |
| F17 | A-lot trust in the company was 47%, 21%, 26% and 19%; trust in the CEO was 39%, 24%, 31% and 14% across the four groups. Two distinct questions with different item samples. No respondent overlap or causal trust effect inferred. | Employed US adults, grouped by self-described workplace relationships 2026-04-17 to 2026-04-22 Company-trust item n=618; CEO-trust item n=602; cell n unavailable | Original research [S03] PDF pp.11–12, company and CEO trust charts |
| F18 | Very-happy-with-job rates were 55% for close friends and 28% in each of the other three groups. Happiness with a job differs from always feeling engaged, emotional-state measures and a clinical outcome. | Employed US adults, grouped by self-described workplace relationships 2026-04-17 to 2026-04-22 982 item respondents; cell n unavailable | Original research [S03] PDF p.8, current-job happiness question |
| F19 | Strong happiness at work was 82%, 69%, 63% and 53%; strong stress at work was 63%, 56%, 51% and 44% across the four groups. Use work-specific values, not the adjacent general-emotions table. Positive and negative feelings can coexist; no claim the same people endorsed both. | Employed US adults, grouped by self-described workplace relationships 2026-04-17 to 2026-04-22 Exact work-emotion item/cell counts not supplied on p.7 | Original research [S03] PDF p.7, right-hand work-emotions table |
| F20 | 37% of non-socializers felt they had nobody they could talk to about their mental health. The question asks about anyone in their lives, not only coworkers. It is not proof that workplace friendship would resolve that gap. | Employed US adults in non-socializer relationship group 2026-04-17 to 2026-04-22 558 answered overall multiple-response support item; non-socializer cell n unavailable | Original research [S03] PDF p.14; original May 14 release, non-socializer paragraph |
The manager-care difference between close friends and non-socializers was 46 percentage points (C09). Role, age, managerial responsibility and other possible confounders were not held constant by this descriptive comparison. Positive and negative emotions are separate outcomes and may occur at different times.
The mental-health support question asks whether respondents have anyone in their lives to talk to. It does not ask only about coworkers. Workplace socializing should not be presented as a proven remedy for lacking a confidant.
Would workers accept lower pay to work with friends?
KPMG’s 2025 professional survey reports a preference between specified hypothetical jobs. It does not show people actually accepting pay cuts. The respondents were full-time office-based professionals in organizations with at least 100 employees, with the C-suite excluded.
| ID | Finding and qualification | Population, actual period and sample | Original source and locator |
|---|---|---|---|
| F21 | 87% rated close workplace friendships very important. Publisher NET uses the top two categories of a seven-point scale. Applies to the restricted professional sample, not all Americans. | Full-time office-based professionals, entry level to SVP, excluding C-suite; organizations with at least 100 employees 2025-06-17 to 2025-06-30 1,019 respondents | Original research [S04] PDF p.7, importance tracking chart |
| F22 | 98% had at least one close work friend; the reported mean was 4.5 friends. Current-company friends among full-time office-based professionals in organizations with 100+ employees. The public sample’s very high rate cannot be substituted for a general-worker prevalence estimate. | Full-time office-based professionals, entry level to SVP, excluding C-suite; organizations with at least 100 employees 2025-06-17 to 2025-06-30 1,019 respondents | Original research [S04] PDF p.8, current-company friend-count item |
| F23 | 57% preferred a hypothetical job 10% below market with close friendships over one 10% above market without close friendships. A conjoint/hypothetical choice, not an actual salary sacrifice. The offers differ by 20 market-baseline percentage points, or about 18.2% relative to the higher offer; no universal valuation inferred. | Full-time office-based professionals, entry level to SVP, excluding C-suite; organizations with at least 100 employees 2025-06-17 to 2025-06-30 1,019 respondents | Original research [S04] PDF pp.5–6, employer-choice scenario |
| F24 | 87% rated friendship-enabling culture very important to staying, and 90% to considering a new job. Top-two response categories. Importance is different from observed retention or the share who actually left. | Full-time office-based professionals, entry level to SVP, excluding C-suite; organizations with at least 100 employees 2025-06-17 to 2025-06-30 1,019 respondents | Original research [S04] PDF p.22, two job-decision questions |
| F25 | 75% said their finances or the economy inhibited social meetings with colleagues to some or a great extent. Meals, drinks and events outside work are examples in the question. It is not proof that respondents lack any friends or that socializing requires spending money. | Full-time office-based professionals, entry level to SVP, excluding C-suite; organizations with at least 100 employees 2025-06-17 to 2025-06-30 1,019 respondents | Original research [S04] PDF p.19, financial-situation item |
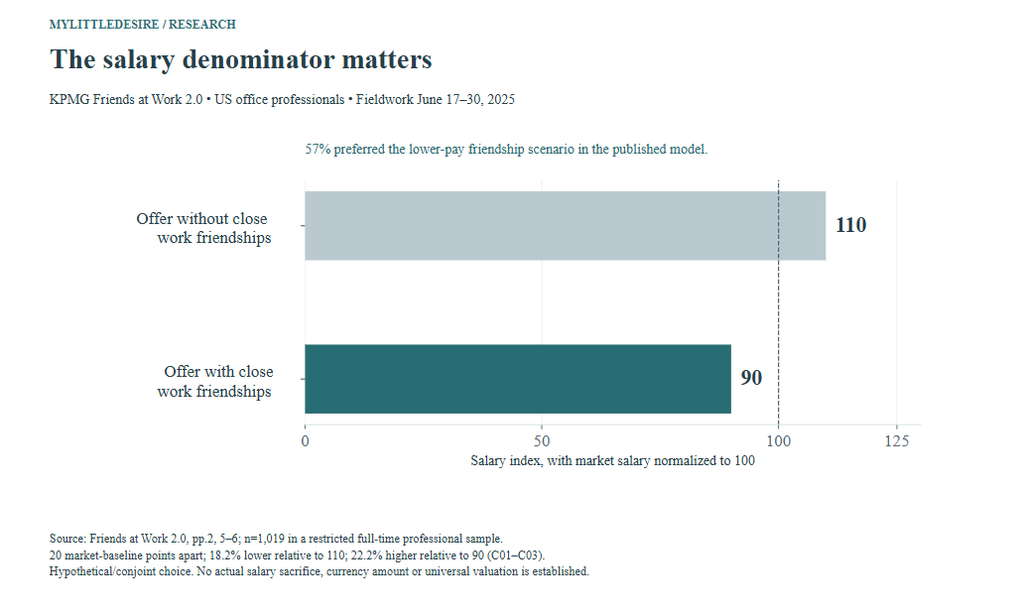
Normalizing market salary to an index of 100 makes the arithmetic transparent. The offers become 90 and 110 (C04–C05). Their gap is 20 percentage points of market salary, approximately 18.2% of the higher offer, or approximately 22.2% of the lower offer (C01–C03). The denominator changes the expression; none turns the scenario into observed salary behavior.
The same restricted professional sample’s high current-friendship figure should not replace a general-worker estimate. Nor does valuing friendship-enabling culture establish that respondents will remain with their employer. The financial-barrier result concerns paid social activities such as meals, drinks and events, rather than every possible way to connect.
What do Canadian job seekers say about friendship and staying longer?
The Canadian Express/Harris release separates employer expectations, job-seeker intentions and recalled past decisions. The two surveys were conducted in late 2024 and published in February 2025. Job seekers are a particular audience, rather than every Canadian employee.
| ID | Finding and qualification | Population, actual period and sample | Original source and locator |
|---|---|---|---|
| F26 | 85% of hiring decision-makers believed workplace friends make employees more likely to stay; 35% strongly agreed. Employer opinion, not measured retention. Strong agreement is nested within total agreement. | Canadian hiring decision-makers 2024-11-11 to 2024-11-26 505 hiring decision-makers | Original research [S05] Original PDF p.1, opening retention paragraph |
| F27 | 78% of job seekers said friends would make them more likely to stay; 64% had stayed longer than intended because of work friendships. Hypothetical willingness and recalled past experience are distinct questions; eligible retrospective item n not published. | Canadian adult job seekers, with prior employment where applicable 2024-11-21 to 2024-12-06 505 overall; achieved retrospective item n unavailable | Original research [S05] Original PDF p.2, Job Seekers Value Workplace Friendships |
| F28 | 32% said they had left a job because they could not form work friendships. Self-reported reason about a past job, not an annual exit rate or verified causal outcome. | Canadian job seekers with prior employment 2024-11-21 to 2024-12-06 505 overall; eligible item n unavailable | Original research [S05] Original PDF p.2, job-seeker retention paragraph |
| F29 | Stayed longer than intended because of friendship: 75% Gen Z, 65% Millennials, 61% Gen X and 50% Boomers. Publisher generation labels retained; birth-year cutoffs and cell n not published. Cross-sectional retrospective comparison, not a generational causal effect. | Canadian job seekers by publisher-defined generation 2024-11-21 to 2024-12-06 505 overall; generation cell n unavailable | Original research [S05] Original PDF pp.2–3, Generational Differences |
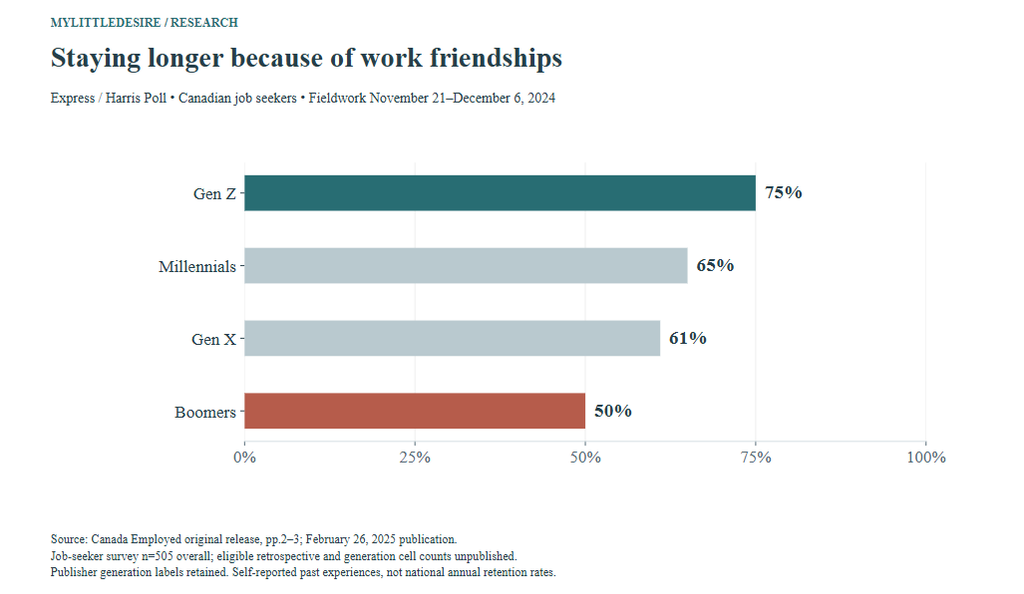
The Gen Z–Boomer difference was 25 percentage points, a ratio of 1.50 (C10–C11). Publisher generation labels are retained because the release does not publish birth-year cutoffs or subgroup counts. This comparison is not a forecast of future retention.
Can people value friendship and still want professional boundaries?
Professional boundaries and valuing colleagues can coexist. Separate survey responses do not identify precisely which people hold both views. Employer reports of encouragement also do not establish whether an activity works.
| ID | Finding and qualification | Population, actual period and sample | Original source and locator |
|---|---|---|---|
| F30 | 55% felt they could not get through a workday without their work friends; 49% worried about making friends at their next company. Reported sentiments, not a clinical dependency measure or a probability of failing to make friends. | Canadian adult job seekers; employment routing not fully printed 2024-11-21 to 2024-12-06 505 overall; item n unavailable | Original research [S05] Original PDF p.2, job-seeker experience paragraph |
| F31 | 64% of job seekers and 66% of employers thought work interactions should remain strictly professional. Two separate respondent samples and questions. Professional boundaries can coexist with valuing friendships; no individual overlap was published. | Canadian job seekers and hiring decision-makers in separate surveys Hiring decision-makers: 2024-11-11 to 2024-11-26; job seekers: 2024-11-21 to 2024-12-06 505 in each separate survey | Original research [S05] Original PDF p.2, separate employer and job-seeker paragraphs |
| F32 | 82% of employers actively encouraged friendships; cited methods included lunches 46%, peer meetings 34%, retreats 32% and mentorship 30%. Published method percentages have incompletely specified routing: do not convert them into conditional counts among the 82%. Employer reports, not audits of program effectiveness. | Canadian hiring decision-makers 2024-11-11 to 2024-11-26 505 overall; method-item routing not fully stated | Original research [S05] Original PDF p.1, Encouraging Friendships |
The release’s body and infographic disagree on an employer-productivity figure. That figure is excluded from the database and article. The listed friendship-building methods have incomplete routing in the public summary, so no conditional headcounts or effectiveness estimates are calculated.
What does the US job-seeker research add?
The corresponding US research also distinguishes willingness to stay from recalled past decisions. Its job-seeker sample includes employed and unemployed people, and retrospective questions can be restricted to those who have ever worked.
| ID | Finding and qualification | Population, actual period and sample | Original source and locator |
|---|---|---|---|
| F33 | 89% of hiring decision-makers believed employees with work friends were more likely to stay; 42% strongly agreed. Employer beliefs, not actual employee retention or a reason to impose friendship requirements. | US hiring decision-makers 2024-11-11 to 2024-11-26 1,001 | Original research [S06] Original release, paragraph before Encouraging Friendships |
| F34 | 76% said they would be more likely to stay with workplace friends; 65% of previously employed job seekers had stayed longer than intended. Different intention and retrospective questions. Not an observed retention cohort, and the subset’s achieved n is unpublished. | US adult job seekers; retrospective result only ever-employed 2024-11-21 to 2024-12-10 1,039 overall; ever-employed n unavailable | Original research [S06] Original release, Friendships and Employee Retention |
| F35 | 36% of ever-employed job seekers had left a job they liked because they could not make workplace friends. Recall and attribution by job seekers. The question is specifically about a liked job; it is not a population annual turnover rate. | US job seekers who have ever been employed 2024-11-21 to 2024-12-10 1,039 overall; filtered n unavailable | Original research [S06] Original release, Friendships and Employee Retention |
| F36 | 49% worried about making friends at their next company; 53% felt no need to be friends with coworkers and 47% avoided outside-work contact. Separate sentiments can coexist. No inference about which respondents both want boundaries and value friends. | US adult job seekers, employed or unemployed 2024-11-21 to 2024-12-10 1,039 overall; item routing varies | Original research [S06] Original release, Value of Friendships and Personal Experience sections |
| F37 | 42% identified lunch events and 42% peer meetings as methods that had or would help form friendships. A combined retrospective/hypothetical preference question, not evidence that either intervention increases retention. | All US job seekers in the survey 2024-11-21 to 2024-12-10 1,039 | Original research [S06] Original release, Companies Fostering Workplace Friendships |
Not feeling a need for work friendships is different from having no friends or feeling lonely. The public data do not reveal the overlap between boundaries, worries about future friendships and willingness to stay. Lunch and peer-meeting preferences combine what has helped with what respondents think would help, so they are not intervention success rates.
How do UK friendship support and professional networks compare?
Santander’s January 2025 UK survey covers friendship formation, perceived benefits and comfort approaching professional contacts. These related measures answer different questions. Its reported mean of lasting friendships is not a longitudinal forecast of every worker’s career.
| ID | Finding and qualification | Population, actual period and sample | Original source and locator |
|---|---|---|---|
| F38 | 87% had made friends at work; respondents reported an average three longstanding genuine friendships from professional relationships. Ever made friends and a reported career-related mean differ from current-company close-friend counts. The headline is not a predictive career model. | UK employed adults; some findings restricted by gender or age 2025-01-13 to 2025-01-17 2,000 overall; subgroup/item n not published | Original research [S07] Original release, opening paragraph and first key bullet |
| F39 | 72% felt more motivated with friends among colleagues; 76% believed good work relationships enhanced their careers. Self-reported perceptions, not independently measured output or promotion gains. | UK employed adults; some findings restricted by gender or age 2025-01-13 to 2025-01-17 2,000 overall; subgroup/item n not published | Original research [S07] Original release, career-growth paragraph |
| F40 | 85% of workers aged 18–25 valued professional friendships, compared with 66% aged 55–64. Original publisher age label is 18–25; some secondary coverage says 18–24. Subgroup counts unpublished; use the original label. | UK employed adults; some findings restricted by gender or age 2025-01-13 to 2025-01-17 2,000 overall; subgroup/item n not published | Original research [S07] Original release, Younger employees paragraph |
| F41 | 37% relied on work friends for personal/professional challenges; emotional support during difficulty was reported by 40% of women and 30% of men. General challenge support and emotional support are separate statements; no causal wellbeing or sex-based explanation inferred. | UK employed adults; some findings restricted by gender or age 2025-01-13 to 2025-01-17 2,000 overall; subgroup/item n not published | Original research [S07] Original release, opening and emotional-support paragraphs |
| F42 | Comfort approaching contacts for mentoring or sponsorship was 21% for women and 33% for men. A professional-network approach question, not the share who currently have a mentor or the quality of workplace friendships. | UK employed adults; some findings restricted by gender or age 2025-01-13 to 2025-01-17 2,000 overall; subgroup/item n not published | Original research [S07] Original release, mentoring/sponsorship key bullet |
| F43 | Men versus women reported approach comfort of 45% versus 32% for collaboration, 42% versus 30% for career advice and 35% versus 28% for referrals. Three distinct tasks, not interchangeable measures or evidence of discrimination causing the observed differences. | UK employed adults; some findings restricted by gender or age 2025-01-13 to 2025-01-17 2,000 overall; subgroup/item n not published | Original research [S07] Original release, professional-contact comfort paragraph |
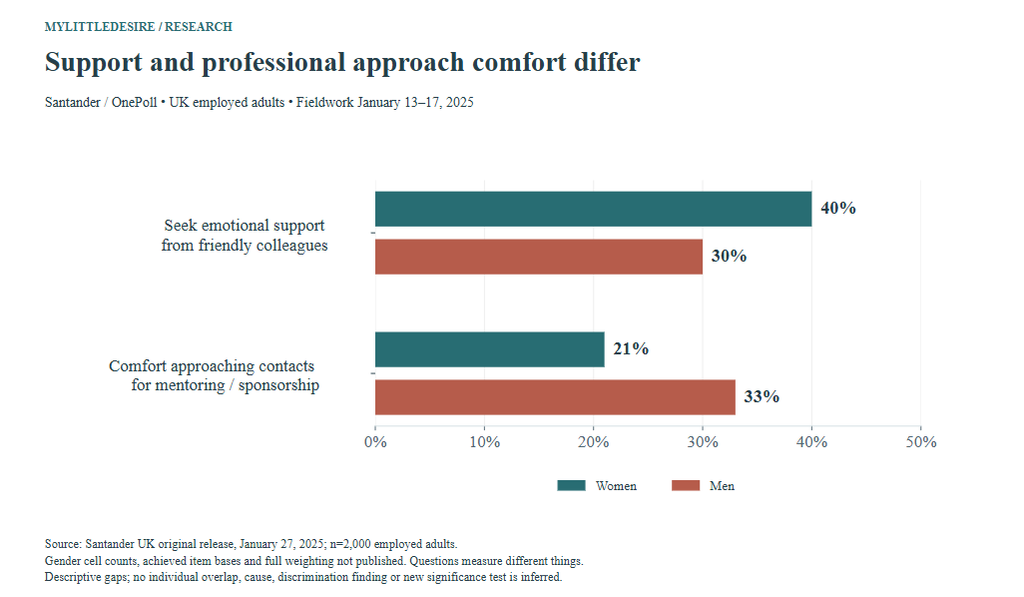
Women reported emotional support more often by 10 percentage points; men reported mentoring-approach comfort more often by 12 points (C12–C13). The directions differ because the questions measure different things. They do not provide one overall gender ranking for friendship or explain why the differences exist.
The 19-point age difference in the importance of professional friendships uses the original publisher’s 18–25 and 55–64 labels (C14). Some secondary reporting uses a different younger age label; this resource follows the original release. Unpublished subgroup counts remain unknown.
What do global surveys say about workplace community?
Randstad’s 2025 report separates wanting community, willingness to leave without belonging, accepting unspecified lower pay and perceived performance. Its fieldwork was conducted in 2024. The pooled figures should not be assigned to any one country.
| ID | Finding and qualification | Population, actual period and sample | Original source and locator |
|---|---|---|---|
| F44 | 83% wanted their workplace to provide a sense of community. A preference, not the share actually receiving community or having friends. Global pooled figure. | Working people surveyed across 35 markets; global pooled results 2024-10-07 to 2024-11-06 26,778 respondents; selected item/country counts not supplied in release | Original research [S08] Original release, Fostering a sense of community |
| F45 | 55% were willing to quit if they did not feel they belonged. Hypothetical willingness, not realized departures in 2025 or a measured annual turnover rate. | Working people surveyed across 35 markets; global pooled results 2024-10-07 to 2024-11-06 26,778 respondents; selected item/country counts not supplied in release | Original research [S08] Original release, Fostering a sense of community |
| F46 | 36% would not mind earning less if they had friends at work. No amount of lower pay is specified here. Do not compare with the KPMG conjoint as if the questions were identical or pool the percentages. | Working people surveyed across 35 markets; global pooled results 2024-10-07 to 2024-11-06 26,778 respondents; selected item/country counts not supplied in release | Original research [S08] Original release, community/pay paragraph |
| F47 | 85% believed they performed better when they felt community with colleagues. Belief about performance rather than an audited output difference or experimental effect. | Working people surveyed across 35 markets; global pooled results 2024-10-07 to 2024-11-06 26,778 respondents; selected item/country counts not supplied in release | Original research [S08] Original release, community/productivity paragraph |
The lower-pay question does not specify a pay amount. It is therefore not comparable with KPMG’s particular hypothetical offer pair. Similarly, wanting community and saying community supports performance are different outcomes; their percentages should not be subtracted to invent an unmet-need population.
How do trust, collaboration and Australian findings fit the picture?
Randstad’s 2026 report provides related trust and collaboration measures, with Australian findings explicitly identified. Its talent and employer surveys were conducted in October 2025. The PDF is hosted on a Canadian website but describes a multi-market study.
| ID | Finding and qualification | Population, actual period and sample | Original source and locator |
|---|---|---|---|
| F48 | 76% of global talent trusted colleagues and 72% trusted company leadership. Trust does not mean close friendship. Pooled global results are not national population estimates. | Talent surveyed across 35 markets Talent: 2025-10-10 to 2025-10-28; employers: 2025-10-09 to 2025-10-30 27,062 talent overall; item n unavailable | Original research [S09] PDF p.18, Rebuilding trust |
| F49 | 72% had a strong manager relationship, 63% felt more connected to their manager than the company, and 71% felt their manager had their best interests in mind. Three different questions. No combined connected-worker total or disputed prior-year trend is calculated. | Talent surveyed across 35 markets Talent: 2025-10-10 to 2025-10-28; employers: 2025-10-09 to 2025-10-30 27,062 overall; item n unavailable | Original research [S09] PDF pp.6, 19, manager relationship discussion |
| F50 | 78% learned industry knowledge or soft skills from older colleagues; 72% learned technology, tools or AI from younger colleagues. Different types and directions of learning can overlap. Perceptions are not tests of learning effectiveness. | Talent surveyed across 35 markets Talent: 2025-10-10 to 2025-10-28; employers: 2025-10-09 to 2025-10-30 27,062 overall; relevant item n unavailable | Original research [S09] PDF p.20, Generations teaching each other diagram |
| F51 | Australian talent reported colleague trust 82%, leadership trust 76%, strong manager relationships 78% and managers having their best interests in mind 75%. Australian survey participants in this defined talent population. Exact market/item n and full weighting details unavailable; no national friendship-prevalence claim. | Australian talent in Randstad survey 2025-10-10 to 2025-10-28 Exact Australian n unpublished; methodology range 250–1,750 talent per market | Original research [S09] PDF p.36, Australia market insights |
| F52 | 81% of global employers and 86% of Australian employers felt remote or hybrid work made collaboration more challenging. Employer perceptions in a separate survey; this does not measure worker friendship or prove an office-return policy improves it. Global figure includes Australia. | Employer respondents: global and Australian subset 2025-10-09 to 2025-10-30 1,225 employers overall; Australian n unpublished, market range 20–55 | Original research [S09] PDF pp.20–21 and p.36 Australia |
The defined talent population includes some sole traders and people considering a future job search. Employer respondents come from a separate, smaller survey. Australian item counts are not published, and the stated per-market sampling ranges should not be replaced with invented country sample sizes.
Employer concerns about remote or hybrid collaboration do not measure friendship prevalence and do not prove that mandatory office attendance improves friendships. Trust and learning from colleagues are useful context, but remain distinct from having a close friend.
How are psychological safety and preferred work location related to connection?
APA’s 2024 survey associates higher psychological safety and preferred-location fit with more positive relationship and belonging reports. Its safety groups are a median split of an adapted seven-item score. They are not clinical categories, and people were not randomly assigned to their working conditions.
| ID | Finding and qualification | Population, actual period and sample | Original source and locator |
|---|---|---|---|
| F53 | Higher versus lower psychological safety was associated with coworker-relationship satisfaction of 99% versus 84%, and manager-relationship satisfaction of 97% versus 78%. Any reported satisfaction, not Pew’s extremely/very threshold. Median-defined groups; self-reported associations, not a safety intervention. | Employed US adults; employer/coworker items exclude respondents saying not applicable 2024-03-25 to 2024-04-03 2,027 overall; applicable item and comparison-cell counts not printed beside selected findings | Original research [S10] PDF physical pp.5, 11 / printed pp.2, 8 |
| F54 | Belonging agreement was 95% in the higher-safety group and 69% in the lower-safety group. The safety scale and belonging measure are distinct but related self-reports; no causal estimate is implied. | Employed US adults; employer/coworker items exclude respondents saying not applicable 2024-03-25 to 2024-04-03 2,027 overall; applicable item and comparison-cell counts not printed beside selected findings | Original research [S10] PDF physical p.12 / printed p.9, belonging bullet |
| F55 | Feeling lonely when working was reported by 11% of the higher-safety group and 45% of the lower-safety group. Agreement-based loneliness measure, not the separate last-month symptom item. Cross-sectional association; no diagnosis or causality. | Employed US adults; employer/coworker items exclude respondents saying not applicable 2024-03-25 to 2024-04-03 2,027 overall; applicable item and comparison-cell counts not printed beside selected findings | Original research [S10] PDF physical p.12 / printed p.9, lonely-when-working bullet |
Does preferred location simply mean working remotely?
No. Preference fit can describe in-person, hybrid or remote work. These comparisons separate having one’s preferred arrangement from being outside it.
| ID | Finding and qualification | Population, actual period and sample | Original source and locator |
|---|---|---|---|
| F56 | In preferred versus non-preferred work locations, positive coworker-relationship agreement was 89% versus 79%, and positive manager relationships 83% versus 72%. Preference match includes in-person, hybrid and remote arrangements. Do not label this remote versus office or a return-to-office effect. | Employed US adults; employer/coworker items exclude respondents saying not applicable 2024-03-25 to 2024-04-03 2,027 overall; applicable item and comparison-cell counts not printed beside selected findings | Original research [S10] PDF physical p.17 / printed p.14, preferred-location comparisons |
| F57 | Belonging was reported by 87% in their preferred location versus 74% outside it. Preference fit and actual work arrangement are different variables; no employee assignment was randomized. | Employed US adults; employer/coworker items exclude respondents saying not applicable 2024-03-25 to 2024-04-03 2,027 overall; applicable item and comparison-cell counts not printed beside selected findings | Original research [S10] PDF physical p.17 / printed p.14, belonging bullet |
| F58 | Last-month workplace loneliness or isolation was reported by 13% in preferred locations versus 23% in non-preferred locations. Past-month item is distinct from agreement with feeling lonely when working. Does not establish that location choice prevents loneliness. | Employed US adults; employer/coworker items exclude respondents saying not applicable 2024-03-25 to 2024-04-03 2,027 overall; applicable item and comparison-cell counts not printed beside selected findings | Original research [S10] PDF physical p.17 / printed p.14, negative-experiences bullet |
| F59 | Comfort working with one’s own age rather than other age groups was 62% at 18–25, 57% at 26–43, 42% at 44–57, 38% at 58–64 and 27% at 65+. Comfort preference is different from actual exclusion, friend demographics or inability to collaborate across ages. Age-cell n not printed. | Employed US adults; employer/coworker items exclude respondents saying not applicable 2024-03-25 to 2024-04-03 2,027 overall; applicable item and comparison-cell counts not printed beside selected findings | Original research [S10] PDF physical p.12 / printed p.9, age-group table |
Preferred-location differences were 10 percentage points for positive coworker relationships and 13 points for belonging; the last-month loneliness rate was 10 points higher outside preferred arrangements (C18–C20). These associations cannot quantify what granting a preference would cause for an individual.
APA also uses more than one loneliness question. Agreement with feeling lonely when working differs from a past-month experience item. Its broad satisfaction category is different from Pew’s high-satisfaction threshold. Those distinctions prevent misleading comparisons.
See our loneliness statistics for prevalence and measurement beyond the workplace. This hub focuses on relationships with colleagues and the interpretation of workplace evidence.
What do workers mean when they describe a best friend at work?
Gallup’s coded definitions emphasize trust, experiences outside work and shared understanding. Its study drew on an opt-in CliftonStrengths cohort. The qualitative percentages describe answers to a definition question, rather than friendship prevalence among all workers.
| ID | Finding and qualification | Population, actual period and sample | Original source and locator |
|---|---|---|---|
| F60 | Coded definitions emphasized trust/safety 36%, connections beyond work 21%, shared experience 12% and ambivalence/disconnection 10%. Selected coded themes, not the whole distribution or workforce prevalence. Opt-in CliftonStrengths cohort, with 2023 fieldwork; do not call it a nationally representative 2025 survey. | Qualitative definition-question subset of opted-in employed CliftonStrengths respondents 2023-11-09 to 2023-12-01 1,182 definition responses; overall survey n=9,527 | Original research [S11] Public original report HTML, Appendix A primary themes table; Methodology |
The fieldwork occurred in 2023, even though the report is labelled as released in 2025. The page’s inconsistent metadata ordering is flagged in the source record. No universal friendship threshold or population estimate is inferred from the coded themes.
What comparisons does MyLittleDesire contribute?
MyLittleDesire contributes source organization, chart design and transparent descriptive arithmetic. Some differences are already apparent in, or discussed by, the original research. The 20 calculations below are reproducible comparisons, rather than new scientific discoveries, fieldwork or significance tests.
| ID | Comparison | Result | Expression using downloadable input IDs |
|---|---|---|---|
| C01 | Hypothetical offer gap relative to market salary | 20.0 market-baseline percentage points | The two offers are 110% and 90% of market; this is a baseline-point gap, not a 20% cut from the higher offer. KPMG US [S04] |
| C02 | Lower offer reduction relative to higher offer | 18.2 % of higher offer | Normalizes market salary to 100; (110−90)/110. Hypothetical scenario arithmetic, not observed behavior. KPMG US [S04] |
| C03 | Higher offer premium relative to lower offer | 22.2 % of lower offer | (110−90)/90 with market=100. Different denominator from C02; no universal salary valuation. KPMG US [S04] |
| C04 | Higher-paying scenario salary index | 110 salary index (market=100) | Index normalization is a display convention; not a measured currency salary. KPMG US [S04] |
| C05 | Friendship scenario salary index | 90 salary index (market=100) | Index normalization; 57% is the published modeled preference, not an actual pay cut. KPMG US [S04] |
| C06 | Always-engaged gap, close friends versus non-socializers | 14.0 percentage points | Different self-selected groups, n=741 overall item; unadjusted descriptive comparison. KPMG US / CivicScience [S03] |
| C07 | Very-likely-search gap, close friends versus non-socializers | 26.0 percentage points | Search intentions, not actual retention. Different item sample from engagement. KPMG US / CivicScience [S03] |
| C08 | Very-likely-search prevalence ratio, close versus non-socializers | Approximately 2.63× | 42/16 from rounded group rates. A marginal prevalence ratio for intentions, not a causal risk ratio for exits. KPMG US / CivicScience [S03] |
| C09 | Manager-care gap, close friends versus non-socializers | 46.0 percentage points | Self-reported perceived care; different relationship groups and possible confounding. KPMG US / CivicScience [S03] |
| C10 | Canadian Gen Z minus Boomer stayed-longer share | 25.0 percentage points | Publisher generation labels; retrospective job-seeker results, unknown subgroup n. Express Employment Professionals / The Harris Poll, Canada [S05] |
| C11 | Canadian Gen Z to Boomer stayed-longer ratio | Approximately 1.50× | 75/50; already visible in original results, not a new discovery or predictive retention model. Express Employment Professionals / The Harris Poll, Canada [S05] |
| C12 | UK women minus men emotional-support share | 10.0 percentage points | 40−30. This is a percentage-point gap, not 10% relatively more. Santander UK / OnePoll [S07] |
| C13 | UK men minus women mentoring-approach comfort | 12.0 percentage points | Separate gender groups, unknown cell n. Different outcome from emotional support. Santander UK / OnePoll [S07] |
| C14 | UK young minus older importance of work friendship | 19.0 percentage points | 18–25 versus 55–64 exactly as the original release labels them; no ageing effect inferred. Santander UK / OnePoll [S07] |
| C15 | US 2023 women minus men close-friend prevalence | 6.0 percentage points | Historical within-survey comparison. Not a current 2027 gap or causal gender effect. Pew Research Center / Ipsos [S01] |
| C16 | US 2023 women minus men mentor access | 7.0 percentage points | Different outcome from friendship; neither should stand in for the other. Pew Research Center / Ipsos [S01] |
| C17 | US 2024 coworker satisfaction minus overall-job satisfaction | 15.0 percentage points | Separate questions; does not identify the people happy with coworkers but unhappy with their job. Pew Research Center / SSRS [S02] |
| C18 | Preferred-location coworker-relationship gap | 10.0 percentage points | Preference fit, not remote versus in-person. Cross-sectional association. American Psychological Association / The Harris Poll [S10] |
| C19 | Preferred-location belonging gap | 13.0 percentage points | No claim that granting preference would cause this increase for an individual. American Psychological Association / The Harris Poll [S10] |
| C20 | Nonpreferred-minus-preferred last-month loneliness gap | 10.0 percentage points | A last-month item, not the distinct agreement item or a clinical diagnosis. American Psychological Association / The Harris Poll [S10] |
What are the important limits of these findings?
- No finding measures actual 2027 behavior, a single global friendship prevalence rate or a harmonized country ranking.
- Current friends, career-long friendships, mentors, trust, respect, belonging and workplace community are related but different constructs.
- Employers, general employees, restricted office professionals, job seekers and opt-in assessment alumni represent different populations.
- Importance ratings, hypothetical salary preferences, search intentions, recalled decisions and actual observed exits are different evidence types.
- Separate marginal rates do not reveal individual overlap. Overall sample sizes are not subgroup or eligible item counts.
- Cross-sectional relationships do not establish that friendship causes engagement, salary sacrifice, retention or wellbeing.
- Several programs share publishers or survey providers, and many are commercially commissioned. Source count does not establish independent replication.
- Conflicting original figures, ambiguous effect wording and unverified generalizations were excluded or explicitly qualified.
How were these workplace findings selected and checked?
Original reports, public survey tables and publisher research releases available by October 24, 2026 were reviewed. Every finding records its source URL, actual data period, population, units, sample availability, method, locator, definitions and limitations. Verification means checking what a publisher reports; it does not independently audit respondents or reproduce fieldwork.
Sixty grouped findings contain 157 numeric source inputs. Related response categories are kept together. Eleven source records represent 13 survey waves because each Express release combines separate employer and job-seeker studies. Pew, KPMG, Express, Santander, Randstad, APA and Gallup are the seven principal publishers or commissioning organizations, alongside their disclosed research partners; some use shared fieldwork providers.
Original KPMG, Pew, Express Canada and Randstad PDFs were checked directly. KPMG’s job-search and engagement pages, its salary scenario and the conflicting Canadian infographic/body were also inspected visually. APA’s original PDF was read through public web retrieval. The publicly readable Gallup report text was used without requesting its form-gated PDF. Exact item and subgroup counts remain labelled unavailable where not supplied.
The charts use original MyLittleDesire designs and third-party data. The spreadsheet links each calculation to editable source inputs. Arithmetic uses readable rounding and retains named denominators. Editing the workbook does not automatically rebuild PNGs, SVGs or static HTML; update and review them together.
Complete original sources
- S01 · Pew Research Center / Ipsos. How Americans View Their Jobs. Published: 2023-03-30. Actual period: 2023-02-06 to 2023-02-12. Sample: 5,188 in the report analysis; subgroup counts not printed beside selected findings. Method: American Trends Panel, recruited using national random address sampling; English/Spanish online interviews; weighted survey. Limitations: Historical 2023 observations, not 2027 measurements. Close friend, mentor, respect and job satisfaction are separate questions. Weighted rates are not raw counts.
- S02 · Pew Research Center / SSRS. Most Americans Feel Good About Their Job Security but Not Their Pay. Published: 2024-12-10. Actual period: 2024-10-07 to 2024-10-13. Sample: 5,273 overall; non-self-employed and item-specific counts not printed beside cited charts. Method: American Trends Panel probability recruitment; online and live telephone interviews; population weighting. Limitations: Overall survey n is not every eligible item base. High satisfaction means extremely/very, not any satisfaction. Relationships and overall job satisfaction can differ.
- S03 · KPMG US / CivicScience. Friends at Work 3.0. Published: 2026-05-14 release; report labelled May 2026. Actual period: 2026-04-17 to 2026-04-22. Sample: Item totals range from 558 to 1,354 for selected relationship-group questions; cell counts not published. Method: Online CivicScience research weighted to US Census demographics; custom questions plus consumer insight data; cross-sectional relationship-group comparisons. Limitations: Groups are close personal friends, workday friends, casual/acquaintances and non-socializers. Different outcomes use different item samples. Job-search intention is not an actual exit. No causal effect is established.
- S04 · KPMG US. Friends at Work 2.0 Findings. Published: 2025-09-09 release; report labelled 2025. Actual period: 2025-06-17 to 2025-06-30. Sample: 1,019 respondents. Method: Online sponsor survey and hypothetical employer-choice/conjoint analysis; full recruitment and weighting not published. Limitations: A restricted professional cohort, not all US workers. Salary choice is hypothetical/modelled preference rather than an observed pay cut. Friend prevalence and average counts must retain the cohort definition.
- S05 · Express Employment Professionals / The Harris Poll, Canada. Workplace Friendships Improve Employee Retention — Canada Employed. Published: 2025-02-26. Actual period: Hiring decision-makers: 2024-11-11 to 2024-11-26; job seekers: 2024-11-21 to 2024-12-06. Sample: 505 hiring decision-makers; 505 adults in job-seeker survey; achieved eligible/subgroup counts not given. Method: Two online Harris surveys commissioned by Express; dates and overall samples in original release; full methods available only by contacting publisher. Limitations: Hiring-manager beliefs, job-seeker intentions and retrospective accounts differ. Job seekers do not represent every employee. Graphic/body productivity values conflict; that metric is excluded.
- S06 · Express Employment Professionals / The Harris Poll, US. Stronger Friendship Bonds, Longer Workplace Tenure. Published: 2025-02-26. Actual period: Hiring decision-makers: 2024-11-11 to 2024-11-26; job seekers: 2024-11-21 to 2024-12-10. Sample: 1,001 hiring decision-makers; 1,039 adults in job-seeker survey; eligible cell counts not published. Method: Two commissioned online Harris surveys; release supplies dates and overall n, with full methodology by contact. Limitations: Separate respondent groups, not paired employer/employee answers. Self-reported past behavior is not longitudinal proof. Headline 51% is not the body’s 89% retention-belief figure.
- S07 · Santander UK / OnePoll. Workers will make three longstanding and genuine personal friendships from their career. Published: 2025-01-27. Actual period: 2025-01-13 to 2025-01-17. Sample: 2,000 overall; subgroup/item n not published. Method: OnePoll survey commissioned for Santander’s mentoring programme; original release supplies overall sample and dates; weighting and questionnaire not published. Limitations: Benefits are respondents’ reports or beliefs. The mean of three is not a longitudinal forecast of each career. Original release labels the younger age group 18–25. Avoid ambiguous self-confidence “by 36%” wording.
- S08 · Randstad / Evalueserve. Workmonitor 2025 — fostering a sense of community. Published: 2025-01-21. Actual period: 2024-10-07 to 2024-11-06. Sample: 26,778 respondents; selected item/country counts not supplied in release. Method: Commissioned multi-market survey conducted with Evalueserve; public release gives field dates and market list. Limitations: Global pooled results are not US, UK, Canadian or Australian national estimates. Wanting community, perceived productivity and willingness to quit are different outcomes. No realized 2025 exit rate is implied.
- S09 · Randstad / Evalueserve. Workmonitor 2026: The Great Workforce Adaptation. Published: 2026-01-20 global release; report edition 2026. Actual period: Talent: 2025-10-10 to 2025-10-28; employers: 2025-10-09 to 2025-10-30. Sample: 27,062 talent and 1,225 employers; 250–1,750 talent and 20–55 employers per market; exact Australian cell n not stated. Method: Online Evalueserve surveys; separate employer/talent samples; methodology p.33; report also uses job-posting analysis, which is not used here. Limitations: A Canada-hosted global report, not a Canadian-only survey. Alternative publisher pages give differing total n and prior-year labels; this compilation uses the PDF’s methods and excludes disputed manager trends. Perceptions of collaboration are not measured productivity or friendship prevalence.
- S10 · American Psychological Association / The Harris Poll. 2024 Work in America: Psychological Safety in the Changing Workplace. Published: 2024-06-13 release; report edition 2024. Actual period: 2024-03-25 to 2024-04-03. Sample: 2,027 overall; applicable item and comparison-cell counts not printed beside selected findings. Method: Opt-in Harris online survey with demographic weighting; psychological safety split at median of adapted seven-item scale; publisher reports Bayesian credible interval ±3.1 points overall. Limitations: Cross-sectional associations, not experiments. Higher/lower safety is a median split, not a diagnosis. Preferred location is a match between preference and arrangement, not simply remote versus office. Agreement with feeling lonely differs from a last-month experience item.
- S11 · Gallup. Unlocking Powerful Partnerships — qualitative definition findings. Published: Release labelled August 2025; webpage metadata has inconsistent published/updated ordering. Actual period: 2023-11-09 to 2023-12-01. Sample: 9,527 employed adults overall; 1,182 randomly assigned to the definition question. Method: Opt-in survey; thematic coding, topic modelling and cluster analysis of open-ended definitions; Appendix A and methodology. Limitations: Percentages concern coded definitions, not prevalence of friendship among all workers. Random assignment to a question does not make recruitment representative. Overall US share does not establish the subset’s geographic mix. No form-gated PDF was requested.
How to cite this workplace friendship resource
For this compilation or a MyLittleDesire chart or calculation, cite this resource and the underlying study. For an individual survey result, consult and cite the original research directly.
Suggested citation after publication: MyLittleDesire. Workplace Friendship Statistics 2027: Connection, Support and Retention. 2027 editorial edition. https://mylittledesire.com/workplace-friendship-statistics/. Add the actual access date where required.