Family caregiving changes how relatives and partners spend time together, share responsibilities and maintain contact with other people. Research captures both strain and connection: carers report disagreements and lost social time, while some also describe stronger relationships, meaning and practical support.
This resource brings together 60 grouped findings from nine original-source reports covering eight survey programs, plus four MyLittleDesire chart designs and 20 transparent calculations. The two UK reports use the same 2025 survey; report count is not a count of independent replications. Coverage includes the United States, United Kingdom, Canada and Australia, with each study’s population kept separate.
What are the key family caregiving and relationship statistics?
63 million
57%
The 2025 NAC/AARP edition estimated family caregivers of adults or children with medical conditions or disabilities. Fieldwork was in 2024; some family caregivers received compensation. National Alliance for Caregiving and AARP [S01].
Of Carers UK respondents said caring led to disagreements with a partner, family or friends. This is a disagreement measure, not a divorce rate. Carers UK [S06].
74%
50.1% / 38.1%
Of that UK survey’s respondents said caring made new relationships harder to form. Relationships were not limited to romantic partners. Carers UK [S06].
Relationship strain among Women+ / Men+ Canadian sandwich caregivers in 2022. These are unadjusted estimates with published confidence intervals. Statistics Canada [S04].
64% vs 45%
60% / 57%
Lost contact with family/friends among UK respondents caring over versus under 35 hours weekly. The source does not clarify exactly 35 hours. Carers UK [S06].
US adult caregivers most often named a parent/in-law (60%); within spouse/partner care, 57% provided care daily. Different denominators. Board of Governors of the Federal Reserve System [S03].
56%
81.9%
Of current Australian Carer Wellbeing Survey respondents in 2025 said caring strengthened their relationship with the recipient. Carers Australia / University of Canberra WellRes Unit [S09].
Of Australian primary carers looking after a parent selected family responsibility as a reason for caring in the SDAC 2022. Australian Bureau of Statistics [S08].
38.7%
13% / 39%
Of primary carers looking after a child selected having no other choice in that same Australian study. Multiple reasons could coexist. Australian Bureau of Statistics [S08].
Had ever used respite / thought respite availability would help in the NAC/AARP adult-recipient cohort. Separate questions, not a measured unmet-need rate. National Alliance for Caregiving and AARP [S01].
51%
47.8%
Said caregiving gave purpose or meaning in the NAC/AARP 2025 edition, based on 2024 fieldwork. National Alliance for Caregiving and AARP [S01].
Of Australian primary carers wanted more contact with family or friends outside the home in SDAC 2022. Contact and satisfaction are separate questions. Australian Bureau of Statistics [S08].
Which caregiving statistics can be compared?
Compare results only after checking who gives care, who receives it, what counts as care and the reference period. These studies do not provide a harmonized international ranking. Even two US estimates can measure substantially different kinds of caregiving.
| Source or measure | Who and what it covers | Keep this boundary |
|---|---|---|
| NAC/AARP 2025 edition | US adults 18+; care for adults or children with serious medical conditions or disabilities; includes some compensated family caregivers | Main detailed results usually concern an adult recipient. Fieldwork was in 2024. |
| BLS 2023–2024 eldercare | People 15+; unpaid care for someone 65+ with an aging-related need | A narrower recipient definition, with usual frequency separate from a previous-day diary. |
| Federal Reserve SHED 2025 | Adults 18+ providing regular unpaid adult care due to aging, disability or illness | Relationship categories can overlap. Childcare questions have separate parent bases. |
| Statistics Canada 2022 | People 15+ in ten provinces, off-reserve; adult needs care and ordinary childcare under 15 | Sandwich care includes both groups, not just parents raising their own children while helping aging parents. |
| CCCE/Leger 2023 fieldwork | Adults helping someone with illness, disability, mental health or aging-related needs | Use the panel unpaid-caregiver data; paid-only professional and open-link samples are different. |
| Carers UK 2025 | Voluntary respondents recruited through carer networks | Not a representative survey of all UK carers; the 2026 sandwich briefing reuses this wave. |
| ABS SDAC 2022 | All household carers, with a narrower primary-carer population aged 15+ | Primary care concerns assistance with core activities over at least six months. Collection ran into February 2023. |
| Australian CWS 2025 | Current unpaid carers 14+, voluntarily recruited and weighted to population benchmarks | Weights do not make recruitment random. The separate October 2026 preliminary release is not merged here. |
How common is family caregiving in the United States, and who receives it?
The NAC/AARP 2025 edition estimates a large family-caregiving population, most often linked to close relatives. The estimate uses 2024 fieldwork and includes some family caregivers receiving program payments. It should not be described as 63 million unpaid caregivers measured in 2027.
| ID | Finding and qualification | Population, actual period and sample | Original source and locator |
|---|---|---|---|
| F01 | The 2025 edition estimates 63.0 million family caregivers, or 24.0% of US adults; 59.0 million, or 22.5%, cared for adults. Fieldwork took place in 2024. The 63 million estimate includes some compensated family caregivers; do not label all 63 million unpaid. Published prevalence screener count is 21,141; do not substitute another section’s screener count. | Adults 18+ providing ongoing care for a person with a complex medical condition or disability; most detailed findings concern the main adult recipient. Paid family-program participants included; professional direct-care workers excluded. 2024-08-06 to 2024-10-14; previous-12-month caregiving 6,858 completed caregiver surveys; Table 1 footnote cites 21,141 screened for prevalence. | Original research [S01] Physical p.12 / printed p.6, Table 1 and footnote 1. |
| F02 | The main adult recipient was a relative for 89% of caregivers: 47% cared for a parent or parent-in-law, 15% for a spouse or partner, and 11% for a nonrelative. Selected categories; the relative total contains the named kinship categories. | US family caregivers 18+ whose main care recipient was 18+; includes qualifying paid family-program caregivers. 2024-08-06 to 2024-10-14; previous-12-month caregiving Figure 3 n=6,549. | Original research [S01] Physical p.17 / printed p.11, Figure 3, Q7. |
| F03 | Among adult-recipient caregivers, 76% cared for one person and 24% for multiple people; 20% cared for two and 4% for three or more. The multiple-recipient total includes the two and three-plus groups; do not add them again. | US family caregivers 18+ whose main care recipient was 18+; includes qualifying paid family-program caregivers. 2024-08-06 to 2024-10-14; previous-12-month caregiving Adult-recipient cohort n=6,549; exact item count not repeated in paragraph. | Original research [S01] Physical p.17 / printed p.11, Number of care recipients. |
The recipient-relationship table asks about the main adult recipient. This is a different question from naming every relationship someone cares for. It helps explain why another study can report a different parent-care percentage without necessarily contradicting it.
How do living arrangements, shared help and care time shape family life?
Care can involve living together, coordinating helpers and substantial recurring time. The same household is only one possible arrangement. A child helping an adult caregiver also does not establish the prevalence of caregiving among all children.
| ID | Finding and qualification | Population, actual period and sample | Original source and locator |
|---|---|---|---|
| F04 | Forty percent of adult care recipients lived in the caregiver’s household, and 35% lived elsewhere within 20 minutes. Distance concerns the main adult recipient; a nearby recipient is not necessarily in the same household. | US family caregivers 18+ whose main care recipient was 18+; includes qualifying paid family-program caregivers. 2024-08-06 to 2024-10-14; previous-12-month caregiving Figure 8 n=6,549. | Original research [S01] Physical p.23 / printed p.17, Figure 8, Q11. |
| F05 | Thirteen percent of caregivers who had other unpaid help reported that at least one helper was under 18. The denominator is caregivers with other unpaid help, not all caregivers and not all US children. The surrounding text uses a different denominator; no child-population estimate is calculated. | US adult-recipient caregivers who had other unpaid helpers. 2024-08-06 to 2024-10-14; previous-12-month caregiving Figure 12 n=3,302. | Original research [S01] Physical p.26 / printed p.20, Figure 12, Q29Z. |
| F06 | Thirteen percent had ever used respite services, while 39% said having respite services available would be helpful. Different questions and timeframes. Their difference is not a measured unmet-need group or evidence that respite caused an outcome. | US family caregivers 18+ whose main care recipient was 18+; includes qualifying paid family-program caregivers. 2024-08-06 to 2024-10-14; previous-12-month caregiving Figure 13 n=6,549. | Original research [S01] Physical p.27 / printed p.21, Figure 13, Q45 and N20. |
| F07 | The mean duration of care for the main adult recipient was 5.5 years; the chart reports 29% had provided care for at least five years. Use the chart’s 29%; narrative text rounds it to nearly 30%. This is duration reported at interview, not a forecast of a new care episode. | US family caregivers 18+ whose main care recipient was 18+; includes qualifying paid family-program caregivers. 2024-08-06 to 2024-10-14; previous-12-month caregiving Figure 14 n=6,549. | Original research [S01] Physical p.28 / printed p.22, Figure 14, Q21. |
| F08 | Mean care time was 27.3 hours per week. The chart places 35% at 21 or more hours and 24% at 41 or more hours. The 41-plus group is contained in the 21-plus group. Hours above 98/week were capped; constant-care responses could be imputed. Use the chart’s exact category labels. | US family caregivers 18+ whose main care recipient was 18+; includes qualifying paid family-program caregivers. 2024-08-06 to 2024-10-14; previous-12-month caregiving Figure 15 n=6,549. | Original research [S01] Physical pp.28–29 / printed pp.22–23, Figure 15, Q25 and footnote 5. |
The under-18-helper finding has a conditional denominator: caregivers who already had other unpaid help. The respite findings ask different questions about past use and potential helpfulness. Their difference does not identify exactly who lacks a service. Weekly hours are self-reported and can include imputation for constant care; they should not be equated with a time diary.
Can caregiving provide meaning while also limiting choice?
Yes: the published surveys measure choice, purpose and planning as separate dimensions. Having meaning does not imply that someone has enough support, and a feeling of having no choice does not reveal every family’s available alternatives.
| ID | Finding and qualification | Population, actual period and sample | Original source and locator |
|---|---|---|---|
| F09 | Seventy percent of caregivers ages 18–64 for an adult recipient worked at some point while caregiving in the previous year. This is not the proportion of all caregivers currently employed. The chart restricts age and includes employment earlier in the care year. | US caregivers ages 18–64 of an adult recipient. 2024-08-06 to 2024-10-14; previous-12-month caregiving Figure 26 n=5,074. | Original research [S01] Physical p.39 / printed p.33, Figure 26, Q32A and Q33. |
| F10 | Fifty-six percent felt they had no choice about taking on the family-caregiver role. Subjective choice does not identify the objective availability of care alternatives. | US family caregivers 18+ whose main care recipient was 18+; includes qualifying paid family-program caregivers. 2024-08-06 to 2024-10-14; previous-12-month caregiving Adult-recipient cohort n=6,549; exact item count not printed beside paragraph. | Original research [S01] Physical p.50 / printed p.44, Choice in caregiving. |
| F11 | The report states that 51% felt caregiving gave life purpose or meaning. Purpose was reported by 42% who felt no choice versus 62% who felt they had a choice. The publisher’s overall NET is retained; rounded response categories need not reproduce it exactly. Choice and purpose are cross-sectional self-reports, not an intervention effect. | US family caregivers 18+ whose main care recipient was 18+; includes qualifying paid family-program caregivers. 2024-08-06 to 2024-10-14; previous-12-month caregiving Figure 38 n=6,549; choice subgroup counts not displayed. | Original research [S01] Physical pp.49–50 / printed pp.43–44, Figure 38, M5_1 and Choice in caregiving. |
| F12 | Forty-seven percent had plans for their own future care; 43% said the care recipient had future-care plans. Separate questions. These percentages do not measure whether both people in the same caregiving relationship had plans. | US family caregivers 18+ whose main care recipient was 18+; includes qualifying paid family-program caregivers. 2024-08-06 to 2024-10-14; previous-12-month caregiving Figure 42 n=6,549. | Original research [S01] Physical p.54 / printed p.48, Figure 42, N21 and N22. |
In the NAC/AARP report, the purpose difference between those who felt they had a choice and those who felt they did not was 20 percentage points (C19). That is an unadjusted association, not evidence that a particular policy or family conversation would create a 20-point improvement. Caregiver and recipient planning rates also come from separate questions, so they do not show whether both people in a family had plans.
Why does the BLS unpaid-eldercare estimate differ from the broader family-caregiver estimate?
BLS measures a narrower form of care with different ages, eligibility and reference periods. Its combined 2023–2024 estimate concerns unpaid help to people 65 or older because of an aging-related need. The diary additionally records what happened on a specific day.
| ID | Finding and qualification | Population, actual period and sample | Original source and locator |
|---|---|---|---|
| F13 | BLS estimates 38.2 million people, or 14% of people 15+, provided unpaid eldercare in the 2023–2024 combined period; 55% of providers were women. The 55% is the composition of providers, not the percentage of women who provided care. This older-recipient definition differs from AARP/NAC. | Civilian noninstitutional population age 15+; unpaid care to a person 65+ needing help due to an aging-related condition. Combined 2023–2024 averages; eldercare screening refers to prior three to four months, diary to prior day Approximately 16,000 ATUS interviews in 2023–2024, including approximately 2,500 eldercare providers; subgroup counts not stated beside selected estimates. | Original research [S02] Physical p.1, opening summary and Table 1. |
| F14 | Forty-seven percent of eldercare providers cared for a parent. The relationship is not restricted to the single main recipient in the same way as the AARP figure. | Civilian noninstitutional population age 15+; unpaid care to a person 65+ needing help due to an aging-related condition. Combined 2023–2024 averages; eldercare screening refers to prior three to four months, diary to prior day Approximately 16,000 ATUS interviews in 2023–2024, including approximately 2,500 eldercare providers; subgroup counts not stated beside selected estimates. | Original research [S02] Physical p.1, relationship summary; Table 3. |
| F15 | Nineteen percent provided eldercare solely to a household member, while 79% cared solely for someone living outside their household. Selected residence groups do not exhaust mixed household/non-household situations. Do not present these as the living arrangement of every care recipient. | Civilian noninstitutional population age 15+; unpaid care to a person 65+ needing help due to an aging-related condition. Combined 2023–2024 averages; eldercare screening refers to prior three to four months, diary to prior day Approximately 16,000 ATUS interviews in 2023–2024, including approximately 2,500 eldercare providers; subgroup counts not stated beside selected estimates. | Original research [S02] Physical p.2, first bullet; Table 2. |
| F16 | On an average day, 28% of eldercare providers provided care; those who actually provided care that day spent 3.9 hours on it. The 3.9-hour mean excludes providers who did not care on the diary day. Do not multiply it by seven and present it as every provider’s weekly care time. | Civilian noninstitutional population age 15+; unpaid care to a person 65+ needing help due to an aging-related condition. Combined 2023–2024 averages; eldercare screening refers to prior three to four months, diary to prior day Approximately 16,000 ATUS interviews in 2023–2024, including approximately 2,500 eldercare providers; subgroup counts not stated beside selected estimates. | Original research [S02] Physical pp.1–2; Table 4 and Technical Note, physical p.4. |
The 3.9-hour figure applies to days when providers actually gave care, while the 28% figure concerns whether any care occurred on the diary day. Reporting the first as every caregiver’s daily average would remove an essential denominator.
Which family relationships receive regular care, and which receive it daily?
In the Federal Reserve’s October 2025 survey, parent care was the most commonly named relationship, while spouse or partner care was more often daily within that group. The two panels below intentionally preserve different denominators. A person can provide care to more than one relationship type.
| ID | Finding and qualification | Population, actual period and sample | Original source and locator |
|---|---|---|---|
| F17 | Eighteen percent of US adults regularly provided unpaid adult care. Rates were 19% for women and 16% for men; by age they were 15% at 18–29, 15% at 30–44, 23% at 45–59 and 18% at 60+. Rates within demographic groups; no all-adult recipient-population prevalence is inferred. | US adults 18+; adult-care items ask about regular unpaid care due to aging, disability or illness. Childcare questions have separate parent/household bases. 2025-10-17 to 2025-10-28 12,934 final respondents after quality exclusions; 13,099 completed before exclusions; item and relationship-group counts not shown. | Original research [S03] Living Arrangements and Care Work, Table 11. |
| F18 | Among people caring for an adult child, 61% lived with an adult child, versus 19% of all adults. Among people caring for a parent, 36% lived with a parent, versus 15% of all adults. Conditional caregiver groups versus all adults have different denominators. Co-residence does not establish causality or identify the cared-for person where multiple family members are involved. | US adults 18+; adult-care items ask about regular unpaid care due to aging, disability or illness. Childcare questions have separate parent/household bases. 2025-10-17 to 2025-10-28 12,934 final respondents after quality exclusions; 13,099 completed before exclusions; item and relationship-group counts not shown. | Original research [S03] Living Arrangements section, paragraph after Table 8. |
| F19 | Parents or parents-in-law were named by 60% of adult caregivers, spouses/partners by 15%, adult children by 15% and friends/neighbors by 20%. Daily care was reported by 32%, 57%, 40% and 17%, respectively, within each relationship group. Relationship incidence and daily frequency have different denominators. Multiple recipient relationships can overlap. These are not main-recipient shares and must not be stacked into a pie chart. | US adults who regularly provided unpaid adult care; daily frequency conditional on named relationship. 2025-10-17 to 2025-10-28 12,934 final respondents after quality exclusions; 13,099 completed before exclusions; item and relationship-group counts not shown. | Original research [S03] Accessible Version, Figures 15 and 16; adult-care section. |
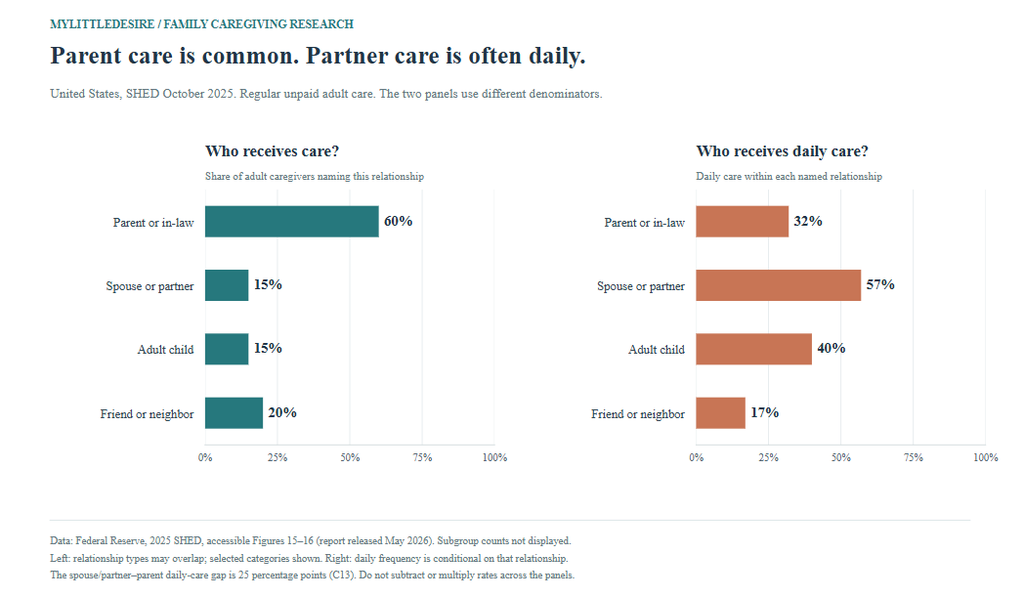
Daily care was 25 percentage points more common within spouse/partner care than within parent/in-law care, a descriptive ratio of about 1.78 (C13–C14). This does not rank the emotional difficulty, quality or total hours of those relationships. The percentage naming a care recipient cannot simply be multiplied by the daily-care percentage to invent a reliable population estimate from these rounded tables.
How do ordinary childcare and paid work add context?
Parenting can add another layer of responsibility, but ordinary childcare is not the same population as illness- or disability-related family care. The following parent results are explicitly labelled as context. Mothers’ and fathers’ answers are not matched partner accounts.
| ID | Finding and qualification | Population, actual period and sample | Original source and locator |
|---|---|---|---|
| F20 | Among partnered parents living with their children under 13, 58% of mothers versus 12% of fathers described themselves as the usual primary caretaker. In dual-earner couples the figures were 49% and 8%; 34% of mothers versus 54% of fathers said responsibilities were shared equally. Separate respondents, not matched mother-father pairs. Ordinary childcare is distinct from caring for a person with disability or illness. These are self-perceptions, not time-diary shares. | Adults living with spouse/partner and own children under 13; dual-earner subgroup as labelled. 2025-10-17 to 2025-10-28 12,934 final respondents after quality exclusions; 13,099 completed before exclusions; item and relationship-group counts not shown. | Original research [S03] Childcare section and footnote 18. |
| F21 | Among adults living with their own children under 13, 28% used unpaid care from the children’s grandparents, 8% from a sibling and 10% from another relative other than the parents. Selected provider categories. Do not treat grandparents as a share only of families who used unpaid care or of all grandparents. | Adults living with own children under 13; ordinary childcare context. 2025-10-17 to 2025-10-28 12,934 final respondents after quality exclusions; 13,099 completed before exclusions; item and relationship-group counts not shown. | Original research [S03] Table 10, Providers of unpaid childcare. |
| F22 | Thirty-two percent of prime-age adult caregivers did not work for pay, versus 23% without adult-care responsibilities. Among those providing daily care, 44% did not work for pay. Prime-age is the report’s population label. Cross-sectional work status does not show that care caused job exit, and daily caregivers are a subgroup, not a separate population. | Prime-age adults as labelled in the report; caregiver and daily-caregiver groups as specified. 2025-10-17 to 2025-10-28 12,934 final respondents after quality exclusions; 13,099 completed before exclusions; item and relationship-group counts not shown. | Original research [S03] Caring for Other Adults, final two paragraphs. |
These self-descriptions do not measure each partner’s actual time contribution or prove that a particular couple disagrees. Likewise, a work-status association does not show that caregiving caused a person to leave a job.
How does sandwich caregiving relate to relationship strain in Canada?
Statistics Canada found different levels of reported strain across care roles and gender-plus groups in its 2022 data. Its broad definition includes ordinary care of children under 15 as well as care-dependent adults. Sandwich arrangements can involve partners, parents, children or grandchildren.
| ID | Finding and qualification | Population, actual period and sample | Original source and locator |
|---|---|---|---|
| F23 | In 2022, about 42% of Canadians 15+—13.4 million—provided unpaid child or adult care. The population shares were 14.4% adult-only, 21.9% child-only and 5.6% sandwich care. Ordinary childcare is included. The chart categories total 41.9% before headline rounding. Do not equate this prevalence with illness/disability-only US or Australian definitions. | Non-institutionalized people 15+; adult care includes long-term conditions, disability or aging; childcare includes ordinary care of children under 15. 2022-07-15 to 2022-08-28; previous-12-month unpaid care 9,767 total respondents, including 4,200 unpaid caregivers; exact table subgroup counts not published. | Original research [S04] Chart 1 and Results I opening paragraphs. |
| F24 | Among sandwich caregivers, 34% cared for a parent or parent-in-law and their own child under 15, 15% for a parent and grandchild, and 8% for a spouse/partner and their own child. Selected arrangements; sandwich care is broader than caring only for an aging parent while raising one’s own child. | Unpaid sandwich caregivers, providing adult-needs care and childcare in previous 12 months. 2022-07-15 to 2022-08-28; previous-12-month unpaid care 9,767 total respondents, including 4,200 unpaid caregivers; exact table subgroup counts not published. | Original research [S04] Highlights and Results II, paragraph on combined caregiving arrangements. |
| F25 | Adult-only caregivers named a parent in 51.4%, a partner in 19.0% and a friend/neighbor in 17.3% of cases; corresponding sandwich-caregiver figures were 57.1%, 15.8% and 9.7%. Respondents could name more than one relationship. These are not mutually exclusive main-recipient categories. | Non-institutionalized people 15+; adult care includes long-term conditions, disability or aging; childcare includes ordinary care of children under 15. 2022-07-15 to 2022-08-28; previous-12-month unpaid care 9,767 total respondents, including 4,200 unpaid caregivers; exact table subgroup counts not published. | Original research [S04] Table 2A, relationships to adult recipients. |
| F26 | The study reports average weekly care of 21 hours for care-dependent adults and 39 hours for children. Sandwich caregivers reported similar average hours for each type of recipient. These describe different types of care and potentially simultaneous activity. Do not add them to claim 60 unique hours for every sandwich caregiver. | Non-institutionalized people 15+; adult care includes long-term conditions, disability or aging; childcare includes ordinary care of children under 15. 2022-07-15 to 2022-08-28; previous-12-month unpaid care 9,767 total respondents, including 4,200 unpaid caregivers; exact table subgroup counts not published. | Original research [S04] Results II, average caregiving time section. |
| F27 | At least one effect on health or wellbeing was reported by 86% of sandwich caregivers, compared with 74% of adult-only and 62% of child-only caregivers. Any reported effect is not a diagnosed health condition or a measure of relationship breakdown. Rounded text estimates are retained. | Non-institutionalized people 15+; adult care includes long-term conditions, disability or aging; childcare includes ordinary care of children under 15. 2022-07-15 to 2022-08-28; previous-12-month unpaid care 9,767 total respondents, including 4,200 unpaid caregivers; exact table subgroup counts not published. | Original research [S04] Highlights and Results III, care effects on wellbeing. |
| F28 | Caregiving-related relationship strain was reported by 50.1% of Women+ and 38.1% of Men+ sandwich caregivers. Rates were 32.0% and 27.9% for adult-only care and 24.1% and 22.5% for child-only care. Descriptive unadjusted group estimates. Gender-plus categories protect confidentiality. No divorce rate, causal effect or new significance test is inferred. | Unpaid Canadian caregivers 15+; type of care and gender-plus group as labelled. 2022-07-15 to 2022-08-28; previous-12-month unpaid care 9,767 total respondents, including 4,200 unpaid caregivers; exact table subgroup counts not published. | Original research [S04] Table 5, relational strain rows in Panels A, B and C, including 95% confidence intervals. |
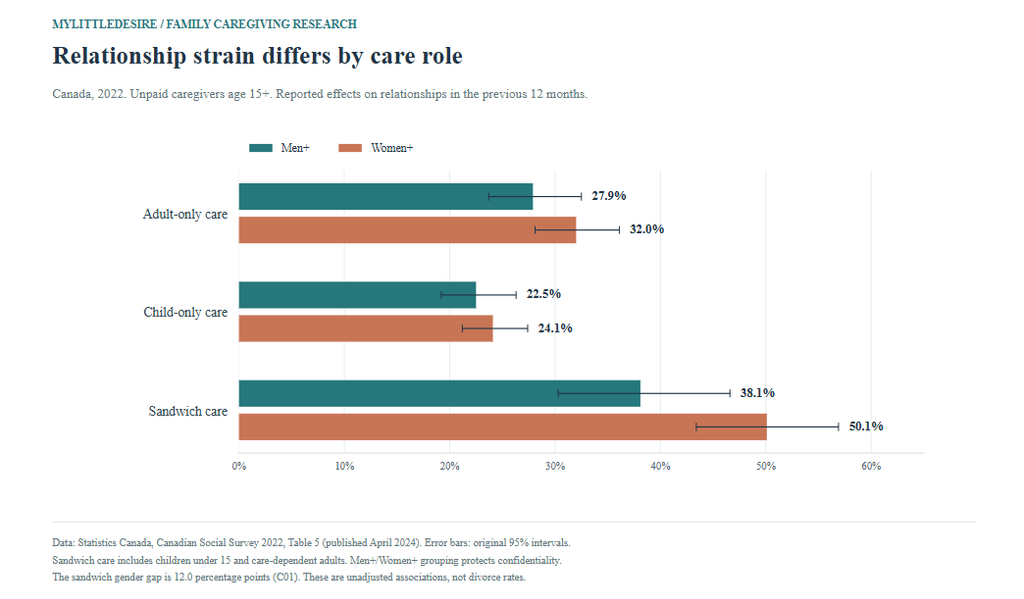
The Women+–Men+ relationship-strain gap was 12.0 percentage points for sandwich care, 4.1 points for adult-only care and 1.6 points for child-only care (C01–C03). The sandwich-versus-adult-only difference between those gender gaps was 7.9 points (C06). These are comparisons of unadjusted estimates, not a new regression interaction or significance test.
The chart retains the original confidence intervals to show sampling uncertainty. Gender-plus categories distribute some non-binary respondents to protect confidentiality. Care type can also be associated with age, living arrangements, severity of need and other factors not controlled by this chart.
What does Canadian research show about care networks and practical support?
The CCCE/Leger report documents emotional work, practical duties, living arrangements and financial pressure. It was published in May 2024 using 2023 fieldwork. Its panel and open-link surveys had different recruitment and respondent profiles; the findings below use the panel data.
| ID | Finding and qualification | Population, actual period and sample | Original source and locator |
|---|---|---|---|
| F29 | The Leger panel’s main recipients included a parent for 38%, partner/spouse for 17%, other family for 16%, a child for 11%, a friend for 7% and a sibling for 4%. Top responses only; do not mix the open-link column with the panel column. | Adults caring for a person with illness, disability, mental health or aging-related needs; ordinary childcare excluded. Selected findings use the panel unpaid-caregiver population, including dual-role participants. Panel: 2023-07-20 to 2023-08-28; separate open link: 2023-07-20 to 2023-09-16 Panel n=2,159: 1,977 caregiver-only, 106 dual caregiver/care-provider and 76 paid-care-provider-only; separate open link n=940. Item/subgroup counts not displayed. | Original research [S05] Physical p.21 / printed p.16, Table 2 panel column. |
| F30 | Panel caregivers reported an average 5.1 hours of active care per day and 4.6 years caring for their main recipient. Active-care self-report differs from a previous-day time diary and from total time on call. | Adults caring for a person with illness, disability, mental health or aging-related needs; ordinary childcare excluded. Selected findings use the panel unpaid-caregiver population, including dual-role participants. Panel: 2023-07-20 to 2023-08-28; separate open link: 2023-07-20 to 2023-09-16 Panel n=2,159: 1,977 caregiver-only, 106 dual caregiver/care-provider and 76 paid-care-provider-only; separate open link n=940. Item/subgroup counts not displayed. | Original research [S05] Physical p.21 / printed p.16, Table 2; physical p.26 / printed p.21. |
| F31 | Forty-one percent lived with their main care recipient. A main-recipient living arrangement, not the share of all Canadian households that contain a caregiver. | Adults caring for a person with illness, disability, mental health or aging-related needs; ordinary childcare excluded. Selected findings use the panel unpaid-caregiver population, including dual-role participants. Panel: 2023-07-20 to 2023-08-28; separate open link: 2023-07-20 to 2023-09-16 Panel n=2,159: 1,977 caregiver-only, 106 dual caregiver/care-provider and 76 paid-care-provider-only; separate open link n=940. Item/subgroup counts not displayed. | Original research [S05] Physical p.26 / printed p.21, care-duration and residence summary. |
| F32 | Caregiving tasks included emotional support (69%), transportation (53%), meal preparation/housekeeping (49%), managing finances (34%) and coordinating care (34%). Multiple duties can be reported. Emotional support is a caregiving task, not a score of romantic relationship satisfaction. | Adults caring for a person with illness, disability, mental health or aging-related needs; ordinary childcare excluded. Selected findings use the panel unpaid-caregiver population, including dual-role participants. Panel: 2023-07-20 to 2023-08-28; separate open link: 2023-07-20 to 2023-09-16 Panel n=2,159: 1,977 caregiver-only, 106 dual caregiver/care-provider and 76 paid-care-provider-only; separate open link n=940. Item/subgroup counts not displayed. | Original research [S05] Physical p.26 / printed p.21, Figure 8. |
| F33 | Financial hardship attributed to caregiving was reported by 24% providing 1–2 active care hours per day, 45% providing 3–4 hours, and 56% providing at least five hours. Response combines a little and a lot of financial hardship in the past year. Cross-sectional association, not the effect of adding an hour of care. | Adults caring for a person with illness, disability, mental health or aging-related needs; ordinary childcare excluded. Selected findings use the panel unpaid-caregiver population, including dual-role participants. Panel: 2023-07-20 to 2023-08-28; separate open link: 2023-07-20 to 2023-09-16 Panel n=2,159: 1,977 caregiver-only, 106 dual caregiver/care-provider and 76 paid-care-provider-only; separate open link n=940. Item/subgroup counts not displayed. | Original research [S05] Physical p.48 / printed p.43, Figure 16. |
| F34 | In the past year, 25% sought information about caregiver supports, services or benefits, while 24% received support or services for their main care recipient. These are different questions, not a service-application success rate. Receipt of a care-recipient service is not the same as receiving support personally. | Adults caring for a person with illness, disability, mental health or aging-related needs; ordinary childcare excluded. Selected findings use the panel unpaid-caregiver population, including dual-role participants. Panel: 2023-07-20 to 2023-08-28; separate open link: 2023-07-20 to 2023-09-16 Panel n=2,159: 1,977 caregiver-only, 106 dual caregiver/care-provider and 76 paid-care-provider-only; separate open link n=940. Item/subgroup counts not displayed. | Original research [S05] Physical p.27 / printed p.22, support and service access opening bullets. |
The financial-hardship difference between those reporting at least five care hours a day and those reporting one to two hours was 32 percentage points (C18). This does not estimate the effect of adding hours to the same person’s role. Support-information searches and the recipient’s service use are also different outcomes, so their percentages do not form an application success rate.
How does caring affect partners, friends and the ability to form relationships in the UK survey?
Carers UK respondents described both disagreements and barriers to maintaining or forming relationships. The survey explicitly says it is not representative, so these are accounts of the respondents’ experiences rather than estimates for every UK carer.
| ID | Finding and qualification | Population, actual period and sample | Original source and locator |
|---|---|---|---|
| F35 | Fifty-seven percent of responding carers said the role had led to disagreements with a partner, family or friends. This measures reported disagreements, not separation, divorce or relationship failure. | Self-selected current and former unpaid carers reached through carer and supporting-organization networks; applicable question bases vary. June–August 2025 10,539 respondents overall; 93% current and 7% former; some items have smaller bases; subgroup counts not supplied. | Original research [S06] Physical p.27 / printed p.26, relationships discussion. |
| F36 | Fifty-nine percent said caring had led them to lose touch with family or friends. Rates were 64% among those caring over 35 hours a week and 45% among those caring under 35 hours. Use the source’s over/under labels. Exactly-35-hour allocation is not explained; the contrast does not establish a causal threshold. | Self-selected current and former unpaid carers reached through carer and supporting-organization networks; applicable question bases vary. June–August 2025 10,539 respondents overall; 93% current and 7% former; some items have smaller bases; subgroup counts not supplied. | Original research [S06] Physical p.39 / printed p.38, family/friend contact paragraph. |
| F37 | Seventy-six percent found it hard to find time with family and friends; 80% caring over 35 hours a week said this, versus 63% caring under 35 hours. Difficulty finding time is a different question from losing touch. Do not identify the overlap between these percentages. | Self-selected current and former unpaid carers reached through carer and supporting-organization networks; applicable question bases vary. June–August 2025 10,539 respondents overall; 93% current and 7% former; some items have smaller bases; subgroup counts not supplied. | Original research [S06] Physical pp.7 and 38 / printed pp.6 and 37. |
| F38 | Seventy-four percent said their caring role made it difficult to form new relationships. The question concerns relationships broadly. It is not a dating-app, marriage or romantic-success rate. | Self-selected current and former unpaid carers reached through carer and supporting-organization networks; applicable question bases vary. June–August 2025 10,539 respondents overall; 93% current and 7% former; some items have smaller bases; subgroup counts not supplied. | Original research [S06] Physical p.39 / printed p.38, Carers struggle to form new relationships. |
| F39 | Forty-three percent of responding carers said they felt lonely. Retain this source’s self-report wording; do not equate it with another survey’s often/always threshold or a clinical assessment. | Self-selected current and former unpaid carers reached through carer and supporting-organization networks; applicable question bases vary. June–August 2025 10,539 respondents overall; 93% current and 7% former; some items have smaller bases; subgroup counts not supplied. | Original research [S06] Physical p.26 / printed p.25. |
| F40 | Twenty-six percent said caring gave them a sense of purpose, and 20% said it improved wellbeing through time with the person they care for. Different positive experiences can overlap; do not add them or infer that everyone else had no benefit. | Self-selected current and former unpaid carers reached through carer and supporting-organization networks; applicable question bases vary. June–August 2025 10,539 respondents overall; 93% current and 7% former; some items have smaller bases; subgroup counts not supplied. | Original research [S06] Physical p.28 / printed p.27, positive aspects of caring. |

The losing-touch difference between the reported higher- and lower-hours groups was 19 percentage points, compared with 17 points for difficulty finding time together (C07–C08). The two questions may involve the same respondents, but the public summary does not identify their person-level overlap. Its under/over-35-hour labels leave the exact boundary unexplained.
Does caregiving also affect relationships at work and time for personal interests?
The UK survey includes both employee-specific difficulties and wider restrictions on activities. The employee question should not be applied to carers who were not working.
| ID | Finding and qualification | Population, actual period and sample | Original source and locator |
|---|---|---|---|
| F41 | Forty percent of responding carers who were employees said caring made it hard to build relationships with colleagues. Employee-only item. This is not the percentage of all carers lacking work friends. | Responding unpaid carers who were employees; State of Caring 2025. June–August 2025 10,539 respondents overall; 93% current and 7% former; some items have smaller bases; subgroup counts not supplied. | Original research [S06] Physical p.8 / printed p.7, employee impacts summary; career discussion. |
| F42 | Sixty-eight percent said caring made them less able to take part in mood-improving activities such as hobbies, volunteering or community activities. Reported reduced participation, not a measured change in mood or proof that a particular activity improves every carer’s wellbeing. | Self-selected current and former unpaid carers reached through carer and supporting-organization networks; applicable question bases vary. June–August 2025 10,539 respondents overall; 93% current and 7% former; some items have smaller bases; subgroup counts not supplied. | Original research [S06] Physical p.7 / printed p.6, opportunity-cost summary. |
For friendship formation and support beyond caregiving, see our friendship statistics resource.
What pressures do sandwich carers describe in the UK analysis?
The August 2026 briefing uses the same 2025 State of Caring survey to compare sandwich and non-sandwich respondents. It is a later analysis, not a separate 2026 survey or independent replication.
| ID | Finding and qualification | Population, actual period and sample | Original source and locator |
|---|---|---|---|
| F43 | Among sandwich-carer respondents, 84% found it hard to take a break and 80% worried about supporting their child and adult relative at the same time. Two separate experiences. Neither is a national estimate of all UK sandwich carers; no overlap is inferred. | Respondents caring for an adult relative, partner or friend while also looking after dependent children; employed-only restriction for work-hours item. Same June–August 2025 survey as S06; not a new 2026 wave Parent study 10,539; sandwich/non-sandwich item and subgroup counts not provided. | Original research [S07] Physical p.1, Summary bullets 1–2. |
| F44 | Bad or very bad mental health was reported by 41% of sandwich carers versus 34% of non-sandwich carers; bad or very bad physical health by 33% versus 29%. Self-rated health, not a diagnosis. The two groups may differ in many ways beyond the sandwich role. | Respondents caring for an adult relative, partner or friend while also looking after dependent children; employed-only restriction for work-hours item. Same June–August 2025 survey as S06; not a new 2026 wave Parent study 10,539; sandwich/non-sandwich item and subgroup counts not provided. | Original research [S07] Physical p.1, Summary bullet 3. |
| F45 | Thirty percent of sandwich carers said they were struggling to make ends meet, compared with 19% of non-sandwich carers. Self-reported financial difficulty, not an official poverty threshold. | Respondents caring for an adult relative, partner or friend while also looking after dependent children; employed-only restriction for work-hours item. Same June–August 2025 survey as S06; not a new 2026 wave Parent study 10,539; sandwich/non-sandwich item and subgroup counts not provided. | Original research [S07] Physical p.1, Summary bullet 4. |
| F46 | Among employed carers, 37% of sandwich carers had reduced work hours, compared with 34% of non-sandwich carers. Employed respondents only. This is not a job-exit or unemployment rate. | Employed current carers in the State of Caring 2025 analysis; sandwich and non-sandwich subgroups. Same June–August 2025 survey as S06; not a new 2026 wave Parent study 10,539; sandwich/non-sandwich item and subgroup counts not provided. | Original research [S07] Physical p.1, Summary bullet 5. |
The difference in struggling to make ends meet was 11 percentage points (C20). Self-rated health, financial difficulty and reduced work hours are separate measures. None supplies a caregiving-caused divorce rate, and the employee-only comparison cannot describe everyone who stopped working.
How do responsibility and choice differ between Australian primary-caregiver roles?
The ABS reasons-for-care table shows different patterns for people caring for a parent, a child or a partner. Its definition of a primary carer is narrower than being any informal helper. The 2022-labelled collection ran from June 2022 to February 2023.
| ID | Finding and qualification | Population, actual period and sample | Original source and locator |
|---|---|---|---|
| F47 | ABS estimates 3.0 million carers, or 11.9% of people living in households, in its 2022 survey; 1.2 million were primary carers. All carers can include children; primary carers are 15+. These two estimated populations must not be treated as the same denominator. | Carers in households provide informal help to people with disability and/or older people 65+; primary carers are 15+ and provide the most assistance with mobility, self-care or communication for at least six months. Household collection 2022-06-12 to 2023-02-25; estimates labelled 2022 13,742 fully responding households; 71.8% household response; separate 1,094 cared-accommodation establishments. Selected carer estimates concern households; item counts not shown. | Original research [S08] Carers key statistics and Primary carers sections. |
| F48 | Forty-three point eight percent of primary carers had disability themselves. The caregiver’s disability status is distinct from the main care recipient’s condition. | Primary carers in Australian households; estimates labelled 2022. Household collection 2022-06-12 to 2023-02-25; estimates labelled 2022 13,742 fully responding households; 71.8% household response; separate 1,094 cared-accommodation establishments. Selected carer estimates concern households; item counts not shown. | Original research [S08] Disability status of carers, primary-carer bullets. |
| F49 | Forty or more weekly care hours were reported by 33.9% of female primary carers and 22.7% of male primary carers. These are rates within each sex, not the sex composition of intensive carers. | Primary carers providing care to their main recipient; sex groups as reported. Household collection 2022-06-12 to 2023-02-25; estimates labelled 2022 13,742 fully responding households; 71.8% household response; separate 1,094 cared-accommodation establishments. Selected carer estimates concern households; item counts not shown. | Original research [S08] Time spent caring, table by sex, 2022. |
| F50 | Common reasons for taking on primary care were family responsibility (64.7%), emotional obligation (47.4%) and believing they could provide better care than anyone else (46.0%). Multiple reasons could be selected; not-stated responses excluded. Believing one can provide better care is not an independent assessment of care quality. | Carers in households provide informal help to people with disability and/or older people 65+; primary carers are 15+ and provide the most assistance with mobility, self-care or communication for at least six months. Household collection 2022-06-12 to 2023-02-25; estimates labelled 2022 13,742 fully responding households; 71.8% household response; separate 1,094 cared-accommodation establishments. Selected carer estimates concern households; item counts not shown. | Original research [S08] Reasons for taking on a caring role, opening bullets. |
| F51 | Family responsibility was selected by 81.9% caring for a parent, 62.9% caring for a child and 59.3% caring for a partner. Having no other choice was selected by 18.9%, 38.7% and 16.2%, respectively. The source’s child of recipient means a carer looking after their parent; parent of recipient means a carer looking after their child. Labels here describe who receives care. Multiple reasons may coexist. | Primary carers in households; relationship to main recipient as labelled. Household collection 2022-06-12 to 2023-02-25; estimates labelled 2022 13,742 fully responding households; 71.8% household response; separate 1,094 cared-accommodation establishments. Selected carer estimates concern households; item counts not shown. | Original research [S08] Primary carers, selected reasons by relationship to main recipient of care, 2022; table and 95% confidence intervals. |

The no-other-choice difference between caring for a child and caring for a partner was 22.5 percentage points (C10). Family responsibility was 22.6 points more commonly selected in parent care than partner care (C11). These reasons can coexist, and they do not measure how much people love a relative or the quality of the care they provide.
Caregiver and recipient roles are easy to reverse when reading this table. A child of the recipient is an adult looking after a parent; a parent of the recipient is looking after their child. The chart translates the labels into the person receiving care.
How much contact do Australian primary carers have, and is it enough?
Contact, satisfaction, desire for more contact and barriers to participation describe different parts of social life. Frequent contact does not demonstrate that someone feels connected or that their social needs are fully met.
| ID | Finding and qualification | Population, actual period and sample | Original source and locator |
|---|---|---|---|
| F52 | In the prior three months, 72.3% of primary carers saw family or friends outside the household at least weekly. Rates were 74.8% for women and 67.4% for men; 98.3% had some non-visit contact. Contact frequency is not relationship quality, satisfaction or absence of loneliness. In-person and non-visit contact overlap. | Carers in households provide informal help to people with disability and/or older people 65+; primary carers are 15+ and provide the most assistance with mobility, self-care or communication for at least six months. Household collection 2022-06-12 to 2023-02-25; estimates labelled 2022 13,742 fully responding households; 71.8% household response; separate 1,094 cared-accommodation establishments. Selected carer estimates concern households; item counts not shown. | Original research [S08] Social and community participation for primary carers, contact-frequency paragraphs. |
| F53 | Sixty-one point two percent of primary carers were satisfied with social participation all or most of the time; 47.8% wanted more contact with family or friends outside their household. Satisfaction was 69.3% at 65+ versus 57.5% at 15–34. Different questions. Wanting more contact does not necessarily mean being dissatisfied; age comparisons are cross-sectional. | Carers in households provide informal help to people with disability and/or older people 65+; primary carers are 15+ and provide the most assistance with mobility, self-care or communication for at least six months. Household collection 2022-06-12 to 2023-02-25; estimates labelled 2022 13,742 fully responding households; 71.8% household response; separate 1,094 cared-accommodation establishments. Selected carer estimates concern households; item counts not shown. | Original research [S08] Social and community participation for primary carers, Satisfaction levels. |
| F54 | Sixty-nine point five percent experienced barriers to social/community participation when attending with the main care recipient. Rates were 80.7% at 40+ care hours a week and 61.4% at 1–19 hours. Attending with the main care recipient is the specific setting; do not generalize this to every outing. Fieldwork overlapped the pandemic period. | Carers in households provide informal help to people with disability and/or older people 65+; primary carers are 15+ and provide the most assistance with mobility, self-care or communication for at least six months. Household collection 2022-06-12 to 2023-02-25; estimates labelled 2022 13,742 fully responding households; 71.8% household response; separate 1,094 cared-accommodation establishments. Selected carer estimates concern households; item counts not shown. | Original research [S08] Social and community participation for primary carers, Barriers to participation. |
The participation-barrier question concerns attending with the main care recipient. It should not be renamed a rate of being unable to leave home. Historical pandemic conditions also form part of the study context.
Can family caregiving strengthen relationships, and how does recognition fit?
Australia’s 2025 Carer Wellbeing Survey reports strengthened recipient relationships and other benefits alongside challenges in wider social relationships, recognition and access to support. The current-carer sample was voluntarily recruited and weighted; it was not randomly assigned to different caring circumstances.
| ID | Finding and qualification | Population, actual period and sample | Original source and locator |
|---|---|---|---|
| F55 | Fifty-six percent of current-carer respondents said caregiving strengthened their relationship with the person they cared for. A positive relational self-report can coexist with burden. No inference about romantic relationship satisfaction or causality is made. | Current unpaid carers 14+ supporting a person with disability, mental illness, dependency, chronic/serious illness, dementia or age-related frailty; selected subgroup items as labelled. 2025-02-19 to 2025-04-30 10,918 valid responses: 9,555 current carers and 1,363 past carers. Current-carer findings selected here; subgroup/item counts not shown beside selected results. | Original research [S09] Physical p.38 / printed p.35, Figure 17 and benefits discussion. |
| F56 | Benefits included learning new skills (62.4%), finding care satisfying (49.9%), finding meaning or purpose (49.9%) and often finding it a positive experience (43.8%). Different benefit statements, potentially overlapping. The figure’s 2025 series is used rather than another survey year. | Current unpaid carers 14+ supporting a person with disability, mental illness, dependency, chronic/serious illness, dementia or age-related frailty; selected subgroup items as labelled. 2025-02-19 to 2025-04-30 10,918 valid responses: 9,555 current carers and 1,363 past carers. Current-carer findings selected here; subgroup/item counts not shown beside selected results. | Original research [S09] Physical p.38 / printed p.35, Figure 17, 2025 series. |
| F57 | Among young carers, 66.9% felt included in decisions and planning, 44.8% felt treated with respect and 42.8% felt their opinions and concerns were heard. Young-carer subgroup in a survey open from age 14, with young carers under 25. Item counts are not published beside these estimates. Separate statements do not identify personal overlap. | Current-carer respondents ages 14–24; young-carer questions. 2025-02-19 to 2025-04-30 Parent current-carer sample n=9,555; young-carer item bases not displayed. | Original research [S09] Physical p.31 / printed p.28, Figure 10 and surrounding text. |
| F58 | Fifty-seven point eight percent did not feel recognised by the community. Healthy wellbeing was reported by 60.7% who felt recognised versus 27.2% who did not. Healthy wellbeing is the report’s Personal Wellbeing Index score above 60 on a 0–100 scale, including relationship and community satisfaction; it is not a diagnosis. Recognition and wellbeing may influence each other, and constructs overlap. This is not an estimated treatment benefit. | Current unpaid carers 14+ supporting a person with disability, mental illness, dependency, chronic/serious illness, dementia or age-related frailty; selected subgroup items as labelled. 2025-02-19 to 2025-04-30 10,918 valid responses: 9,555 current carers and 1,363 past carers. Current-carer findings selected here; subgroup/item counts not shown beside selected results. | Original research [S09] Physical p.41 / printed p.38, Figure 19 and recognition/wellbeing paragraph. |
| F59 | Forty-six percent said caring regularly or always negatively affected relationships with family and friends. Fifty-eight point nine percent never or rarely felt uncomfortable having friends over while with the care recipient. These differ from strengthened relationships with the care recipient. Positive recipient ties and wider relationship strain may coexist, but individual overlap is unknown. Different statements cannot be treated as a net positive-minus-negative score. | Current unpaid carers 14+ supporting a person with disability, mental illness, dependency, chronic/serious illness, dementia or age-related frailty; selected subgroup items as labelled. 2025-02-19 to 2025-04-30 10,918 valid responses: 9,555 current carers and 1,363 past carers. Current-carer findings selected here; subgroup/item counts not shown beside selected results. | Original research [S09] Physical pp.22–23, social-relationships paragraph and frequency-response chart. |
| F60 | Among respite-care users answering the experience items, 61.6% usually felt refreshed, 60.9% felt free to do what they wanted or needed, and 62.8% found services tailored or flexible. Experiences of respite users are not rates among all carers and do not measure a causal effect of respite. Exact eligible item counts not displayed. | Current carers who used respite care and answered the experience items. 2025-02-19 to 2025-04-30 Parent current-carer sample n=9,555; respite-user item bases not displayed. | Original research [S09] Physical p.37 / printed p.34, Figure 16 and preceding bullet list. |
The healthy-wellbeing classification uses a Personal Wellbeing Index score above 60 out of 100; its domains include relationship and community satisfaction. It is not a diagnosis. The difference between people who felt recognised by their community and those who did not was 33.5 percentage points (C17). The researchers warn that perceived recognition and wellbeing may influence each other. It is therefore not a predicted improvement from a specific recognition campaign.
The report’s 56% strengthened-recipient-relationship finding and 46% negative-family/friend-relationship finding concern different statements and relationship scopes. They are not a net positive-minus-negative score. Positive experiences do not cancel out strain, and the public percentages do not identify exactly which respondents reported both. Respite-user experiences also cannot establish how respite would affect every carer who has not used it.
What comparisons does MyLittleDesire contribute?
MyLittleDesire contributes organization, chart design and reproducible descriptive arithmetic. Some contrasts are already visible or discussed in the original reports. These calculations are not original fieldwork, new scientific discoveries, adjusted effects or statistical significance tests. Each stays within a single study and retains the denominator.
| ID | Comparison | Result | Qualification and source |
|---|---|---|---|
| C01 | Canada gender-plus relationship-strain gap, sandwich care | 12.0 percentage points | Descriptive unadjusted difference; no causal effect or significance test. Statistics Canada [S04] |
| C02 | Canada gender-plus relationship-strain gap, adult-only care | 4.1 percentage points | Descriptive unadjusted difference; no causal effect or significance test. Statistics Canada [S04] |
| C03 | Canada gender-plus relationship-strain gap, child-only care | 1.6 percentage points | Descriptive unadjusted difference; no causal effect or significance test. Statistics Canada [S04] |
| C04 | Canada Women+ strain difference, sandwich versus adult-only | 18.1 percentage points | Descriptive unadjusted difference; no causal effect or significance test. Statistics Canada [S04] |
| C05 | Canada Men+ strain difference, sandwich versus adult-only | 10.2 percentage points | Descriptive unadjusted difference; no causal effect or significance test. Statistics Canada [S04] |
| C06 | Canada difference between sandwich and adult-only gender gaps | 7.9 percentage points | Difference of two unadjusted point-estimate gaps. Not an adjusted interaction or statistical test. Statistics Canada [S04] |
| C07 | UK losing-touch gap, over versus under 35 care hours | 19.0 percentage points | Voluntary respondents. Source uses over/under labels; allocation of exactly 35 hours not explained. No causal cutoff inferred. Carers UK [S06] |
| C08 | UK time-with-family/friends difficulty gap, over versus under 35 hours | 17.0 percentage points | Voluntary respondents. Separate question from losing touch. No causal cutoff or individual overlap inferred. Carers UK [S06] |
| C09 | UK losing-touch prevalence ratio, over versus under 35 hours | Approximately 1.42× | Descriptive ratio of rounded reported rates; not a causal risk ratio or significance test. Carers UK [S06] |
| C10 | Australia no-choice difference, child versus partner recipients | 22.5 percentage points | Descriptive unadjusted difference; no causal effect or significance test. Australian Bureau of Statistics [S08] |
| C11 | Australia family-responsibility difference, parent versus partner recipients | 22.6 percentage points | Descriptive unadjusted difference; no causal effect or significance test. Australian Bureau of Statistics [S08] |
| C12 | Australia no-choice difference, child versus parent recipients | 19.8 percentage points | Descriptive unadjusted difference; no causal effect or significance test. Australian Bureau of Statistics [S08] |
| C13 | US daily-care difference, spouse/partner versus parent/in-law | 25.0 percentage points | Daily-care rates within overlapping recipient-relationship groups. Group sample sizes unavailable; no causal or significance claim. Board of Governors of the Federal Reserve System [S03] |
| C14 | US daily-care rate ratio, spouse/partner versus parent/in-law | Approximately 1.78× | Descriptive ratio conditional on each recipient relationship. Groups may overlap; not a causal risk ratio. Board of Governors of the Federal Reserve System [S03] |
| C15 | US relationship-incidence gap, parent/in-law versus spouse/partner | 45.0 percentage points | Different from the daily-care denominators. Respondents can care for multiple relationship types; not a unique share or person-level overlap. Board of Governors of the Federal Reserve System [S03] |
| C16 | US daily-care difference, adult child versus friend/neighbor | 23.0 percentage points | Daily-care rates within different relationship groups that may overlap. No adjusted or causal comparison. Board of Governors of the Federal Reserve System [S03] |
| C17 | Australia healthy-wellbeing difference by perceived community recognition | 33.5 percentage points | Cross-sectional recognition/wellbeing association; reverse causation and confounding possible. Carers Australia / University of Canberra WellRes Unit [S09] |
| C18 | Canada financial-hardship difference, 5+ versus 1–2 care hours/day | 32.0 percentage points | Panel self-reports. Different caregiving-hour groups; no estimate of the effect of adding care hours. Canadian Centre for Caregiving Excellence / Leger [S05] |
| C19 | US purpose difference, choice versus no-choice caregivers | 20.0 percentage points | Self-reported choice and purpose in the same cross-sectional study; no treatment effect. National Alliance for Caregiving and AARP [S01] |
| C20 | UK struggling-to-make-ends-meet gap, sandwich versus other carers | 11.0 percentage points | Same self-selected 2025 wave as the main UK report; not independent replication or population poverty prevalence. Carers UK [S07] |
What questions should readers ask before quoting a caregiving statistic?
Do these studies provide a divorce rate caused by caregiving?
No verified caregiving-caused divorce rate is established by the selected evidence. The UK disagreement item includes partners, family and friends. Canadian relational strain is also broader than ending a romantic relationship.
Does a higher percentage mean one country has a bigger caregiving problem?
Not from these results alone. Population ages, care-recipient needs, paid/unpaid scope, ordinary childcare and recruitment differ. A fair international comparison would require matched definitions and methods.
Do positive and negative experiences describe separate groups?
They may overlap. Separate percentages about purpose, relationships and strain do not reveal whether the same individuals reported each experience. Do not add or subtract them to manufacture an overlap estimate.
Are parent-care and partner-care percentages interchangeable?
No. A main-recipient question differs from naming every relationship someone cares for. The proportion of caregivers who care for a partner also differs from the proportion of partner carers who provide care daily.
How were the sources selected, checked and compared?
Original research reports, government tables and public methods were reviewed. Each finding records the original organization, direct URL, publication and fieldwork periods, population, sample availability, method, locator, definition, caveat and date checked. Related response categories are grouped instead of counted as separate headline statistics. The core contains 60 grouped findings and 177 numeric inputs across nine reports and eight survey programs.
NAC/AARP and BLS original PDFs, ABS tables and methods, and Statistics Canada tables were read directly. Other publisher PDFs and Federal Reserve pages were read through public web retrieval when a direct host download was unavailable. Selected NAC/AARP report pages were also visually inspected, including the working-caregiver chart and its inconsistent loneliness base. Verification confirms what a publisher reports; it does not independently audit respondents or reproduce fieldwork.
The two Carers UK reports share one 2025 survey. Some programs also share a fieldwork provider. Report counts do not establish independent replication. Methods range from probability household/panel designs to opt-in surveys; demographic weights do not erase selection or nonresponse limits.
Original confidence intervals are retained for the Canadian relationship-strain and Australian reasons-for-care charts. Point differences use readable rounding and named input IDs; no new significance tests are claimed. Missing subgroup counts remain unavailable. Changing the research workbook does not automatically rebuild the static article or chart images.
Which findings were held back?
The NAC/AARP loneliness chart prints a base exceeding the study’s completed sample, so its result is excluded rather than silently correcting the denominator. A Statistics Canada employment headline that does not reconcile simply with its subgroup table is also excluded. Other verified findings from those reports remain separately documented.
A Carers Australia release dated October 15, 2026 was located. It explicitly labels the data preliminary and subject to change. Its figures are not counted in the 60 confirmed findings or merged with the fully documented 2025 report. The final report and full methods are a future update point.
What remains uncertain?
- Some exact item and subgroup counts, recruitment details or weighting information are not publicly supplied.
- Self-reported disagreements, strain, purpose and health are different constructs and do not establish causality.
- Overlapping relationship categories and separate marginal percentages do not identify person-level overlap.
- Historical and current-edition findings do not provide forecasts of 2027 caregiving.
- No harmonized international prevalence comparison, relationship-failure rate or universally effective support intervention is inferred.
Complete original-source bibliography
- S01 · National Alliance for Caregiving and AARP. Caregiving in the US 2025. Published: 2025-07-24. Actual field period: 2024-08-06 to 2024-10-14; previous-12-month caregiving. Sample: 6,858 caregivers: 5,106 KnowledgePanel and 1,752 opt-in; adult-recipient base usually 6,549; exact bases differ by item.. Method: Ipsos probability-recruited KnowledgePanel plus opt-in state supplements; weighted online English/Spanish survey. Appendix B, physical pp.115–128.. Limitations: 2025 is report edition, not fieldwork year. Paid family caregivers were added this cycle, limiting naive comparisons with earlier unpaid-only cycles. Overall and item bases differ. Figure 37 prints an impossible n=9,549 and is excluded.
- S02 · US Bureau of Labor Statistics / US Census Bureau. Unpaid Eldercare in the United States—2023–2024: Data from the American Time Use Survey. Published: 2025-09-25. Actual field period: Combined 2023–2024 averages; eldercare screening refers to prior three to four months, diary to prior day. Sample: Approximately 16,000 ATUS interviews in 2023–2024, including approximately 2,500 eldercare providers; subgroup counts not stated beside selected estimates.. Method: Continuous probability household survey from outgoing CPS households; one randomly chosen person 15+; telephone previous-day time diary; weighted combined-year estimates.. Limitations: Narrower recipient age and need definition than general family-caregiver surveys. Usual care frequency, participation on a diary day and hours conditional on actually caring are distinct.
- S03 · Board of Governors of the Federal Reserve System. Economic Well-Being of U.S. Households in 2025: Living Arrangements and Care Work. Published: Report May 2026; section updated 2026-05-26; methods updated 2026-06-10. Actual field period: 2025-10-17 to 2025-10-28. Sample: 12,934 final respondents after quality exclusions; 13,099 completed before exclusions; item and relationship-group counts not shown.. Method: Ipsos address-based probability-recruited KnowledgePanel, online; weighted to US adults. Methods describe nonresponse and imputation.. Limitations: Caregiving is regular unpaid care; low-frequency or irregular care may not be captured. Relationship types can overlap. Mothers and fathers are separate respondents, not matched couples. Ordinary childcare appears only as separately labelled context.
- S04 · Statistics Canada. Sandwiched between unpaid care for children and care-dependent adults: A gender-based study. Published: 2024-04-02. Actual field period: 2022-07-15 to 2022-08-28; previous-12-month unpaid care. Sample: 9,767 total respondents, including 4,200 unpaid caregivers; exact table subgroup counts not published.. Method: Canadian Social Survey Wave 6; population and bootstrap weights; 56.5% response rate; descriptive tables with 95% confidence intervals. Census linkage supplies some household characteristics.. Limitations: Ordinary childcare is included, unlike several other sources. Men+/Women+ groupings distribute some non-binary respondents for confidentiality. Table 5 employment estimates do not reconcile simply with the headline 66%; that employment claim is excluded.
- S05 · Canadian Centre for Caregiving Excellence / Leger. Caring in Canada: Survey insights from caregivers and care providers across Canada. Published: May 2024, stated on the PDF publication page; exact day not stated. Actual field period: Panel: 2023-07-20 to 2023-08-28; separate open link: 2023-07-20 to 2023-09-16. Sample: Panel n=2,159: 1,977 caregiver-only, 106 dual caregiver/care-provider and 76 paid-care-provider-only; separate open link n=940. Item/subgroup counts not displayed.. Method: Leger online panel with targeted caregiver recruitment and oversampling; demographics matched to caregiver population. Unless otherwise noted, report statistics use panel data; open-link responses provide a separate secondary view.. Limitations: Do not treat 3,099 combined participants as the unpaid-caregiver base. Online panel is not described as probability recruited. Paid-only care-provider findings excluded here. Source descriptions of representativeness do not remove selection/nonresponse limits.
- S06 · Carers UK. State of Caring 2025: The cost of caring—the impact of caring across carers’ lives. Published: October 2025. Actual field period: June–August 2025. Sample: 10,539 respondents overall; 93% current and 7% former; some items have smaller bases; subgroup counts not supplied.. Method: Voluntary online survey promoted via members, previous respondents, social media and partner organizations; explicitly not representative.. Limitations: These percentages describe respondents, not all UK carers. Sample has a high share of women and intensive carers. The text uses under/over-35-hour labels without explaining the allocation of exactly 35 hours.
- S07 · Carers UK. Sandwich carers: pulled in all directions. Published: 2026-08-18. Actual field period: Same June–August 2025 survey as S06; not a new 2026 wave. Sample: Parent study 10,539; sandwich/non-sandwich item and subgroup counts not provided.. Method: Secondary analysis of the voluntary State of Caring 2025 survey; explicitly not a representative survey; report also discusses external research not counted here.. Limitations: Shares respondents and recruitment with S06. Four included findings use Carers UK’s own survey, not unverified external numbers quoted in the briefing. No causal effects or population prevalence inferred.
- S08 · Australian Bureau of Statistics. Disability, Ageing and Carers, Australia: Summary of Findings, 2022. Published: 2024-07-04. Actual field period: Household collection 2022-06-12 to 2023-02-25; estimates labelled 2022. Sample: 13,742 fully responding households; 71.8% household response; separate 1,094 cared-accommodation establishments. Selected carer estimates concern households; item counts not shown.. Method: National Survey of Disability, Ageing and Carers; probability household sample, household interviews plus self-completion primary-carer questions; population weighting and confidence intervals.. Limitations: Population counts are estimates, not sample sizes. Approximately 27% of primary carers did not complete self-completion questionnaire. Multiple reasons may be selected. All-carer and primary-carer bases differ.
- S09 · Carers Australia / University of Canberra WellRes Unit. 2025 Carer Wellbeing Survey report. Published: October 2025; PDF filename dated 2025-10-08. Actual field period: 2025-02-19 to 2025-04-30. Sample: 10,918 valid responses: 9,555 current carers and 1,363 past carers. Current-carer findings selected here; subgroup/item counts not shown beside selected results.. Method: Voluntary online/paper survey via previous participants, carer/service networks and social advertising. Current carers weighted by gender, age, state, labour-force status and care hours; past carers unweighted.. Limitations: Weights improve demographic alignment but do not make recruitment random. Cross-sectional recognition/wellbeing associations can operate in both directions. Preliminary October 2026 releases located but not merged into the confirmed core.
How to cite this family caregiving resource
For this compilation, a MyLittleDesire chart or a descriptive calculation, credit this resource and the underlying study. For an individual survey finding, consult and cite the original research directly.
MyLittleDesire. Family Caregiving and Relationship Statistics 2027: Partners, Parents and Support. 2027 editorial edition. https://mylittledesire.com/family-caregiving-statistics/. Add the actual access date if your citation style requires it.