
People use AI for company, advice, friendship and sometimes romantic conversation. Those experiences do not all describe the same relationship. A useful account of digital relationships keeps actual behavior separate from hypothetical interest, and broad chatbot use separate from dedicated companion apps.
This resource organizes 60 grouped findings from 14 survey programs, with three additional papers for research context. The 17 original-source records are not 17 independent replications. Four original chart designs and 17 reproducible descriptive calculations help readers compare definitions, denominators and questions. MyLittleDesire contributes synthesis and verification, rather than new survey fieldwork.
What are the key AI companion and digital relationship statistics?
4% / 10%
10%
Pew found companionship / emotional support or advice use among all US adults in February 2026. These are different purposes. Pew Research Center / SSRS [S17].
Reported an ongoing personal AI friendship in YouGov’s June 2026 US adult-citizen poll. YouGov [S03].
5%
13%
Ever used a chatbot for romantic or sexual companionship in that YouGov poll; not necessarily a continuing relationship. YouGov [S03].
Confided a previously undisclosed secret or problem to AI in the same poll. This is separate from romantic use. YouGov [S03].
27%
31% vs 17%
Of internet-using US adults met Elon’s broad social/emotional use definition, which includes general tools and entertainment. Elon University Imagining the Digital Future Center / Elon University Poll [S01].
Elon’s target users answered differently to a direct friendship question and a three-option relationship description. These are different questions. Elon University Imagining the Digital Future Center / Elon University Poll [S01].
72% / 52%
≈23.8%
US teens in Common Sense’s 2025 study had ever used / regularly used a broadly defined companion. Regular includes a few times monthly. Common Sense Media / NORC at the University of Chicago [S06].
Approximate all-teens equivalent of the 33% users-only serious-conversation finding: 72% × 33% (C07). Common Sense Media / NORC at the University of Chicago [S06].
45% vs 31%
78% vs 8%
Discussed feelings with AI among US youth AI users reporting loneliness at least sometimes versus hardly ever/never, in 2026. Association only. Common Sense Media / Echelon Insights / SSRS [S07].
Australian children had used assistants versus dedicated companions in eSafety’s product-based classification. Not comparable to the US 72%. Australian eSafety Commissioner [S09].
64% / 40%
15%
US singles in Match’s study saw potential dating assistance / would refuse a human date who uses a companion app. Separate questions. Match Group Research Team [S04].
Of a partnered US young-adult quota sample often chatted with romantic AI. “Often” is not a defined daily-use threshold. Wheatley Institute / Institute for Family Studies [S12].
What counts as an AI companion or digital relationship?
There is no single adoption percentage that covers every definition. Surveys may ask about a product, a purpose, a self-described friendship or a romantic experience. The population and eligible question base matter just as much as the word “companion.”
| Measure | What it describes | What it cannot establish |
|---|---|---|
| General chatbot use | Use of an assistant for any purpose | A friendship, romance or dedicated-app audience. |
| Companionship purpose | Using a general or specialist chatbot for company | A sustained relationship or romantic attachment. |
| Dedicated companion product | Apps classified or marketed for simulated social relationships | All relational use of general assistants. |
| Ongoing AI friendship | A respondent’s description of a continuing personal connection | A reciprocal human friendship or clinical outcome. |
| Romantic or sexual companionship | An ever-use experience that can include either category | A current romantic partnership or the share of people choosing AI over humans. |
| Hypothetical acceptance | What people could imagine, consider or refuse | Actual adoption or future behavior. |
| Perceived benefit or public opinion | Self-reported feelings or beliefs about AI effects | Clinical effectiveness, product safety or a causal effect. |
How many US adults use AI for company or emotional support?
Pew’s February 2026 survey found 4% of US adults used chatbots for companionship and 10% for emotional support or advice. It surveyed 5,119 adults through the American Trends Panel. These all-adult estimates differ from questions about ongoing friendship or broader emotional/social uses. Pew Research Center / SSRS [S17].
| ID | Finding and qualification | Population, period and sample | Source and locator |
|---|---|---|---|
| F59 | 10% of US adults used chatbots for emotional support or advice; 4% for companionship. Separate nonexclusive purposes among all adults, not only chatbot users. Neither is equivalent to romance or dedicated-app use. Different questions from YouGov and Elon; do not pool or infer growth. | US adults 18+ 2026-02-17 to 2026-02-23 5,119 US adults | Original research [S17] Main report, Search and work are the most common uses table; methodology Wave 187 |
Is actual use the same as willingness to form a relationship?
No. YouGov asked separately about past experiences and possible future bonds. Its April 2026 task questions used randomized task subsamples; emotional-bond and romantic-relationship questions used larger item bases. A person considering a relationship has not necessarily had one.
| ID | Finding and qualification | Population, period and sample | Source and locator |
|---|---|---|---|
| F10 | 14% had used AI for companionship conversation; another 14% had not but would consider it. Ever-use and consideration are separate response categories. Task item asked of a random subsample; neither necessarily means romantic or dedicated-app use. | US adult citizens, 18+ 2026-04-01 to 2026-04-05 697 asked companionship task; overall survey n=1,082 | Original research [S02] PDF physical p.2 summary; physical p.30 / printed p.23, item 4S |
| F11 | 25% had sought advice on a personal matter; 6% reported using AI for therapy. Broad advice is different from self-described therapy. No judgement of treatment effectiveness follows; personal advice was asked of a random task subsample. | US adult citizens, 18+ 2026-04-01 to 2026-04-05 Personal-advice item n=714; self-described therapy item n=1,080; overall n=1,082 | Original research [S02] PDF physical p.24 / printed p.17, item 4M; p.57 / printed p.50, item 9 |
| F12 | 1% said a deep emotional bond already existed; 10% said they definitely or probably could form one. Already-existing bond and hypothetical possibility are different categories; neither includes every form of casual companionship. | US adult citizens, 18+ 2026-04-01 to 2026-04-05 Item 21 n=1,077; overall n=1,082 | Original research [S02] PDF physical p.85 / printed p.78, item 21; published 10% NET in original analysis |
| F13 | 1% reported an existing romantic AI relationship; the publisher’s possible-relationship NET was 6%. The published NET is not replaced by adding rounded 2% and 3% components. Ever romantic/sexual companionship in June uses a broader question; no growth rate is inferred. | US adult citizens, 18+ 2026-04-01 to 2026-04-05 Item 22 n=1,075; overall n=1,082 | Original research [S02] PDF physical p.86 / printed p.79, item 22; original May 12 article publishes 6% NET |
Do not treat Pew’s February companionship rate, YouGov’s April conversation rate and Elon’s May broad-use rate as consecutive measurements of growth. Their questions, samples and definitions differ. The possible-romance NET is attributed as YouGov published it; rounded response categories cannot reliably recreate the underlying unrounded NET.
How common are AI friendship, romantic use and private disclosure?
In one June 2026 YouGov survey, private disclosure and ongoing AI friendship were reported more often than romantic or sexual companionship. The questions describe different experiences, with item bases of 1,125 or 1,126 US adult citizens. They do not reveal which respondents did several of these things.
| ID | Finding and qualification | Population, period and sample | Source and locator |
|---|---|---|---|
| F14 | 5% reported ever using a chatbot for romantic or sexual companionship; 8% would consider it. Romantic OR sexual companionship, not a sustained relationship. All adult citizens, not only chatbot users. | US adult citizens, 18+ 2026-06-26 to 2026-06-29 Item n=1,125; ages 18–29 n=290 | Original research [S03] PDF physical p.37 / printed p.33, item 8A |
| F15 | 10% reported an ongoing personal AI friendship; among ages 18–29 the share was 18%. The all-age group includes younger adults. Cross-sectional age difference, not a generation’s change over time. | US adult citizens, 18+ 2026-06-26 to 2026-06-29 Item n=1,126; ages 18–29 n=290 | Original research [S03] PDF physical p.39 / printed p.35, item 8C |
| F16 | 13% confided a previously undisclosed problem or secret to AI; the share was 23% among ages 18–29. Disclosure is not automatically romance or cheating. No joint-response table identifies which secret-sharers also reported romantic/sexual use. | US adult citizens, 18+ 2026-06-26 to 2026-06-29 Item n=1,126; ages 18–29 n=290 | Original research [S03] PDF physical p.40 / printed p.36, item 8D |
| F17 | 9% had hidden how much they used AI from a partner or family member; 18% of adults under 30 had done so. Any AI use can be hidden; the question is not limited to romantic companion use or romantic partners. | US adult citizens, 18+ 2026-06-26 to 2026-06-29 1,125 item base; ages 18–29 n=290 | Original research [S03] Original July 1 article; PDF physical p.41 / printed p.37, item 9A |
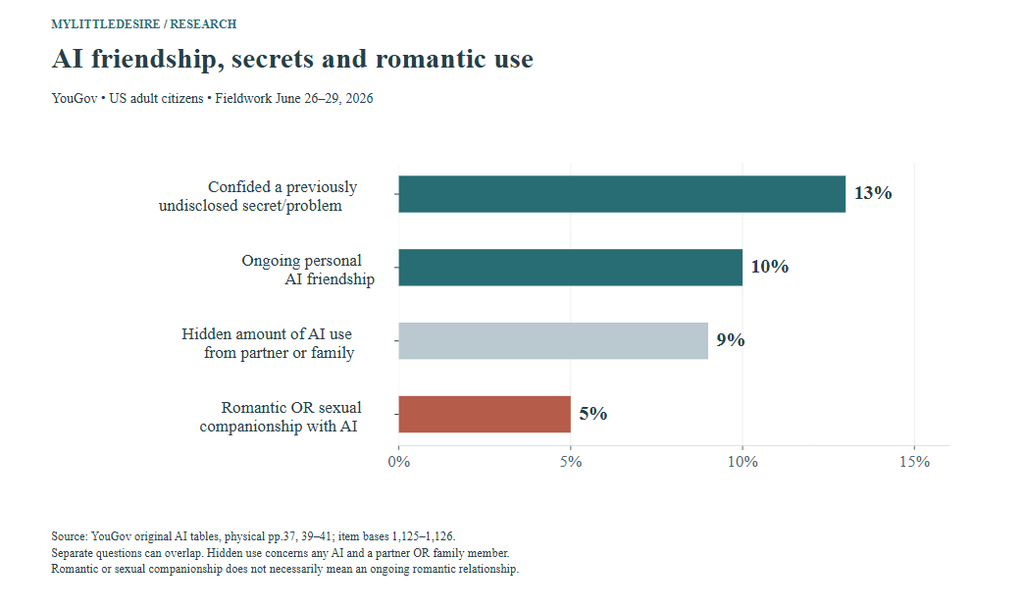
The secret-disclosure rate was 8 percentage points higher than romantic/sexual use and approximately 2.60 times its marginal rate (C01, C03). These are comparisons between separately measured rates. They do not show that private disclosure leads to romance. The hidden-use question covers any AI and concealment from a partner or family member, so it cannot be relabelled “secret AI affairs.”
For the different subject of human matching platforms, see our online dating and dating app statistics.
What do broadly defined social and emotional AI users report?
Elon’s broad definition captures more than romantic companionship. Its detailed questions focus on 1,000 qualifying users drawn through an adult internet-user screening survey. Their answers must not be presented as percentages of every American adult.
| ID | Finding and qualification | Population, period and sample | Source and locator |
|---|---|---|---|
| F01 | 27% of adult internet users qualified under the study’s broad companion-use definition. Broad social/emotional purposes, including entertainment; not a romantic-use prevalence. Weighted percentage, not 1,000 divided by 4,031. | US adult internet users 18+ 2026-05-18 to 2026-05-22 4,031 matched screening sample; 1,000 target users | Original research [S01] PDF physical p.4, Companion Use Among All U.S. Adults; cover/method pp.1–2 |
| F02 | Among qualifying users, 38% sought personal advice, 32% discussed feelings, 20% used AI for loneliness and 9% for romantic chat. All percentages in this row use the 1,000 target users. Multi-select purposes overlap; a romantic chat is not necessarily a sustained relationship. | Broad social/emotional AI users 18+ 2026-05-18 to 2026-05-22 1,000 target users; item n not separately printed | Original research [S01] PDF physical p.9 / printed p.2, item 2 |
| F03 | 45% selected tool-only, 38% mainly a tool with friendly chats, and 17% friend/confidant. Three-option relationship description among qualifying users. This wording differs from the separate direct friendship question. | Broad social/emotional AI users 18+ 2026-05-18 to 2026-05-22 1,000 target users | Original research [S01] PDF physical p.20 / printed p.13, item 10 |
| F04 | 31% answered yes to considering AI a friend; 15% chose a more-complicated relationship. Different question and answer options from item 10. Do not call the 14-point difference a change over time or a causal wording effect. | Broad social/emotional AI users 18+ 2026-05-18 to 2026-05-22 1,000 target users | Original research [S01] PDF physical p.92 / printed p.85, item 66 |
The direct friendship answer was 14 percentage points higher than the friend/confidant option in a separate three-option question (C04). That is a useful warning about question design, rather than a controlled test proving that wording caused the difference. Personal advice also exceeded romantic chat by 29 points within the same target-user group (C05).
Do reported support and emotional connection prove AI has feelings?
These findings describe people’s perceptions. Feeling understood, supported or connected does not demonstrate that a system understands, cares or has emotions. Anticipated loss of access is also different from observed bereavement or diagnosed dependence.
| ID | Finding and qualification | Population, period and sample | Source and locator |
|---|---|---|---|
| F05 | 59% felt AI gave needed support; 43% felt it understood them as a person. Self-reported agreement, not independently demonstrated empathy, clinical benefit or proof that AI has feelings. | Broad social/emotional AI users 18+ 2026-05-18 to 2026-05-22 1,000 target users | Original research [S01] Original report landing page, key findings; strongly/somewhat agree items |
| F06 | 39% felt AI understood them better than most people; 36% felt it cared about their wellbeing. People’s perceptions of a system, not claims that the system actually understands or cares. Separate agreement questions can overlap. | Broad social/emotional AI users 18+ 2026-05-18 to 2026-05-22 1,000 target users | Original research [S01] Original report landing page, key findings |
| F07 | 36% felt emotionally connected to an AI tool; 38% anticipated personal loss if access ended. Agreement measures, not diagnosed dependence, observed bereavement or a loss rate among every AI user. | Broad social/emotional AI users 18+ 2026-05-18 to 2026-05-22 1,000 target users | Original research [S01] Original report landing page, attachment-related key findings |
| F08 | 53% turned to AI for difficult interpersonal situations; 51% felt better when stressed and 50% discussed personal problems. Distinct self-report statements, not mutually exclusive uses or a measured treatment response. | Broad social/emotional AI users 18+ 2026-05-18 to 2026-05-22 1,000 target users | Original research [S01] Original report landing page and news release, agreement findings |
| F09 | 83% had used ChatGPT and 8% Character.AI in the preceding six months. Within the broad companion-user sample, any recent use of each platform is measured. This does not identify which tool supplied companionship or global platform market shares. | Broad social/emotional AI users 18+ 2026-05-18 to 2026-05-22 1,000 target users | Original research [S01] PDF physical p.11 / printed p.4, item 3 |
The platform-use question records any use in the preceding six months among these respondents. It does not identify which platform provided their emotional support, and it is not a global market-share table.
Can singles welcome AI assistance while drawing relationship boundaries?
Yes, these are different decisions. Match’s original research asked US singles about potential help with dating and attitudes toward companions. It does not publish respondent-level overlap between those views.
| ID | Finding and qualification | Population, period and sample | Source and locator |
|---|---|---|---|
| F18 | 47% viewed AI in romantic contexts negatively. Opinion among surveyed singles aged 18–39, not the share who tried or rejected an AI partner. | US singles aged 18–39; some findings restricted to ages 18–24 or women 18–24 2026-04-13 to 2026-05-08 Approximately 1,000 overall; achieved item/subgroup counts not published | Original research [S04] Where Singles Draw the Line, opening paragraph |
| F19 | 40% would refuse to date a person who used a companion app; the share was 51% among women 18–24. This concerns dating a human who uses a companion app. It is not the share refusing to date an AI or every US adult; subgroup n unknown. | US singles aged 18–39; some findings restricted to ages 18–24 or women 18–24 2026-04-13 to 2026-05-08 Approximately 1,000 overall; achieved item/subgroup counts not published | Original research [S04] Where Singles Draw the Line, dating-dealbreaker paragraph |
| F20 | 12% of singles aged 18–24 had tried a companion app within the previous three months. Three-month use among an age subset, not ever-use or a rate for all singles aged 18–39. | US singles aged 18–24 in sponsor survey 2026-04-13 to 2026-05-08 Age-cell and achieved item counts unavailable | Original research [S04] Where Singles Draw the Line, experimentation paragraph |
| F21 | Among those young app experimenters, reasons included entertainment 45%, role-play 43%, connection 38% and processing emotions 26%. Conditional on 18–24-year-old recent app experimenters. Multiple reasons can overlap; no inference that most users had no connection motive. | 18–24-year-old singles who tried a companion app in prior three months 2026-04-13 to 2026-05-08 Small filtered cell n not published | Original research [S04] Experimentation paragraph, motives |
| F22 | For deeper advice, 60% turned to friends, 60% to family and 20% to AI. Overlapping advice sources. No shares of all advice episodes, no therapy outcome and no exclusivity inferred. | US singles aged 18–39; some findings restricted to ages 18–24 or women 18–24 2026-04-13 to 2026-05-08 Approximately 1,000 overall; achieved item/subgroup counts not published | Original research [S04] Personal-advice paragraph |
| F23 | 64% saw potential dating assistance; suggested tasks included keeping conversations going 27%, profiles 27%, starting chats 26% and date planning 24%. Perceived potential, not actual feature adoption. Separate questions and tasks can overlap; published wording does not reveal respondent-level overlap with refusal attitudes. | US singles aged 18–39; some findings restricted to ages 18–24 or women 18–24 2026-04-13 to 2026-05-08 Approximately 1,000 overall; achieved item/subgroup counts not published | Original research [S04] Where Singles Welcome It |
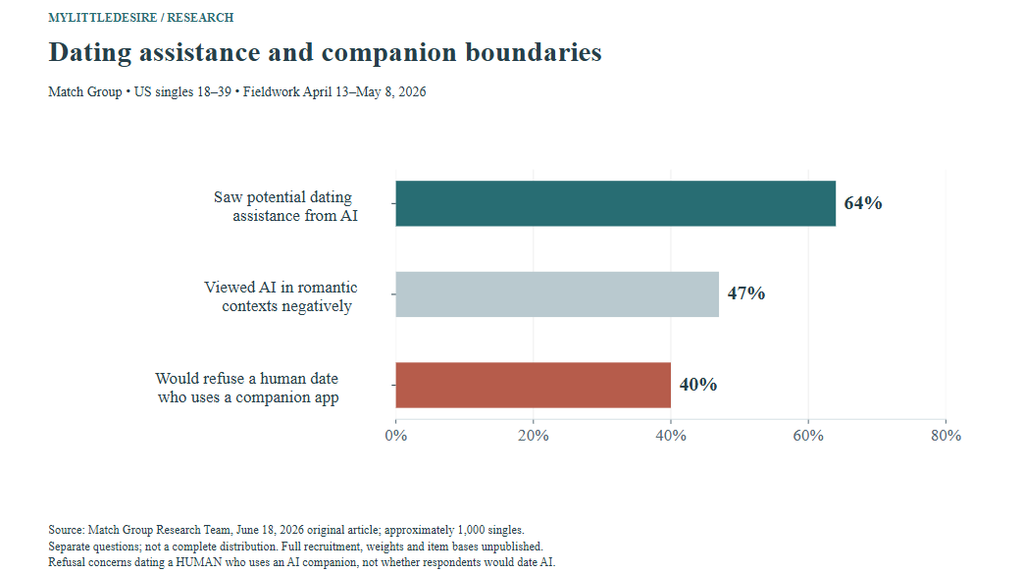
The 24-point difference between potential assistance and refusing a human date who uses a companion app (C14) cannot identify a group holding both views. Likewise, suggested profile or conversation tasks measure interest in help, rather than confirmed use. The company’s public article does not provide full recruitment, weighting or subgroup counts.
What does Canadian research show about emotional AI use?
Narrative Research’s Canadian summary supports cautious bounds, not precise companionship adoption. The overall use finding and the AI-user relationship-description finding have different denominators.
| ID | Finding and qualification | Population, period and sample | Source and locator |
|---|---|---|---|
| F24 | More than 60% of Canadians used at least one AI-based tool or service. A lower-bound description, not an exact 60% or companion-use rate. General AI is included. | Canadian adults 18+; relationship description restricted to AI users 2026-03-12 to 2026-03-16 1,230 overall; AI-user item n unavailable in readable summary | Original research [S05] Original summary, second paragraph |
| F25 | Fewer than 10% of AI users described their interaction as primarily emotional or mainly social/conversational. Preserve the upper-bound language and AI-user base. This does not count all occasional friendly interactions, every Canadian or a romantic relationship rate. | Canadian AI users 18+ 2026-03-12 to 2026-03-16 1,230 overall; filtered AI-user count not retrievable | Original research [S05] Original summary, relationship-description paragraph |
The linked tables and chart could not be retrieved during review. The summary’s “more than” and “fewer than” language is preserved. These results do not support a Canada-versus-US adoption ranking or a precise ratio between the two Canadian findings.
Why do two “one in three teens” headlines mean different things?
One finding uses all teens; the other uses only companion users. Common Sense Media’s 2025 survey includes broad relational uses of general AI. Its researchers explicitly warn that respondents may conflate general AI with companion use.
| ID | Finding and qualification | Population, period and sample | Source and locator |
|---|---|---|---|
| F26 | 72% had ever used a companion, 52% used one regularly and 13% daily. All teens n=1,060 for all three rates. Regular means at least a few times monthly, not daily. Broad definition can include general chatbots used socially. | US teens aged 13–17; some items only companion users 2025-04-30 to 2025-05-14 All teens n=1,060 | Original research [S06] PDF physical p.6 / printed p.2, Figure A and usage paragraph |
| F27 | 33% used or viewed companions in social/relationship roles; 46% saw them as tools. Both use all teens, with multiple responses allowed. Social roles include several different uses; 33% is not a romantic-only rate. | US teens aged 13–17; some items only companion users 2025-04-30 to 2025-05-14 All teens n=1,060 | Original research [S06] PDF physical p.7 / printed p.3, Figure B |
| F28 | Among users, motives included entertainment 30%, curiosity 28%, advice 18% and constant availability 17%. Users-only n=758; up to three reasons. A motive is not verified benefit or share of all teens. | US teen companion users 13–17 2025-04-30 to 2025-05-14 Users n=758 | Original research [S06] PDF physical p.8 / printed p.4, Figure C |
| F29 | 23% trusted companion information quite a bit/completely, 27% somewhat and 50% little/not at all. All teens n=1,060, including nonusers. Do not re-label this as trust among companion users only. | US teens aged 13–17; some items only companion users 2025-04-30 to 2025-05-14 All teens n=1,060 | Original research [S06] PDF physical p.9 / printed p.5, Figure D |
| F30 | 10% found AI conversations more satisfying than friends, 21% about equal and 67% less satisfying. All teens, including nonusers; 2% no response. This is an appraisal, not a controlled test of friendship quality. | US teens aged 13–17; some items only companion users 2025-04-30 to 2025-05-14 All teens n=1,060 | Original research [S06] PDF physical p.9 / printed p.5, Figure E |
What did companion users report about serious conversations and private information?
These user-only findings should retain their user-only labels. Re-expressing them on an all-teens denominator requires a clearly marked approximation, rather than silently replacing the source percentage.
| ID | Finding and qualification | Population, period and sample | Source and locator |
|---|---|---|---|
| F31 | 80% of users spent more time with friends; 6% spent more with companions. Separately, 34% experienced discomfort. Users-only n=758. Time allocation and discomfort are different questions; no response intersection or proven clinical harm is inferred. | US teen companion users 13–17 2025-04-30 to 2025-05-14 Users n=758 | Original research [S06] PDF physical p.11 / printed p.7, Figures G and H |
| F32 | 33% of users had chosen AI over a person for an important or serious conversation; 24% shared private information. Both use users-only n=758, not all teens. Published 24% NET is retained despite rounded frequency categories summing to 25%. | US teen companion users 13–17 2025-04-30 to 2025-05-14 Users n=758 | Original research [S06] PDF physical p.12 / printed p.8, Figures I and J |
| F33 | 39% of users reported applying skills practiced with AI in real situations, including 18% conversation starters and 13% expressing emotions. Self-reported transfer, not objectively measured improvement or a causal benefit. Multiple skills can overlap. | US teen companion users 13–17 2025-04-30 to 2025-05-14 Users n=758 | Original research [S06] PDF physical p.10 / printed p.6, Figure F |
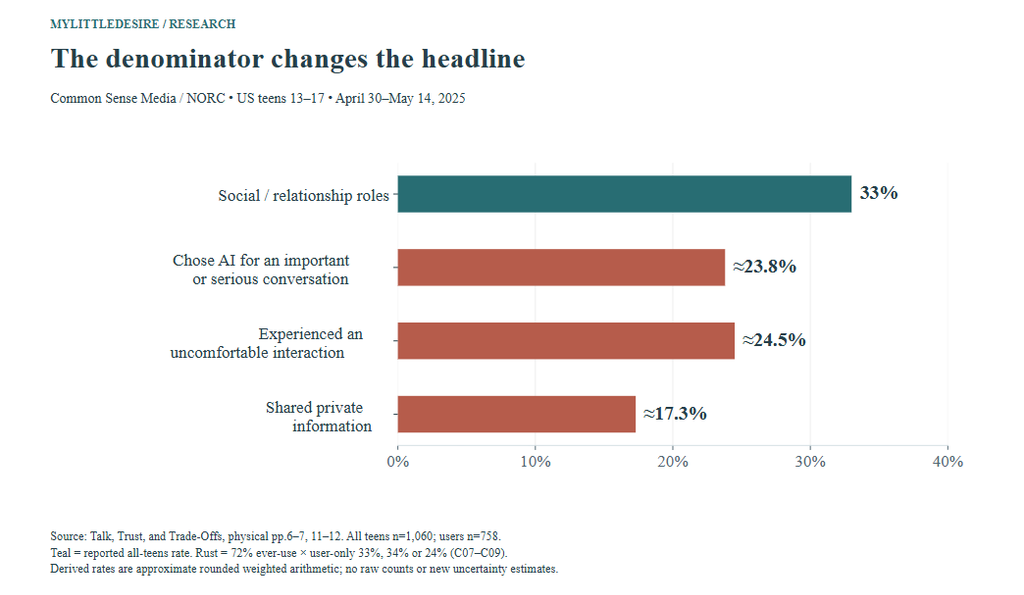
For example, 72% ever-use multiplied by the users-only 33% serious-conversation finding is approximately 23.8% of all teens (C07). The discomfort and private-information equivalents are approximately 24.5% and 17.3% (C08–C09). They use rounded weighted percentages; they are not exact raw sample proportions. Outcomes can overlap. The ratio of regular use to ever-use is approximately 72.2% (C06), not a measured retention rate.
How does social AI use vary with loneliness and friendship difficulty?
Common Sense’s separate 2026 census found greater social and emotional AI use among youth reporting loneliness or difficulty making friends. It covers ages 9–17 and any AI, so it is not a comparable follow-up measure of the 2025 companion-use percentage.
| ID | Finding and qualification | Population, period and sample | Source and locator |
|---|---|---|---|
| F34 | 40% of AI users practiced conversation/social skills; 37% discussed feelings or personal problems. Any-AI users n=1,032 aged 9–17; not solely dedicated-companion users or all children. | US any-AI users aged 9–17 2026-03-18 to 2026-03-26 Any-AI users n=1,032 | Original research [S07] PDF physical p.23 / printed p.20, Figure 14 |
| F35 | Among lonely AI users, 46% practiced social skills versus 36% among those seldom/never lonely; feelings discussion was 45% versus 31%. Cross-sectional associations. Lonely group includes always/often/some of the time. Conditional group n unavailable in figure; no evidence which came first. | Any-AI users 9–17 grouped by reported loneliness 2026-03-18 to 2026-03-26 Any-AI users n=1,032; loneliness-cell counts not shown | Original research [S07] PDF physical p.26 / printed p.23, Figure 15 |
| F36 | For those finding friends very/pretty hard, social practice was 47% versus 37% for no difficulty; feelings discussion was 48% versus 31%. Self-reported social difficulty, not a diagnosis. Different groups can differ in many other ways; no causal or intervention effect. | Any-AI users 9–17 grouped by friendship difficulty 2026-03-18 to 2026-03-26 Any-AI users n=1,032; conditional cell counts not shown | Original research [S07] PDF physical p.26 / printed p.23, Figure 15 |
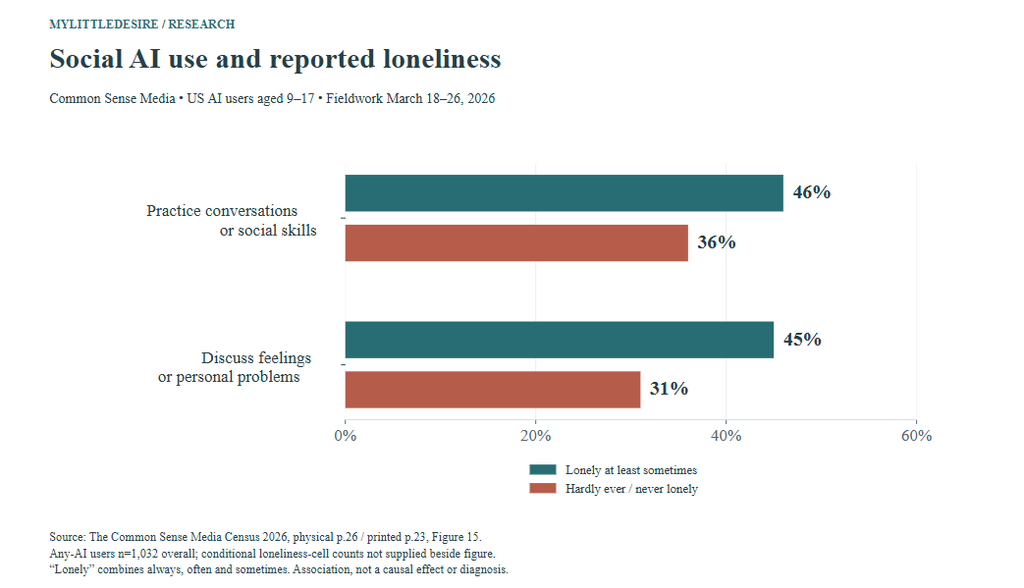
The feelings-discussion difference by loneliness is 14 percentage points; by friendship difficulty it is 17 points (C11–C12). Those cross-sectional comparisons cannot establish whether loneliness leads to AI use, AI affects loneliness or other factors explain both.
Is AI the first person—or tool—young people turn to?
Ever discussing feelings with AI differs from choosing it first when needing support. The census uses a users-only base for one question and all youth for the other. Subtracting them would mix denominators and outcomes.
| ID | Finding and qualification | Population, period and sample | Source and locator |
|---|---|---|---|
| F37 | For feelings or personal problems, 56% chose a trusted adult first, 32% a friend and 5% an AI chatbot. All youth n=1,204; hypothetical first choice, not the same denominator or outcome as the 37% who had ever discussed feelings among AI users. | US youth aged 9–17; many findings restricted to any-AI users 2026-03-18 to 2026-03-26 All youth n=1,204 | Original research [S07] PDF physical p.27 / printed p.24, first-choice discussion |
| F38 | 25% of feelings-discussers felt AI understood them better than people, versus 3% of AI users who had not discussed feelings. Conditional any-AI user groups, not all youth. Association can reflect selection and does not show AI truly understands or improves wellbeing. | Any-AI users 9–17 grouped by feelings discussion 2026-03-18 to 2026-03-26 1,032 AI users overall; conditional item n not supplied | Original research [S07] PDF physical p.30 / printed p.27, understanding paragraph |
| F39 | 29% of AI users endorsed at least one of three dependency-related items; the share was 52% for daily users. Descriptive items include stopping for a month, homework reliance and perceived understanding. This is not a validated addiction diagnosis or 29% clinically dependent. | Any-AI users 9–17; daily users are a subset 2026-03-18 to 2026-03-26 1,032 AI users; daily-user n not supplied with figure | Original research [S07] PDF physical p.29 / printed p.26, Figure 17 and scoring definitions |
| F40 | 17% of chatbot users encountered material they felt inappropriate; 33% of those affected told a trusted adult last time. 17% base: chatbot users n=823. The 33% has a smaller conditional base, not all chatbot users. Self-reported appraisal, not independently adjudicated incidents. | US chatbot users 9–17; adult-disclosure percentage restricted to affected users 2026-03-18 to 2026-03-26 Chatbot users n=823; affected-user n not shown in figure | Original research [S07] PDF physical p.35 / printed p.32, Figure 21 |
| F41 | 56% said a parent or guardian discussed AI safety; 44% said that had not happened. All youth n=1,204, not only companion users. The question measures recalled discussion, not whether the discussion was effective. | US youth aged 9–17; many findings restricted to any-AI users 2026-03-18 to 2026-03-26 All youth n=1,204 | Original research [S07] PDF physical p.36 / printed p.33, parent-safety section |
The dependency-related indicator is a descriptive score based on three items, including homework-related reliance. It is not a clinical addiction diagnosis. The inappropriate-material result also uses chatbot users, rather than every child or every kind of AI user.
Our loneliness statistics resource covers loneliness prevalence and measurement. This page focuses on AI relationship experiences and the limits of comparisons involving them.
What do teens report, and how comfortable are parents?
Pew’s teen behavior and parent-comfort questions describe separate respondent populations. The research was published in February 2026 but conducted in September–October 2025.
| ID | Finding and qualification | Population, period and sample | Source and locator |
|---|---|---|---|
| F42 | 16% of all teens had casual chatbot conversations; 12% had used one for emotional support or advice. All teens 13–17, not only users. Fieldwork was in 2025 despite February 2026 publication; not a 2026 measurement. | US teens 13–17 living with parents 2025-09-25 to 2025-10-09 1,458 teens | Original research [S08] Original main report, personal-use paragraph; topline all-teens rebased items |
| F43 | 18% of parents were comfortable with teen emotional-support use, 58% were not and 20% unsure. All-parent rebased table also includes 4% who had not heard about chatbots. Comfort does not establish safety or actual teen use. | US parents of teens 13–17 2025-09-25 to 2025-10-09 1,458 parents | Original research [S08] Topline physical p.3, PTAIOK f, BASED ON ALL PARENTS |
Parent discomfort exceeded comfort by 40 percentage points (C13). That is an opinion difference, rather than a measured safety effect. Unsure parents and those unaware of chatbots remain in the all-parent denominator.
Why is Australia’s dedicated-companion figure different from broad US use?
eSafety classifies products as assistants or companions by their marketing. Broad US surveys can classify a general assistant by the purpose for which it is used. Product and purpose measures should not be ranked as if they were identical.
| ID | Finding and qualification | Population, period and sample | Source and locator |
|---|---|---|---|
| F44 | 78% had used an AI assistant; 8% had used a dedicated companion. All children 10–17 n=1,950. Types may overlap; companions classified by marketing. Not comparable to purpose-defined US companion rates. | Children aged 10–17 in Australia; usage outcomes often restricted to assistant/companion users 2026-02-02 to 2026-03-04 All children n=1,950 | Original research [S09] Research page key findings; report AI tools used section |
| F45 | 20% of assistant/companion users used the tools daily or more. Users-only denominator; not 20% of all children or dedicated-companion users only. | Australian users of AI assistants or companions 10–17 2026-02-02 to 2026-03-04 1,950 overall; users-only achieved count varies by item | Original research [S09] Research page key findings, use frequency |
| F46 | 54% of users had personal/social uses, including situations advice 33%, feelings/challenges 22% and hanging out 17%. Users of either assistants or companions. Categories overlap. Personal/social use is not identical to a romantic relationship. | Australian assistant/companion users 10–17 2026-02-02 to 2026-03-04 1,950 overall; eligible item n not supplied in cited summary | Original research [S09] Report physical p.9 / printed p.9, key findings; research-page uses bullet |
| F47 | 50% of assistant users specifically had used them for personal or social purposes. Assistant-user base, not all children. General-purpose assistants can support social use without being marketed as companions. | Australian AI assistant users 10–17 2026-02-02 to 2026-03-04 Assistant-user item n not supplied in cited summary | Original research [S09] Report physical p.10 / printed p.10, first key finding |
| F48 | 20% of users reported potentially inappropriate/harmful interactions; 32% shared personal or sensitive information. Separate questions, not a shared affected group. Private sharing excludes registration/age-assurance information; self-reported outcomes. | Australian assistant/companion users 10–17 2026-02-02 to 2026-03-04 Eligible user counts differ; overall n=1,950 | Original research [S09] Report physical p.10 / printed p.10, key findings |
| F49 | 85% of users reported a positive emotion prompted by a tool; 47% reported a negative one. Responses can overlap across different occasions. Positive feelings do not prove lasting benefit; negative feelings do not establish clinical harm. | Australian assistant/companion users 10–17 2026-02-02 to 2026-03-04 Eligible item base not supplied in cited summary | Original research [S09] Report physical p.10 / printed p.10, emotions key finding |
The assistant-versus-dedicated-companion difference within eSafety’s sample is 70 percentage points (C15). People may use both groups. The report describes a nonprobability online panel with quotas and weights; its experiences are self-reported. Positive and negative emotions can occur on different occasions, so the two rates are not a satisfaction score.
How do UK children describe advice and friendship with chatbots?
Internet Matters separates advice-seeking, friend-like conversations and wanting a friend. These are different measures. Its report-defined vulnerability categories also should not be treated as new clinical diagnoses.
| ID | Finding and qualification | Population, period and sample | Source and locator |
|---|---|---|---|
| F50 | 23% of chatbot users had sought advice from a chatbot. Chatbot-user base, not every UK child. Advice covers varied everyday topics; no efficacy inference. | UK chatbot users 9–17 Survey April–May 2025; broader project March–July 2025 632 users in reasons chart; exact achieved advice item n not separately stated | Original research [S10] PDF physical p.29 / printed p.29, children’s use for advice |
| F51 | 35% of users said chatbot conversation felt like talking to a friend; 12% said they had nobody else to speak with. Retain aggregate user-base claims from narrative. Chart 5’s contradictory printed subgroup bases are not used for new calculations. | UK chatbot users 9–17 Survey April–May 2025; broader project March–July 2025 Item-specific n not reliable in printed Chart 5; overall survey n=1,000 | Original research [S10] Executive summary physical p.4; companionship discussion physical p.35 |
| F52 | 16% of vulnerable users wanted a friend, compared with 4% of non-vulnerable users. Report-defined vulnerability grouping. This fourfold descriptive ratio is already discussed by the original researchers; no diagnosis or causal effect. | UK chatbot users 9–17 by report-defined vulnerability Survey April–May 2025; broader project March–July 2025 Chart 4: vulnerable n=133, non-vulnerable n=499 | Original research [S10] PDF physical p.35, Chart 4; physical p.36 narrative |
| F53 | 51% of users trusted chatbot advice as true; 40% had no concerns about following it. Distinct attitude questions. Confidence does not establish accuracy, safety or effective advice. | UK chatbot users 9–17 Survey April–May 2025; broader project March–July 2025 Exact achieved item counts not supplied beside narrative; overall survey n=1,000 | Original research [S10] PDF physical p.32 / printed p.32, advice confidence paragraph |
The fourfold wanted-friend ratio (16% divided by 4%; C16) is already discussed by the original researchers. It is included for convenient reproducibility, not claimed as a new discovery. Chart 5’s inconsistent printed bases are not used for new subgroup calculations. Trust in advice does not demonstrate that the advice is true.
What do partnered young adults report about romantic companions?
The 2026 Secret Soulmates report supports a qualified often-use finding and partner-awareness findings. It surveyed a quota sample of partnered US adults aged 18–30. Its undisclosed field dates remain unknown, and “often” is not a daily-use definition.
| ID | Finding and qualification | Population, period and sample | Source and locator |
|---|---|---|---|
| F56 | 15% reported often chatting with a romantic AI companion. A quota sample of partnered US adults 18–30. Often is the highest 1–4 response category; it is not defined as daily. Unknown field dates remain unknown. | US adults aged 18–30 in a committed dating, engaged or married relationship Exact field dates not stated in inspected Methods; published May 2026 2,431 partnered adults 18–30 | Original research [S12] PDF physical pp.14–15 / printed pp.7–8, measures and use results |
| F57 | Among frequent users, 30% said partners were unaware, 11% somewhat aware and 14% mostly aware. Respondents’ estimates of partner awareness, not partner reports. Frequent use can include romantic chat or roleplay. Full responding cell n is unpublished; no all-couples secrecy rate calculated. | Frequent romantic-chat/roleplay users within partnered sample Exact field dates not stated in inspected Methods; published May 2026 Filtered item n unavailable | Original research [S12] PDF physical p.20 / printed p.13, partner awareness; consistent with executive summary |
| F58 | 32% of regular users said keeping romantic-companion use secret was bad. An attitude among regular users, not the share of all partners approving secrecy or objectively classifying cheating. Not knowing an answer does not imply approval. | Regular romantic-companion users within partnered sample Exact field dates not stated in inspected Methods; published May 2026 Filtered item n unavailable | Original research [S12] PDF physical p.20 / printed p.13, secret-keeping attitudes paragraph |
Awareness is the respondent’s estimate of what their partner knows, rather than the partner’s own answer. Other attention-grabbing figures were excluded because the executive summary and main text conflict, or because their denominators differ. No percentage reduction in relationship stability is presented as a causal effect.
Does historical research prove one in five Americans has an AI partner?
The historical survey does not justify that claim as written. Its sample includes an extra young-adult recruitment group, and the report does not clearly document final weighting for the headline. “Ever chatted” is also different from having a current partner.
| ID | Finding and qualification | Population, period and sample | Source and locator |
|---|---|---|---|
| F60 | 19% of selected respondents had chatted with romantic AI; among romantic-AI chatters, 21% preferred AI communication to engaging with a real person. Different denominators: 19% uses the selected adult sample; 21% only romantic-AI chatters. The 2,969-person quota sample includes an extra young-adult oversample and unclear headline weighting. Do not project to all Americans, infer replaced relationships or create a trend. | US adults aged 18+, with an additional young-adult oversample; user-only attitudes conditional Field dates not given in inspected Methods; published February 2025 2,969 adults with extra young-adult sample; conditional chatter n not printed | Original research [S13] PDF physical pp.10–11 methods; p.13 / printed p.7 ever-use; p.18 / printed p.11 Figure 5 preference |
The result is retained transparently as historical selected-sample evidence. It should not be used to estimate the number of Americans in romantic AI relationships, or compared with the differently sampled 2026 study as a growth series.
Do AI companions help or harm wellbeing?
The answer depends on the outcome, population and study design. Public beliefs, perceived support, experimental short-term relief and long-term wellbeing are different kinds of evidence.
| ID | Finding and qualification | Population, period and sample | Source and locator |
|---|---|---|---|
| F54 | For loneliness support, 39% thought chatbots did more harm and 19% more good. Opinions of all adults, not observed treatment effects or a survey limited to companion users. | US adults 18+; public opinions about chatbot effects 2026-06-22 to 2026-06-28 3,488 US adults | Original research [S11] Original article, overall loneliness findings and downloadable chart data |
| F55 | For stress support, 29% thought chatbots did more harm and 22% more good. Different scenario from loneliness; no composite AI-risk score or clinically measured harm rate is inferred. | US adults 18+; public opinions about chatbot effects 2026-06-22 to 2026-06-28 3,488 US adults | Original research [S11] Original article, overall stress findings and chart data |
In Pew’s public-opinion survey, the loneliness hurt-minus-help difference was 20 percentage points (C17). It measures beliefs among adults, rather than clinical harms observed in companion users.
| Research context | What was accessed | Interpretation |
|---|---|---|
| MIT / OpenAI four-week experiment | Fang and colleagues, MIT Media Lab / OpenAI [S14]; version 2 author preprint | Assigned mode/topic conditions had no significant effects reported in version 2. Voluntary heavier use was associated with worse outcomes; the amount people chose to use was not randomized. All arms used a chatbot. |
| Character.AI and wellbeing | Zhang, Zhao, Hancock, Kraut and Yang [S15]; public final abstract and metadata | A survey and donated histories provide associations involving social networks, use motivation and wellbeing. The subscription full text was not obtained. Findings cannot establish what caused what. |
| AI companions and loneliness | De Freitas, Uguralp, Uguralp and Puntoni [S16]; accessible author-preprint abstract, with later journal version identified | Experiments and a one-week component report short-term relief. This does not establish durable benefit, clinical treatment effectiveness or universal safety. The journal full text was not obtained. |
Self-reported support or reduced loneliness in a particular study should not be turned into a promise about an app or a substitute for professional care. The article reports research rather than recommending products. For human social ties, see our friendship statistics.
What comparisons does MyLittleDesire contribute?
The contribution is a convenient, checkable synthesis. These 17 calculations expose denominators, differences and question boundaries. Some are already apparent in, or discussed by, the original research. They are descriptive arithmetic, not new scientific discoveries, significance tests or original fieldwork.
| ID | Comparison | Result | Qualification and source |
|---|---|---|---|
| C01 | Private secret disclosure minus romantic/sexual companionship | 8.0 percentage points | June 2026 US citizen survey, separate experiences. Romantic item n=1,125, secret item n=1,126. Difference is not the share disclosing without romantic use. YouGov [S03] |
| C02 | Ongoing friendship minus romantic/sexual companionship | 5.0 percentage points | June survey, separately reported experiences with near-identical bases. No individual overlap or relationship depth inferred. YouGov [S03] |
| C03 | Secret-disclosure to romantic/sexual-use prevalence ratio | Approximately 2.60× | Marginal rates from separate questions; not a within-person transition or likelihood of becoming romantically involved. YouGov [S03] |
| C04 | Direct friendship answer minus friend/confidant option | 14.0 percentage points | Elon’s same target user group, different questions/options. This is not a time trend or proof wording caused the difference. Elon University Imagining the Digital Future Center / Elon University Poll [S01] |
| C05 | Personal-advice use minus romantic chat in broad user group | 29.0 percentage points | Same broad companion-user base and multi-select purposes. No claim about mutually exclusive groups. Elon University Imagining the Digital Future Center / Elon University Poll [S01] |
| C06 | Regular use as approximate share of ever-users | Approximately 72.2% | 52% and 72% use the same all-teens denominator. Ratio of rounded weighted rates; not raw sample counts, exact retention or daily use. Common Sense Media / NORC at the University of Chicago [S06] |
| C07 | Approximate all-teens share choosing AI for serious matters | Approximately 23.8% | 72% all teens ever used × 33% of users. Rounded weighted inputs from the same study; derived approximation, not a directly reported exact percentage. Common Sense Media / NORC at the University of Chicago [S06] |
| C08 | Approximate all-teens share reporting discomfort | Approximately 24.5% | 72% all teens ever used × 34% of users. Derived approximation from rounded inputs, without individual data or propagated uncertainty. Common Sense Media / NORC at the University of Chicago [S06] |
| C09 | Approximate all-teens share sharing private information | Approximately 17.3% | 72% all teens ever used × published 24% user NET. Preserve the NET rather than summing rounded frequency categories. Common Sense Media / NORC at the University of Chicago [S06] |
| C10 | Social-practice gap by reported loneliness | 10.0 percentage points | Any-AI users 9–17 in March 2026, different loneliness groups. Association, not an effect of AI or loneliness. Common Sense Media / Echelon Insights / SSRS [S07] |
| C11 | Feelings-discussion gap by reported loneliness | 14.0 percentage points | Same survey and grouping; conditional cell counts not shown. No causal or significance claim added. Common Sense Media / Echelon Insights / SSRS [S07] |
| C12 | Feelings-discussion gap by friendship difficulty | 17.0 percentage points | Very/pretty hard versus not at all hard to make friends. Different self-selected groups, not a tested intervention. Common Sense Media / Echelon Insights / SSRS [S07] |
| C13 | Parent discomfort minus comfort for emotional support | 40.0 percentage points | Pew all-parent rebased table. Opinion difference, not measured chatbot safety; unsure/unaware respondents remain in the denominator. Pew Research Center / Ipsos KnowledgePanel [S08] |
| C14 | Potential dating assistance minus human-date refusal | 24.0 percentage points | Two different Match questions. A marginal difference cannot identify the share who both welcome help and refuse a companion-app user. Match Group Research Team [S04] |
| C15 | Australian assistant-use minus dedicated-companion use | 70.0 percentage points | Both use all children 10–17. Product groups can overlap; no international ranking or causal effect. Australian eSafety Commissioner [S09] |
| C16 | UK wanted-friend ratio by vulnerability grouping | Approximately 4.00× | 16%/4% among chatbot users in Chart 4. Already discussed by the source; not new science or an individual risk estimate. Internet Matters [S10] |
| C17 | Public opinion hurt-minus-help gap for loneliness | 20.0 percentage points | Opinion categories among all US adults, not a clinical harm-versus-benefit effect size. Pew Research Center [S11] |
What cannot be concluded from these statistics?
- No result here measures actual 2027 behavior, a pooled global adoption rate or a comparable four-country ranking.
- Ever use, ongoing friendship, possible romance and dedicated-app use are not interchangeable. General AI use is not automatically a digital relationship.
- All adults, adult citizens, internet users, singles, partnered young adults, all children and AI users have different denominators.
- Marginal differences do not reveal respondent overlap. Survey categories and reasons can be nonexclusive.
- Rounded conditional percentages support qualified approximations, not exact headcounts or newly calculated uncertainty estimates.
- Cross-sectional associations do not establish causation. Public concern and perceived support are not clinical outcomes.
- Downloads, accounts, website visits and market forecasts do not measure unique people in romantic relationships.
- Separate programs can share publishers or survey providers. Program count does not imply complete organizational independence.
How were these findings selected and verified?
Original reports, public cross-tabs, research articles and original publisher summaries available by October 24, 2026 were reviewed. The database records each finding’s population, actual period, units, method, sample availability, locator and caveats. Verification checks what a source reports; it does not independently audit fieldwork or respondents.
Related answer categories are grouped into 60 findings, with 136 numeric inputs retained for reproducibility. Fourteen survey programs supply the findings, documented alongside three contextual research papers. The YouGov surveys are separate waves; Elon’s fieldwork also used YouGov. Common Sense’s two surveys and Pew’s different programs share publishers. Multiple reports are not automatically independent replications.
Original YouGov cross-tabs and Pew toplines were read directly. Public web retrieval supplied original reports when a separate direct download was unavailable. Narrative’s inaccessible tables limit the Canadian findings to bounds. The final Nature abstract and the De Freitas author abstract support contextual discussion only. Conflicting Secret Soulmates figures and inconsistent UK subgroup bases are excluded from calculations. Missing field dates, weights and conditional counts remain labelled.
Calculations use named source inputs and readable numeric precision. The four charts are MyLittleDesire designs using third-party data. Editing workbook inputs recalculates comparison and chart-data cells; it does not automatically redraw the static PNGs, SVGs or HTML. Review and rebuild them together after any source update.
Complete original sources
- S01 · Elon University Imagining the Digital Future Center / Elon University Poll. The Rise of AI Companions — topline and methodology. Published: Public release 2026-09-02; PDF uses May survey dates. Actual period: 2026-05-18 to 2026-05-22. Sample: 4,268 screened; 4,031 matched adult internet users; 1,000 target companion users. Method: YouGov opt-in online panel matched/weighted to demographic targets; target subgroup defined through broad social/emotional purposes. Limitations: Broad companion definition includes general-purpose systems and entertainment. Most percentages use the 1,000-user subgroup, not every adult. Some footer dates say May 18–23; cover/method dates May 18–22 retained. No national romantic-relationship rate is inferred.
- S02 · YouGov. AI Usage survey, April 1–5, 2026. Published: Companion analysis 2026-05-12. Actual period: 2026-04-01 to 2026-04-05. Sample: 1,082 overall; emotional-bond item n=1,077; romantic-relationship item n=1,075. Method: Opt-in panel, weighted by demographics and political variables; original cross-tabs show item n. Limitations: Actual use, hypothetical possibility and already-existing relationships are distinct. Published possible-romance NET is 6% in companion analysis, while rounded components are 2% and 3%. Do not manufacture an exact NET from rounded categories.
- S03 · YouGov. Artificial Intelligence survey, June 26–29, 2026. Published: Companion article 2026-07-01. Actual period: 2026-06-26 to 2026-06-29. Sample: 1,126 overall; romantic/sexual and hidden-use items n=1,125; friendship and secret items n=1,126. Method: Weighted opt-in online panel; original cross-tabs report unweighted cell counts. Limitations: Ever romantic OR sexual companionship is broader than a sustained romantic relationship. Separate experiences can overlap. Age subgroups are smaller than overall n; all-age averages include younger adults.
- S04 · Match Group Research Team. AI Is Everywhere. Romance is Still Off-Limits.. Published: 2026-06-18. Actual period: 2026-04-13 to 2026-05-08. Sample: Approximately 1,000 overall; achieved item/subgroup counts not published. Method: Original sponsor survey; public article gives sample range and dates, not full recruitment, weighting or questionnaire. Limitations: Commercial dating-company research. Possible assistance is not actual adoption. Refusing a human date who uses a companion app is different from refusing to date an AI. No respondent-level overlap is published.
- S05 · Narrative Research / The Logit Group. Canadians are widely using AI-based tools and services, but emotional trust remains limited. Published: 2026-04-16. Actual period: 2026-03-12 to 2026-03-16. Sample: 1,230 overall; AI-user item n unavailable in readable summary. Method: Online Canadian Omnibus; census weighting by gender, age and region. Limitations: Readable original summary uses rounded language. Its image and linked tables could not be retrieved. Preserve bounds rather than inventing exact percentages; exclude outcomes whose eligible population is unclear.
- S06 · Common Sense Media / NORC at the University of Chicago. Talk, Trust, and Trade-Offs: How and Why Teens Use AI Companions. Published: 2025-07-16. Actual period: 2025-04-30 to 2025-05-14. Sample: 1,060 overall; companion-user items n=758. Method: 719 AmeriSpeak probability-panel and 341 Prodege nonprobability interviews; NORC TrueNorth calibration; overall published MOE ±4.2 points. Limitations: Self-report, cross-sectional. Companion definition includes general-purpose AI used relationally. Authors warn respondents may conflate general AI with companion use. All-teens and users-only bases differ. Rounded weights, not raw 758/1,060, drive percentages.
- S07 · Common Sense Media / Echelon Insights / SSRS. The Common Sense Media Census: AI Use by Tweens and Teens, 2026. Published: 2026-06-08. Actual period: 2026-03-18 to 2026-03-26. Sample: 1,204 overall; any-AI users n=1,032; chatbot-experience items n=823; detailed conditional cell counts not all shown. Method: SSRS Opinion Panel youth recruited via parents; probability-based adult panel, English/Spanish web interviews; weights to target youth population. Limitations: Any AI, AI chatbots and AI companions are different bases. Loneliness/friendship associations are cross-sectional. Descriptive dependency-item score is not a clinical diagnosis. No direct trend is inferred from S06’s different ages and definition.
- S08 · Pew Research Center / Ipsos KnowledgePanel. How Teens Use and View AI — topline. Published: 2026-02-24. Actual period: 2025-09-25 to 2025-10-09. Sample: 1,458 teen-parent pairs; conditional users and awareness bases differ. Method: Online probability-panel recruitment via parents; separate weighting for teen and parent populations; overall MOE ±3.3 points. Limitations: Use is self-reported. Parent comfort is an opinion, not a safety evaluation. Parents unaware of chatbots are included in all-parent rebased results. Do not assign teen percentages to parents or users-only figures to all teens.
- S09 · Australian eSafety Commissioner. Talking to machines: Children’s experiences with AI assistants and companions. Published: Report labelled August 2026; exact public release day not confirmed. Actual period: 2026-02-02 to 2026-03-04. Sample: 1,950 overall; eligible item bases differ. Method: Octopus Group nonprobability online panel via parents; demographic quotas and weights; parent consent and child assent. Limitations: Report explicitly calls panel sampling nonprobability/convenience. Researchers classify products by marketing, rather than the broad purpose-based definitions in US surveys. Use and experiences are self-reported, not independently observed harm or benefit.
- S10 · Internet Matters. Me, myself and AI: Understanding and safeguarding children’s use of AI chatbots. Published: July 2025; exact report day not printed. Actual period: Survey April–May 2025; broader project March–July 2025. Sample: 1,000 children overall; reasons chart user bases vulnerable n=133 and non-vulnerable n=499. Method: Biannual quota/representative survey plus qualitative groups and separate user tests; qualitative results are not used as prevalence. Limitations: Vulnerability uses the report’s grouping, not a new diagnosis. Chart 5 prints inconsistent bases; its subgroup percentages are excluded here. Full survey field dates/weight detail not supplied in report.
- S11 · Pew Research Center. Do Americans think chatbots help or hurt people using them for loneliness, depression or stress?. Published: 2026-08-25. Actual period: 2026-06-22 to 2026-06-28. Sample: 3,488 overall. Method: American Trends Panel survey, weighted to US adult population. Limitations: Opinions on help/hurt are not clinical outcomes or a measure of actual effectiveness. The lonely, stressed or depressed people being discussed are not necessarily respondents with those conditions.
- S12 · Wheatley Institute / Institute for Family Studies. Secret Soulmates: How AI Romantic Companions Are Starting to Impact Real-Life Romantic Relationships in Young Adulthood. Published: Publisher page 2026-05-18; author release 2026-05-19. Actual period: Exact field dates not stated in inspected Methods; published May 2026. Sample: 2,431 overall; regular-user item n not provided. Method: Qualtrics online quota-panel survey; often is highest category of 1–4 never-to-often frequency scale. Limitations: Nonprobability sample, no causal inference. Several summary/main-text percentages and the 69% secrecy base conflict; those are excluded. Target quotas and achieved composition also differ. Publication year is not an established fieldwork year.
- S13 · Wheatley Institute. Counterfeit Connections: The Rise of Romantic AI Companions and AI Sexualized Media Among the Rising Generation. Published: February 2025 report; exact publication day not established in inspected PDF. Actual period: Field dates not given in inspected Methods; published February 2025. Sample: 2,969 overall; romantic-chat-user count not printed with selected finding. Method: Qualtrics quota-panel survey; initial target 2,000 adults plus 1,000 age 18–29 oversample; final weighting for headline not clearly documented. Limitations: The 19% is retained as a selected-sample result, not projected to all Americans. Self-report and cross-sectional design. Historical result cannot establish growth against other samples or question wordings.
- S14 · Fang and colleagues, MIT Media Lab / OpenAI. How AI and Human Behaviors Shape Psychosocial Effects of Extended Chatbot Use. Published: Submitted 2025-03-21; version 2 revised 2025-10-02. Actual period: Four-week experimental exposure; actual field dates not taken from abstract. Sample: 981 overall in version 2. Method: Randomized modes and conversation topics; additional observational analyses of voluntary use. Limitations: Preprint version 2. No significant assigned-condition effects reported. Voluntary heavier-use associations are not randomized exposure effects. All experimental arms used a chatbot; not a general chatbot-versus-no-chatbot trial.
- S15 · Zhang, Zhao, Hancock, Kraut and Yang. Interaction with AI companions and psychological well-being. Published: 2026-08-04. Actual period: Cross-sectional survey and donated histories; field dates not available in accessible abstract. Sample: 1,131 survey respondents; 237 history donors; final abstract reports 4,664 sessions and 464,687 messages. Method: Self-reports linked to donated chat histories; associational analysis. Limitations: Only public final abstract and metadata accessed; subscription full text not obtained. Final counts differ from the 2025 preprint; final abstract used for contextual discussion. Associations are not causal effects.
- S16 · De Freitas, Uguralp, Uguralp and Puntoni. AI Companions Reduce Loneliness — author preprint. Published: 2024-07-09 author preprint; later journal version identified separately. Actual period: Multiple studies including a one-week longitudinal component; field dates not verified from abstract. Sample: Study-specific n not verified in accessible abstract used here. Method: Review/conversation analysis and experiments; author abstract includes short-term and one-week findings. Limitations: Use limited to context from accessible author abstract. Later JCR version identified, but its full text was not obtained. Short-term relief does not establish durable benefit, medical treatment or universal safety.
- S17 · Pew Research Center / SSRS. Americans and AI 2026: Chatbots, Smart Devices and Views on Impact. Published: 2026-06-17. Actual period: 2026-02-17 to 2026-02-23. Sample: 5,119 overall. Method: American Trends Panel probability sample; SSRS English/Spanish online and telephone interviewing; weighting for selection and nonresponse; overall MOE ±1.6 points. Limitations: All-adult rates rebased across chatbot use. Emotional support or advice and companionship are separate nonexclusive purposes, not current romantic partnership. Different wording from other surveys prevents a comparable time trend.
How to cite this resource
For this synthesis or a MyLittleDesire chart/calculation, cite this resource and the underlying original study. For an individual survey result, consult and cite the original research directly.
Suggested citation after publication: MyLittleDesire. AI Companions & Digital Relationships Statistics 2027: Use, Trust and Human Connection. 2027 editorial edition. https://mylittledesire.com/ai-companion-statistics/. Add your actual access date where required.