A proposal can be carefully planned and still surprise the person receiving it. Couples can discuss marriage, choose a ring together and have different views about the moment itself. This resource separates those experiences from what adults say an ideal engagement should look like.
60 grouped findings across nine original-source records, containing 137 numeric inputs, 20 transparent descriptive calculations and four MyLittleDesire charts. The research covers the US, UK, Great Britain and Australia, alongside a clearly separated historical study of selected online proposal narratives. No Canada-specific population benchmark was independently verified.
What are the key engagement proposal statistics?
85% /81%
51%
Proposals were planned versus described as surprises. The measures can overlap. Original source [S01].
Discussed proposal preferences beforehand. Original source [S01].
79%
US$4,600
Of ring recipients had some input in selection. Original source [S01].
Reported average engagement-ring spending in The Knot’s study. Original source [S01].
48% vs. 28%
41%
Named friends/family versus social media as ring-style influences. Original source [S02].
Of proposers held the ring for over a month before asking. Original source [S02].
53% vs. 42%
24% vs. 7%
Supported equal celebration at ages 55+ versus 25–34. Original source [S03].
Supported a gift for the proposer at ages 25–34 versus 55+. Original source [S03].
74%
A$6,842
Preferred starting marriage debt-free to heavy ring spending. Original source [S04].
Reported average engagement-ring cost in Easy Weddings’ report. Original source [S06].
69%
67%
Thought a ring should cost less than three months’ salary. Original source [S07].
Preferred a private marriage proposal. The base includes people wanting no proposal. Original source [S08].
Which proposal statistics mean different things?
Start with the question and eligible population. Surprise does not mean there was no discussion of marriage. A private proposal can happen outdoors. A person’s willingness to consider a ring is different from buying it.
| Measure | What it describes | Boundary when quoting |
|---|---|---|
| Planned proposal | Preparation by the proposer. | Can also be a surprise to the recipient. |
| Prior proposal discussion | Conversation about preferences, setting or participants. | Different from discussing marriage in principle. |
| Private setting | Privacy or absence of an audience, as defined by the source. | Not synonymous with indoors, unplanned or unrecorded. |
| Recipient selection input | Any involvement in ring selection. | Broader than making the final purchase decision jointly. |
| Ring in hand | A ring present at the proposal. | Different from exchanging engagement rings at any later point. |
| Reported average spend | A mean/cost benchmark from a defined sample. | Not the median, a personal recommendation or price of an equivalent product. |
| Carat weight | The publisher’s stated stone-weight measure. | Do not silently change total weight to center-stone weight. |
| Preference or hypothetical choice | What surveyed adults say they want or would consider. | Not observed proposal conduct, actual purchases or acceptance rates. |
| Newlywed cohort | People who went on to marry in a defined year. | Excludes many rejected proposals and relationships that never marry. |
| Selected online narratives | Stories chosen for analysis, sometimes partly by outcome. | Cannot establish population rejection prevalence or causal acceptance rules. |
| Overall report n | Size of a core study or combined report. | Not every item, subgroup or additional study’s valid base. |
| Percentage-point contrast | Subtraction of two percentages. | Not a percent change, an individual overlap or a new significance test. |
ALSO READ:-
Couples Money Management Statistics 2027
Cyberbullying And Online Social Relationships Statistics 2027
Teen Friendship And Peer Support Statistics 2027
Couples Therapy and Counseling Statistics 2027
How do couples plan proposals and choose rings?
The Knot’s 2026 report describes a US newlywed cohort whose weddings took place in 2025, alongside additional studies. Proposals and ring purchases can precede the wedding year. Its findings distinguish advance conversations, surprise, location, professional help and ring selection.
| ID | Finding and qualification | Population, actual period and base | Original source and locator |
|---|---|---|---|
| F01 | The reported average dating period before engagement was 3 years. Definition: Retrospective dating duration before engagement. Qualification: Brand-member newlywed cohort; not the ideal waiting time or every US relationship. | The Knot/WeddingWire adult members married during 2025; some report findings also draw on ad hoc engaged/newlywed studies United States 2025 newlywed cohort; retrospective proposals/dating can predate 2025; additional studies fielded during 2025 Overall report n=10,474. Item/subgroup bases are not provided alongside these estimates. Overall report size is not the valid base for every item. | The Knot / The Knot Worldwide Published 2026-02-18 PDF physical p.6 (printed 04), Dating by the Numbers. |
| F02 | The average engagement lasted 14 months; roughly 40% lasted 11–18 months. Definition: Time between engagement and marriage among reported wedding cohorts. Qualification: Not all engagements, including those never ending in marriage. Rounded approximately 40% retained. | The Knot/WeddingWire adult members married during 2025; some report findings also draw on ad hoc engaged/newlywed studies United States 2025 newlywed cohort; retrospective proposals/dating can predate 2025; additional studies fielded during 2025 Overall report n=10,474. Item/subgroup bases are not provided alongside these estimates. Overall report size is not the valid base for every item. | The Knot / The Knot Worldwide Published 2026-02-18 PDF physical p.7 (printed 05), Selecting a Wedding Date. |
| F03 | 70% lived together before engagement. Definition: Cohabitation preceding engagement. Qualification: Not the share cohabiting before the wedding or the prevalence of cohabitation among all adults. | The Knot/WeddingWire adult members married during 2025; some report findings also draw on ad hoc engaged/newlywed studies United States 2025 newlywed cohort; retrospective proposals/dating can predate 2025; additional studies fielded during 2025 Overall report n=10,474. Item/subgroup bases are not provided alongside these estimates. Overall report size is not the valid base for every item. | The Knot / The Knot Worldwide Published 2026-02-18 PDF physical p.6 (printed 04), Dating by the Numbers. |
| F04 | 57% discussed marriage or engagement more than a year before the proposal. Definition: Discussion lead time, not proposal planning duration. Qualification: Separate from discussion of proposal settings and guest lists; no respondent overlap is published. | The Knot/WeddingWire adult members married during 2025; some report findings also draw on ad hoc engaged/newlywed studies United States 2025 newlywed cohort; retrospective proposals/dating can predate 2025; additional studies fielded during 2025 Overall report n=10,474. Item/subgroup bases are not provided alongside these estimates. Overall report size is not the valid base for every item. | The Knot / The Knot Worldwide Published 2026-02-18 PDF physical p.6 (printed 04), Dating by the Numbers. |
| F05 | About 70% took wedding-related actions before engagement;64% discussed wedding size and 60% the season. Definition: Pre-engagement wedding actions and stated discussion topics. Qualification: Actions and topic responses overlap and are separate questions. Do not infer that all participants had booked a wedding. | The Knot/WeddingWire adult members married during 2025; some report findings also draw on ad hoc engaged/newlywed studies United States 2025 newlywed cohort; retrospective proposals/dating can predate 2025; additional studies fielded during 2025 Overall report n=10,474. Item/subgroup bases are not provided alongside these estimates. Overall report size is not the valid base for every item. | The Knot / The Knot Worldwide Published 2026-02-18 PDF physical p.6 (printed 04), pre-engagement overview and second bullet. |
| F06 | About 90% discussed finances before engagement;85% discussed children and 85% mental health. Definition: Reported topics discussed before engagement. Qualification: Discussion does not establish agreement, relationship readiness or clinical health. Rounded 9-in-10 retained. | The Knot/WeddingWire adult members married during 2025; some report findings also draw on ad hoc engaged/newlywed studies United States 2025 newlywed cohort; retrospective proposals/dating can predate 2025; additional studies fielded during 2025 Overall report n=10,474. Item/subgroup bases are not provided alongside these estimates. Overall report size is not the valid base for every item. | The Knot / The Knot Worldwide Published 2026-02-18 PDF physical p.6 (printed 04), Pre-engagement first bullet. |
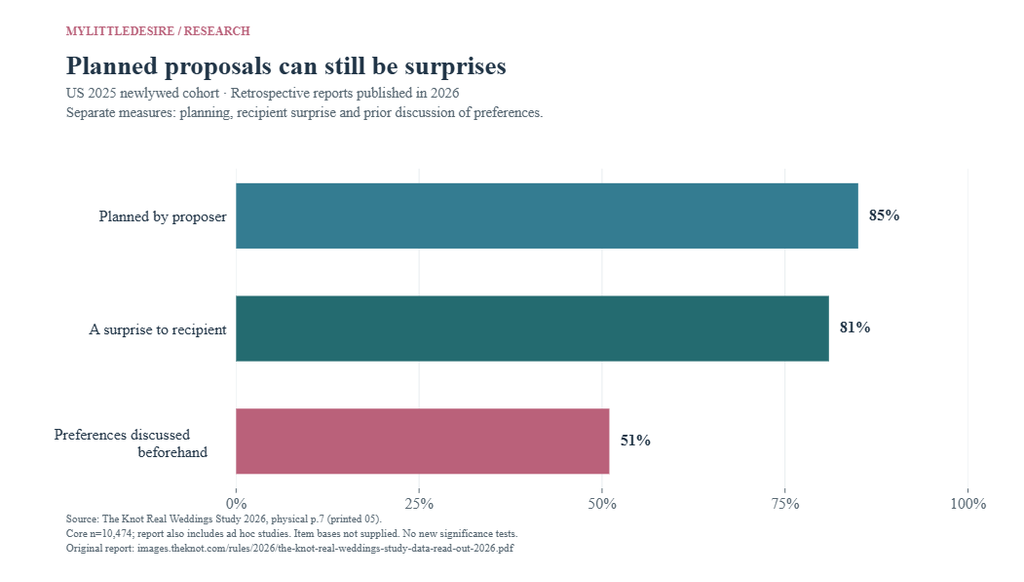
| F07 | 85% of proposals were planned, while 81% were described as surprises. Definition: Planned by the proposer and surprising to the recipient are distinct dimensions. Qualification: Separate marginal results; do not infer the percentage of individuals with both characteristics. | The Knot/WeddingWire adult members married during 2025; some report findings also draw on ad hoc engaged/newlywed studies United States 2025 newlywed cohort; retrospective proposals/dating can predate 2025; additional studies fielded during 2025 Overall report n=10,474. Item/subgroup bases are not provided alongside these estimates. Overall report size is not the valid base for every item. | The Knot / The Knot Worldwide Published 2026-02-18 PDF physical p.7 (printed 05), opening paragraph and Proposals at a Glance. |
| F08 | 51% discussed proposal preferences with their partner beforehand. Definition: Preferences such as setting or guest list, rather than every detail of the plan. Qualification: A conversation can coexist with a surprise; no individual cross-tab is supplied. | The Knot/WeddingWire adult members married during 2025; some report findings also draw on ad hoc engaged/newlywed studies United States 2025 newlywed cohort; retrospective proposals/dating can predate 2025; additional studies fielded during 2025 Overall report n=10,474. Item/subgroup bases are not provided alongside these estimates. Overall report size is not the valid base for every item. | The Knot / The Knot Worldwide Published 2026-02-18 PDF physical p.7 (printed 05), Proposals at a Glance. |
| F09 | 72% of proposals took place outdoors;53% used a private setting. Definition: Outdoor location and private setting are different categories. Qualification: An outdoor proposal can be private. These percentages are not complementary; do not calculate a public rate as 100−72. | The Knot/WeddingWire adult members married during 2025; some report findings also draw on ad hoc engaged/newlywed studies United States 2025 newlywed cohort; retrospective proposals/dating can predate 2025; additional studies fielded during 2025 Overall report n=10,474. Item/subgroup bases are not provided alongside these estimates. Overall report size is not the valid base for every item. | The Knot / The Knot Worldwide Published 2026-02-18 PDF physical p.7 (printed 05), Proposals at a Glance and final proposal bullet. |
| F10 | 26% hired a vendor to help with the proposal. Definition: Professional help such as photography, flowers or planning. Qualification: Not the share using any unpaid help, or the share using a professional wedding planner. | The Knot/WeddingWire adult members married during 2025; some report findings also draw on ad hoc engaged/newlywed studies United States 2025 newlywed cohort; retrospective proposals/dating can predate 2025; additional studies fielded during 2025 Overall report n=10,474. Item/subgroup bases are not provided alongside these estimates. Overall report size is not the valid base for every item. | The Knot / The Knot Worldwide Published 2026-02-18 PDF physical p.7 (printed 05), Proposals at a Glance. |
| F11 | 28% had an engagement party. Definition: Post-engagement celebration. Qualification: Not the share with guests present during the proposal or the prevalence among all newly engaged adults. | The Knot/WeddingWire adult members married during 2025; some report findings also draw on ad hoc engaged/newlywed studies United States 2025 newlywed cohort; retrospective proposals/dating can predate 2025; additional studies fielded during 2025 Overall report n=10,474. Item/subgroup bases are not provided alongside these estimates. Overall report size is not the valid base for every item. | The Knot / The Knot Worldwide Published 2026-02-18 PDF physical p.7 (printed 05), Proposals at a Glance. |
| F12 | 57% began ring research more than six months before proposing. Definition: Start of ring research relative to the proposal. Qualification: Research start is not purchase date or the length of active shopping. | The Knot/WeddingWire adult members married during 2025; some report findings also draw on ad hoc engaged/newlywed studies United States 2025 newlywed cohort; retrospective proposals/dating can predate 2025; additional studies fielded during 2025 Overall report n=10,474. Item/subgroup bases are not provided alongside these estimates. Overall report size is not the valid base for every item. | The Knot / The Knot Worldwide Published 2026-02-18 PDF physical p.8 (printed 06), Ring Shopping first bullet. |
| F13 | 77% spent four months or less selecting/purchasing;63% bought the ring within two months of proposing. Definition: Process duration and purchase-to-proposal lead time. Qualification: Different timing measures. Do not subtract them to identify a subgroup or a single shopping timeline. | The Knot/WeddingWire adult members married during 2025; some report findings also draw on ad hoc engaged/newlywed studies United States 2025 newlywed cohort; retrospective proposals/dating can predate 2025; additional studies fielded during 2025 Overall report n=10,474. Item/subgroup bases are not provided alongside these estimates. Overall report size is not the valid base for every item. | The Knot / The Knot Worldwide Published 2026-02-18 PDF physical p.8 (printed 06), Ring Shopping second bullet. |
| F14 | 79% of recipients had ring-selection input;21% had none. About 25% of couples shopped together at a retailer. Definition: Any selection input versus a specific joint retail visit. Qualification: Input is not identical to making the final decision jointly; the 25% is not conditional on the 79%. | The Knot/WeddingWire adult members married during 2025; some report findings also draw on ad hoc engaged/newlywed studies United States 2025 newlywed cohort; retrospective proposals/dating can predate 2025; additional studies fielded during 2025 Overall report n=10,474. Item/subgroup bases are not provided alongside these estimates. Overall report size is not the valid base for every item. | The Knot / The Knot Worldwide Published 2026-02-18 PDF physical p.8 (printed 06), Ring Shopping third bullet. |
| F15 | 96% exchanged rings as an engagement symbol; nearly 90% of proposers had a ring when asking. Definition: Ring exchange and ring-in-hand timing. Qualification: Nearly 9-in-10 is approximate. Ring exchange can happen later; do not label it 96% of proposals with a ring in hand. | The Knot/WeddingWire adult members married during 2025; some report findings also draw on ad hoc engaged/newlywed studies United States 2025 newlywed cohort; retrospective proposals/dating can predate 2025; additional studies fielded during 2025 Overall report n=10,474. Item/subgroup bases are not provided alongside these estimates. Overall report size is not the valid base for every item. | The Knot / The Knot Worldwide Published 2026-02-18 PDF physical p.8 (printed 06), opening paragraph. |
| F16 | The reported average ring spend was US$4,600; listed natural-stone and lab-grown costs wereUS$7,000 and US$4,300. Definition: Publisher’s spending/cost figures for the selected ring samples. Qualification: Not prices for equivalent products, a median, a recommended budget or a national retail-sales census. Subtype valid bases are not supplied. | The Knot/WeddingWire adult members married during 2025; some report findings also draw on ad hoc engaged/newlywed studies United States 2025 newlywed cohort; retrospective proposals/dating can predate 2025; additional studies fielded during 2025 Overall report n=10,474. Item/subgroup bases are not provided alongside these estimates. Overall report size is not the valid base for every item. | The Knot / The Knot Worldwide Published 2026-02-18 PDF physical p.8 (printed 06), Jewelry at a Glance and Natural Stone/Lab-Grown comparison. |
| F17 | Reported average carat weight was 1.9 overall; the comparison listed 1.6 for natural stone and 2.0 for lab-grown. Definition: Carat weight as labeled in the original readout. Qualification: The panel does not fully define center versus total stone weight. Preserve its label; do not combine with differently defined carat measures. | The Knot/WeddingWire adult members married during 2025; some report findings also draw on ad hoc engaged/newlywed studies United States 2025 newlywed cohort; retrospective proposals/dating can predate 2025; additional studies fielded during 2025 Overall report n=10,474. Item/subgroup bases are not provided alongside these estimates. Overall report size is not the valid base for every item. | The Knot / The Knot Worldwide Published 2026-02-18 PDF physical p.8 (printed 06), Jewelry at a Glance and comparison panel. |
| F18 | 61% of engagement-ring purchases featured lab-grown center stones;40% said a lab-grown stone was specifically important. Definition: Purchase composition and expressed importance are distinct measures. Qualification: Do not infer who chose a lab-grown stone without valuing it, or call the stated preference a causal driver. | The Knot/WeddingWire adult members married during 2025; some report findings also draw on ad hoc engaged/newlywed studies United States 2025 newlywed cohort; retrospective proposals/dating can predate 2025; additional studies fielded during 2025 Overall report n=10,474. Item/subgroup bases are not provided alongside these estimates. Overall report size is not the valid base for every item. | The Knot / The Knot Worldwide Published 2026-02-18 PDF physical p.8 (printed 06), All the Shiny Details first bullet. |
For the later financial milestone, see wedding cost and budget statistics. Ring spending and proposal preparation are distinct from the full wedding budget.
Who influences ring choices, and how are rings prepared?
Jewelers Mutual surveyed a selected group of US adults in May 2026. Eligibility required household insurance responsibility as well as a recent engagement-ring purchase or receipt. These results describe that group, rather than every newly engaged person.
| ID | Finding and qualification | Population, actual period and base | Original source and locator |
|---|---|---|---|
| F19 | 52% cited design or uniqueness as a leading ring-selection factor. Definition: Reported selection factor, as labeled by the publisher. Qualification: Not an experimental comparison of actual purchasing priorities; full question options and item base unavailable. | Adults 18+ responsible for household insurance decisions, who bought/received an engagement ring within five years and were engaged or married within five years United States May 2026 survey; rings purchased/received and engagement/marriage within preceding five years Overall report n=2,000. Item/subgroup bases are not provided alongside these estimates. Overall report size is not the valid base for every item. | Jewelers Mutual Published 2026-10; associated newsroom release 2026-10-08 Original newsroom, Design still wins over price. |
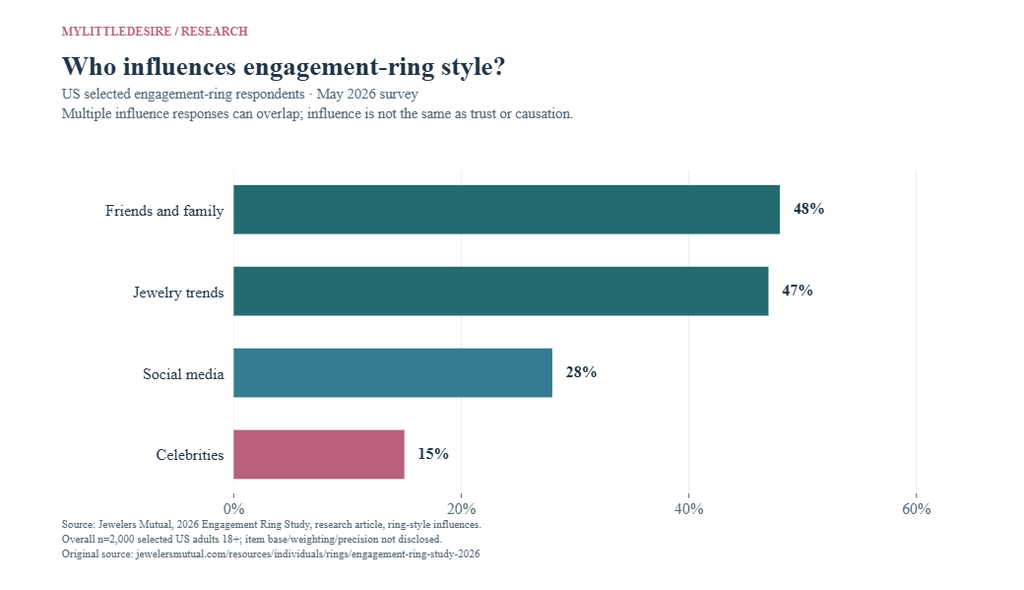
| F20 | Ring-style influences included friends/family 48%, jewelry trends 47%, social media 28% and celebrities 15%. Definition: Published influence responses. Qualification: Categories can overlap. Influence is not the same as trust, verified advice or proof of a media effect. | Adults 18+ responsible for household insurance decisions, who bought/received an engagement ring within five years and were engaged or married within five years United States May 2026 survey; rings purchased/received and engagement/marriage within preceding five years Overall report n=2,000. Item/subgroup bases are not provided alongside these estimates. Overall report size is not the valid base for every item. | Jewelers Mutual Published 2026-10; associated newsroom release 2026-10-08 Original research article, How do I research engagement ring styles? |
| F21 | 43% bought from a jewelry brand store,28% from a retail store and 10% from a local business. Definition: Three published purchase-channel categories. Qualification: The selected categories are not the complete response distribution; do not force their total to 100%. | Adults 18+ responsible for household insurance decisions, who bought/received an engagement ring within five years and were engaged or married within five years United States May 2026 survey; rings purchased/received and engagement/marriage within preceding five years Overall report n=2,000. Item/subgroup bases are not provided alongside these estimates. Overall report size is not the valid base for every item. | Jewelers Mutual Published 2026-10; associated newsroom release 2026-10-08 Original research article, The ring quest: where do people buy? |
| F22 | 22% of purchasers said the final ring decision was shared. Definition: Final purchase decision, not any recipient input. Qualification: Purchaser subgroup n is unpublished. Not directly comparable with The Knot’s broader 79% recipient-input measure. | Purchasers in the selected US insurance-decision-maker survey; subgroup n unpublished United States May 2026 survey; rings purchased/received and engagement/marriage within preceding five years Overall report n=2,000. Item/subgroup bases are not provided alongside these estimates. Overall report size is not the valid base for every item. | Jewelers Mutual Published 2026-10; associated newsroom release 2026-10-08 Original research article, ring quest final paragraph. |
| F23 | 61% said both partners wore an engagement ring;43% at ages 18–24 versus over 80% at 55–64. Definition: Respondents’ description of mutual ring-wearing. Qualification: Age groups are respondents, not independently verified matched couples. No subgroup bases; over 80% is an inequality, not an exact 80%. | Adults 18+ responsible for household insurance decisions, who bought/received an engagement ring within five years and were engaged or married within five years United States May 2026 survey; rings purchased/received and engagement/marriage within preceding five years Overall report n=2,000. Item/subgroup bases are not provided alongside these estimates. Overall report size is not the valid base for every item. | Jewelers Mutual Published 2026-10; associated newsroom release 2026-10-08 Original research article ring quest; newsroom generational split paragraph. |
| F24 | 41% of proposers held the ring for more than a month before proposing. Definition: Time between possession of the ring and proposing. Qualification: Different from when research started or when a purchase was selected. Proposer subgroup n unpublished. | Proposers in the selected US insurance-decision-maker survey; subgroup n unpublished United States May 2026 survey; rings purchased/received and engagement/marriage within preceding five years Overall report n=2,000. Item/subgroup bases are not provided alongside these estimates. Overall report size is not the valid base for every item. | Jewelers Mutual Published 2026-10; associated newsroom release 2026-10-08 Original newsroom, A protection gap that starts before the proposal. |
| F25 | 45% stored the ring in an unsecured place before proposing. Definition: Unsecured storage such as a drawer or closet. Qualification: Not an observed theft/loss probability, or proof that any particular storage method caused harm. | Adults 18+ responsible for household insurance decisions, who bought/received an engagement ring within five years and were engaged or married within five years United States May 2026 survey; rings purchased/received and engagement/marriage within preceding five years Overall report n=2,000. Item/subgroup bases are not provided alongside these estimates. Overall report size is not the valid base for every item. | Jewelers Mutual Published 2026-10; associated newsroom release 2026-10-08 Original newsroom, A protection gap that starts before the proposal. |
| F26 | 62% placed the ring among their three most expensive possessions;47% said the purchase was not financially stressful. Definition: Asset-value rank and reported purchase stress are separate items. Qualification: No respondent overlap is published. Do not infer 15% own a valuable ring and are stressed, or invert not stressful into severe stress. | Adults 18+ responsible for household insurance decisions, who bought/received an engagement ring within five years and were engaged or married within five years United States May 2026 survey; rings purchased/received and engagement/marriage within preceding five years Overall report n=2,000. Item/subgroup bases are not provided alongside these estimates. Overall report size is not the valid base for every item. | Jewelers Mutual Published 2026-10; associated newsroom release 2026-10-08 Original research article, What was the average cost? |
| F27 | 74% said their engagement ring was their first piece of fine jewelry. Definition: First fine-jewelry experience, according to the respondent. Qualification: Does not establish lack of knowledge or a need to buy a particular financial product. | Adults 18+ responsible for household insurance decisions, who bought/received an engagement ring within five years and were engaged or married within five years United States May 2026 survey; rings purchased/received and engagement/marriage within preceding five years Overall report n=2,000. Item/subgroup bases are not provided alongside these estimates. Overall report size is not the valid base for every item. | Jewelers Mutual Published 2026-10; associated newsroom release 2026-10-08 Original research article, Why is it important to protection engagement rings with insurance? |
| F28 | Solitaire settings were 37% in 2026 versus 22% in 2024; white gold was 43% versus 35%. Definition: Publisher-reported comparisons between study waves. Qualification: 2024 sample details and design comparability were not established here. Descriptive wave figures, not tracked individual change. | Adults 18+ responsible for household insurance decisions, who bought/received an engagement ring within five years and were engaged or married within five years United States Publisher’s 2024 and May 2026 study comparisons Overall report n=2,000. Item/subgroup bases are not provided alongside these estimates. Overall report size is not the valid base for every item. | Jewelers Mutual Published 2026-10; associated newsroom release 2026-10-08 Newsroom Design still wins over price; research article popular-styles section. |
Does celebrating both partners equally mean giving both a gift?
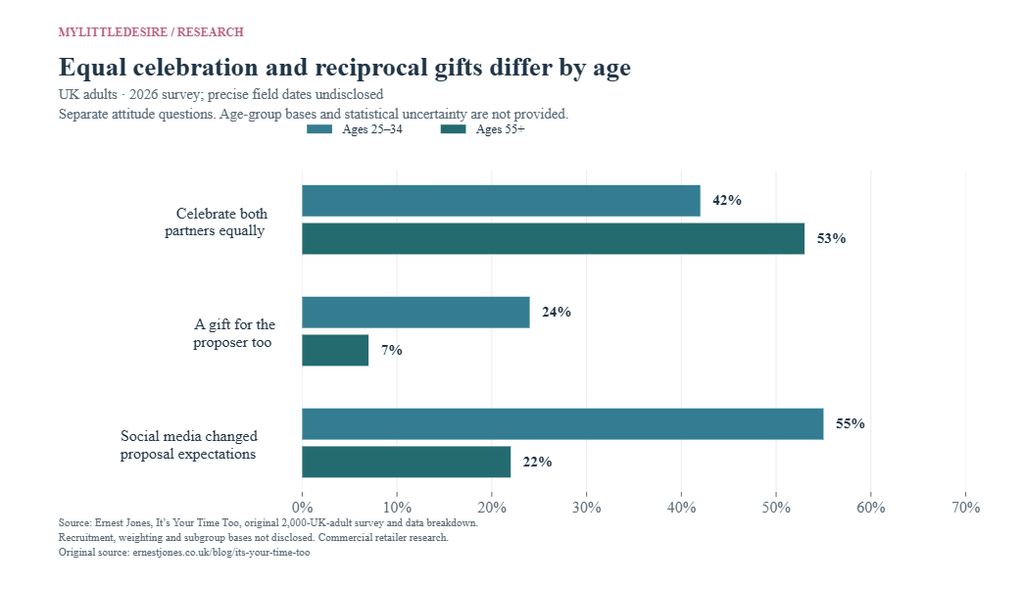
In Ernest Jones’s UK survey, support for equal celebration and support for a gift for the proposer followed different age patterns. The comparison shows why those questions should stay distinct. It does not identify inconsistent individuals or measure actual gift exchange.
| ID | Finding and qualification | Population, actual period and base | Original source and locator |
|---|---|---|---|
| F29 | 48% supported celebrating both partners equally;49% of women and 46% of men agreed. Definition: Agreement with an equality-of-celebration statement. Qualification: Attitude, not proof of equal power, shared spending or actual celebration behavior. | UK adults United Kingdom 2026 survey; precise field dates not disclosed Overall report n=2,000. Item/subgroup bases are not provided alongside these estimates. Overall report size is not the valid base for every item. | Ernest Jones Published 2026; exact publication date not displayed Original article, Should engagements celebrate both partners equally? |
| F30 | Equal celebration was supported by 44% of 18–24-year-olds,42% of 25–34 s and 53% of those 55+. Definition: Same statement across age groups. Qualification: Subgroup counts and uncertainty not disclosed. Cross-sectional group differences are not individual change. | UK adults United Kingdom 2026 survey; precise field dates not disclosed Overall report n=2,000. Item/subgroup bases are not provided alongside these estimates. Overall report size is not the valid base for every item. | Ernest Jones Published 2026; exact publication date not displayed Should engagements celebrate both partners equally? age paragraph. |
| F31 | 13% favored a gift for the proposer;24% at ages 25–34 versus 7% at 55+. Definition: Agreement that the proposer should also receive a gift. Qualification: A reciprocal gift is one possible interpretation of celebration, not a test of whether someone values equality. | UK adults United Kingdom 2026 survey; precise field dates not disclosed Overall report n=2,000. Item/subgroup bases are not provided alongside these estimates. Overall report size is not the valid base for every item. | Ernest Jones Published 2026; exact publication date not displayed Should the proposer receive an engagement gift too? |
| F32 | 9% felt comfortable being asked for a return gift;20% at 18–24 versus 4% at 55+. Definition: Comfort with the partner asking for a reciprocal gift. Qualification: Different from spontaneously giving a gift or supporting the proposer receiving one. | UK adults United Kingdom 2026 survey; precise field dates not disclosed Overall report n=2,000. Item/subgroup bases are not provided alongside these estimates. Overall report size is not the valid base for every item. | Ernest Jones Published 2026; exact publication date not displayed Should the proposer receive an engagement gift too? final paragraph. |
| F33 | 37% liked traditional engagement customs and felt they mattered;41% of those 55+ agreed. Definition: Positive attitude toward traditional engagement customs. Qualification: Traditional and equal-celebration preferences can coexist; responses across statements are not exclusive. | UK adults United Kingdom 2026 survey; precise field dates not disclosed Overall report n=2,000. Item/subgroup bases are not provided alongside these estimates. Overall report size is not the valid base for every item. | Ernest Jones Published 2026; exact publication date not displayed Are engagement traditions outdated? |
| F34 | 21% felt some engagement traditions were outdated;25% of men versus 18% of women. Definition: At least some traditions feel outdated. Qualification: Not rejection of every tradition, and not the complement of liking traditional customs. | UK adults United Kingdom 2026 survey; precise field dates not disclosed Overall report n=2,000. Item/subgroup bases are not provided alongside these estimates. Overall report size is not the valid base for every item. | Ernest Jones Published 2026; exact publication date not displayed Are engagement traditions outdated? gender paragraph. |
| F35 | 38% supported creating personal engagement traditions;41% of women versus 35% of men. Definition: Agreement with couples creating their own traditions. Qualification: Does not measure whether respondents actually changed a proposal custom. | UK adults United Kingdom 2026 survey; precise field dates not disclosed Overall report n=2,000. Item/subgroup bases are not provided alongside these estimates. Overall report size is not the valid base for every item. | Ernest Jones Published 2026; exact publication date not displayed Should couples create their own engagement traditions? |
| F36 | 36% felt social media changed proposal expectations;51% at 18–24,55% at 25–34 and 22% at 55+. Definition: Perception that social media changed expectations. Qualification: Not the proportion feeling personal pressure or a demonstrated causal media effect. | UK adults United Kingdom 2026 survey; precise field dates not disclosed Overall report n=2,000. Item/subgroup bases are not provided alongside these estimates. Overall report size is not the valid base for every item. | Ernest Jones Published 2026; exact publication date not displayed Is social media changing how we propose? |
What do adults want financially before engagement?
Chime’s original report surveyed US adults in serious relationships, engaged or married. Its figures concern perceived readiness, spending priorities and hypothetical alternatives. They are not engagement-ring market shares or proof that everyone followed the priorities they described.
| ID | Finding and qualification | Population, actual period and base | Original source and locator |
|---|---|---|---|
| F37 | 61% felt social media reshaped proposal culture;78% of Gen Z and 65% of millennials. Definition: Perception of proposal culture. Qualification: Not all US adults or an objective causal estimate. Generation/item bases are not supplied. | US adults in serious relationships, engaged or married United States 2026 publication; precise field dates not disclosed on issuer page Overall report n=2,000. Item/subgroup bases are not provided alongside these estimates. Overall report size is not the valid base for every item. | Chime / Talker Research Published 2026-03-20 Original issuer article, By the Numbers. |
| F38 | 74% preferred starting married life debt-free to spending heavily on a ring;64% of Gen Z and 70% of millennials. Definition: Hypothetical priority between debt-free marriage and heavy ring spending. Qualification: Not a measured rate of debt, ring financing, regret or actual wedding choices. | US adults in serious relationships, engaged or married United States 2026 publication; precise field dates not disclosed on issuer page Overall report n=2,000. Item/subgroup bases are not provided alongside these estimates. Overall report size is not the valid base for every item. | Chime / Talker Research Published 2026-03-20 By the Numbers and survey-introduction paragraph. |
| F39 | 44% associated financial readiness with two steady incomes;46% of Gen Z versus 25% of millennials. Definition: One stated meaning of financial readiness. Qualification: Not a universal readiness requirement or proof that both partners currently have stable employment. | US adults in serious relationships, engaged or married United States 2026 publication; precise field dates not disclosed on issuer page Overall report n=2,000. Item/subgroup bases are not provided alongside these estimates. Overall report size is not the valid base for every item. | Chime / Talker Research Published 2026-03-20 By the Numbers; How are Couples Turning Engagement into a Shared Financial Milestone? |
| F40 | 40% considered transparent money discussions essential before engagement;39% of Gen Z and 36% of millennials. Definition: Stated importance of financial transparency before engagement. Qualification: Not the proportion who had the conversation, or the complement of financial secrecy. | US adults in serious relationships, engaged or married United States 2026 publication; precise field dates not disclosed on issuer page Overall report n=2,000. Item/subgroup bases are not provided alongside these estimates. Overall report size is not the valid base for every item. | Chime / Talker Research Published 2026-03-20 By the Numbers and shared-financial-milestone section. |
| F41 | 40% named budget the leading ring-spending factor, versus 21% symbolic value. Definition: Published spending-priority responses. Qualification: The release does not provide the complete answer distribution or a direct trade-off experiment. | US adults in serious relationships, engaged or married United States 2026 publication; precise field dates not disclosed on issuer page Overall report n=2,000. Item/subgroup bases are not provided alongside these estimates. Overall report size is not the valid base for every item. | Chime / Talker Research Published 2026-03-20 How are Engagement Rings Changing? first paragraph. |
| F42 | 23% would consider a lab-grown diamond and 21% a resale-platform ring. Definition: Willingness to consider alternative purchases. Qualification: Not actual market shares; options can overlap. Do not compare as though they were The Knot’s completed ring purchases. | US adults in serious relationships, engaged or married United States 2026 publication; precise field dates not disclosed on issuer page Overall report n=2,000. Item/subgroup bases are not provided alongside these estimates. Overall report size is not the valid base for every item. | Chime / Talker Research Published 2026-03-20 How are Engagement Rings Changing? bullets. |
| F43 | 25% of Gen Z and 21% of millennials would consider tattooed rings or matching tattoos. Definition: Hypothetical consideration of two grouped tattoo alternatives. Qualification: Not actual tattoo prevalence or a judgment about the meaning of ring-based proposals. | US adults in serious relationships, engaged or married United States 2026 publication; precise field dates not disclosed on issuer page Overall report n=2,000. Item/subgroup bases are not provided alongside these estimates. Overall report size is not the valid base for every item. | Chime / Talker Research Published 2026-03-20 How are Engagement Rings Changing? final bullet. |
Broader relationship context appears in our relationship satisfaction, trust and communication research. A stated financial preference does not establish how a couple communicates in practice.
What can research on accepted and rejected proposals tell us?
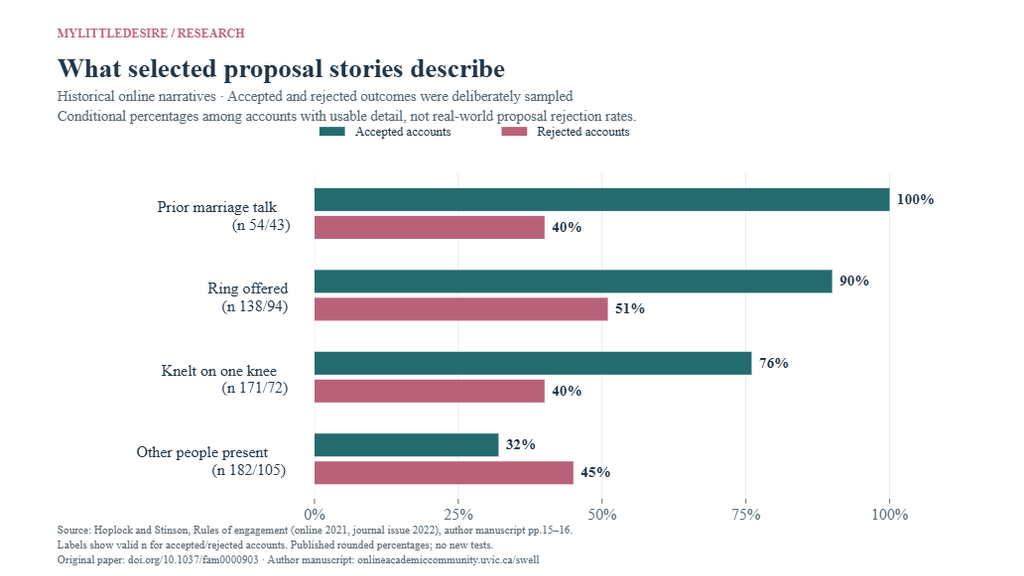
Hoplock and Stinson analyzed historical first-person accounts from online forums. The researchers intentionally sought both accepted and rejected stories. Their comparisons are useful for studying narratives and relationship scripts, but cannot establish an overall rejection rate or an acceptance formula.
| ID | Finding and qualification | Population, actual period and base | Original source and locator |
|---|---|---|---|
| F44 | Dating duration averaged 2.20 years in rejected accounts (n=67) versus 4.20 in accepted accounts (n=39). Published difference:−2.00 years,95% CI −2.80 to −1.20. Definition: Only narratives giving enough information to code prior relationship duration. Qualification: Selected narrative means; the reported confidence interval concerns the authors’ rejected-minus-accepted difference. Historical selected internet accounts; not a population estimate, success formula or causal test. Published uncertainty: Rejected accounts: prior dating years: SD 2.1; Accepted accounts: prior dating years: SD 1.81; Published rejected-minus-accepted duration difference: -2.8 to -1.2 (95% confidence interval). | Selected first-person written accounts of men proposing to women English-language Reddit/Weddingbee accounts; participants’ countries not established Accounts posted April 2006–January 2015; sampled January 7–February 12 and May 6–7,2015; proposal events can predate posts Overall report n=374. Published input bases: 39, 67, 106. Overall report size is not the valid base for every item. | Lisa B. Hoplock and Danu Anthony Stinson / University of Victoria Published 2021-07-29 Author manuscript physical pp.14–15, RQ 1. |
| F45 | Prior marriage discussion appeared in 40% of rejected accounts (n=43) versus 100% of accepted accounts (n=54) with relevant information. Definition: Coded prior discussion among accounts with sufficient detail. Qualification: 100% applies to 54 selected accepted stories, not to all successful real-world proposals. Historical selected internet accounts; not a population estimate, success formula or causal test. | Selected first-person written accounts of men proposing to women English-language Reddit/Weddingbee accounts; participants’ countries not established Accounts posted April 2006–January 2015; sampled January 7–February 12 and May 6–7,2015; proposal events can predate posts Overall report n=374. Published input bases: 43, 54. Overall report size is not the valid base for every item. | Lisa B. Hoplock and Danu Anthony Stinson / University of Victoria Published 2021-07-29 Author manuscript physical p.15, RQ 1. |
| F46 | A ring was offered in 51% of rejected accounts (48/94) versus 90% of accepted accounts (124/138). Definition: Ring offering among accounts where coders could determine the detail. Qualification: Percentages are the authors’ rounded values; do not convert association into a causal ring effect. Historical selected internet accounts; not a population estimate, success formula or causal test. | Selected first-person written accounts of men proposing to women English-language Reddit/Weddingbee accounts; participants’ countries not established Accounts posted April 2006–January 2015; sampled January 7–February 12 and May 6–7,2015; proposal events can predate posts Overall report n=374. Published input bases: 94, 138. Overall report size is not the valid base for every item. | Lisa B. Hoplock and Danu Anthony Stinson / University of Victoria Published 2021-07-29 Author manuscript physical p.15, RQ 2. |
| F47 | Kneeling appeared in 40% of rejected accounts (29/72) versus 76% of accepted accounts (130/171). Definition: Kneeling among accounts with usable detail. Qualification: A missing detail is not automatically an absence. Do not multiply this association into a claimed rejection risk. Historical selected internet accounts; not a population estimate, success formula or causal test. | Selected first-person written accounts of men proposing to women English-language Reddit/Weddingbee accounts; participants’ countries not established Accounts posted April 2006–January 2015; sampled January 7–February 12 and May 6–7,2015; proposal events can predate posts Overall report n=374. Published input bases: 72, 171. Overall report size is not the valid base for every item. | Lisa B. Hoplock and Danu Anthony Stinson / University of Victoria Published 2021-07-29 Author manuscript physical p.15, RQ 2. |
| F48 | Other people were present in 45% of rejected accounts (n=105) versus 32% of accepted accounts (n=182) with usable detail. Definition: Audience presence, coded by the researchers as public/private. Qualification: The sample was selected partly by outcome; a 13-point contrast is not an increase in real-world rejection probability. Historical selected internet accounts; not a population estimate, success formula or causal test. | Selected first-person written accounts of men proposing to women English-language Reddit/Weddingbee accounts; participants’ countries not established Accounts posted April 2006–January 2015; sampled January 7–February 12 and May 6–7,2015; proposal events can predate posts Overall report n=374. Published input bases: 105, 182. Overall report size is not the valid base for every item. | Lisa B. Hoplock and Danu Anthony Stinson / University of Victoria Published 2021-07-29 Author manuscript physical p.16, RQ 3. |
| F49 | The researchers reported that 31% continued dating after a rejected proposal. Definition: Relationship continuation in the rejected-story analysis. Qualification: This percentage’s item n is not stated in the paragraph. The study cannot estimate continuation among all rejected couples. Historical selected internet accounts; not a population estimate, success formula or causal test. | Selected first-person written accounts of men proposing to women English-language Reddit/Weddingbee accounts; participants’ countries not established Accounts posted April 2006–January 2015; sampled January 7–February 12 and May 6–7,2015; proposal events can predate posts Overall report n=374. Item/subgroup bases are not provided alongside these estimates. Overall report size is not the valid base for every item. | Lisa B. Hoplock and Danu Anthony Stinson / University of Victoria Published 2021-07-29 Author manuscript physical p.16, RQ 5. |
| F50 | For 21 accounts specifying duration after rejection, relationships continued an average 2.41 years (SD 3.17; range 0.02–12). Definition: Selected subset with more specific post-rejection duration information. Qualification: Not a follow-up survival estimate, or the typical duration for all couples after rejection. Historical selected internet accounts; not a population estimate, success formula or causal test. Published uncertainty: Post-rejection relationship duration mean: SD 3.17. | Selected first-person written accounts of men proposing to women English-language Reddit/Weddingbee accounts; participants’ countries not established Accounts posted April 2006–January 2015; sampled January 7–February 12 and May 6–7,2015; proposal events can predate posts Overall report n=374. Published input bases: 21. Overall report size is not the valid base for every item. | Lisa B. Hoplock and Danu Anthony Stinson / University of Victoria Published 2021-07-29 Author manuscript physical p.16, RQ 5. |
| F51 | Five couples in the analyzed rejected-proposal accounts later married. Definition: Observed case count within the selected retrospective narratives. Qualification: Not 5%, a population probability, a prediction or advice to persist after a refusal. Historical selected internet accounts; not a population estimate, success formula or causal test. | Selected first-person written accounts of men proposing to women English-language Reddit/Weddingbee accounts; participants’ countries not established Accounts posted April 2006–January 2015; sampled January 7–February 12 and May 6–7,2015; proposal events can predate posts Overall report n=374. Item/subgroup bases are not provided alongside these estimates. Overall report size is not the valid base for every item. | Lisa B. Hoplock and Danu Anthony Stinson / University of Victoria Published 2021-07-29 Author manuscript physical p.16, RQ 5, final sentence before thematic coding. |
What does Australian engagement research show?
Easy Weddings supplies industry-survey context on rings, engagement length and seasonality. Its report combines several data streams and does not allocate a valid sample to every panel. Finder’s separate survey below measures attitudes toward a salary rule, rather than completed ring spending.
| ID | Finding and qualification | Population, actual period and base | Original source and locator |
|---|---|---|---|
| F52 | The reported average engagement-ring cost was A$6,842. Definition: Reported average in the industry survey, in Australian dollars. Qualification: Not a median, spending recommendation or official national estimate. Ring-purchase dates and valid item n undisclosed. | Engaged and recently married couples in the industry survey Australia 2026 industry report; ring-purchase dates and exact field dates undisclosed Item/subgroup bases are not provided alongside these estimates. Overall report size is not the valid base for every item. | Easy Weddings Published 2026-02; exact date not printed Original PDF physical p.6, Wedding Budgets and Finance. |
| F53 | The report described an average engagement of 24 months. Definition: Industry report’s average engagement length. Qualification: Mixed engaged/recently married sample; planned versus completed durations not separated in the panel. Not directly comparable with the US newlywed-only 14-month figure. | Engaged and recently married couples in the industry survey Australia 2026 report; mixed engaged/recently married sample; proposal-date display covers 2024–2025; precise field dates undisclosed Item/subgroup bases are not provided alongside these estimates. Overall report size is not the valid base for every item. | Easy Weddings Published 2026-02; exact date not printed Original PDF physical p.8, The Average Australian Couple. |
| F54 | December accounted for 13% of reported proposals and was the leading month. Definition: Proposal-month share in the report’s selected data. Qualification: Not 13% of all Australian proposals. Do not infer a 2027 holiday forecast or use wedding-month percentages as proposal-month data. | Engaged and recently married couples in the industry survey Australia Reported proposal dates 2024–2025; survey field dates undisclosed Item/subgroup bases are not provided alongside these estimates. Overall report size is not the valid base for every item. | Easy Weddings Published 2026-02; exact date not printed Original PDF physical p.9, opening paragraph and Most Popular Engagement Dates 2024–2025. |
What do Australians think of the three-month salary rule?
Finder’s August 2026 wave asked whether ring spending should fall below, at or above three months’ salary. The responses describe a belief about a spending norm. They do not tell readers how much they personally should spend.
| ID | Finding and qualification | Population, actual period and base | Original source and locator |
|---|---|---|---|
| F55 | 69% favored spending less than three months’ salary on a ring;21% favored three months and 10% more. Definition: Attitude toward a salary-linked spending norm. Qualification: Not actual spending, a financial rule or a nationally observed purchase distribution. Avoid repeating unsupported divorce/argument claims from promotional quotations. | Australian respondents; release does not state the age cutoff Australia August 2026 Overall report n=1,006. Item/subgroup bases are not provided alongside these estimates. Overall report size is not the valid base for every item. | Finder / Qualtrics Published 2026-10-15 Original release, opening research paragraphs; Credits. |
Do British adults prefer public or private proposals?
YouGov’s Daily Question asked GB adults what they would prefer, including those who would not want any proposal. Preferences should not be substituted for actual proposal settings among engaged or married couples. Great Britain and the United Kingdom are also different geographic bases.
| ID | Finding and qualification | Population, actual period and base | Original source and locator |
|---|---|---|---|
| F56 | 67% preferred a private proposal,5% a public one;18% wanted no proposal and 9% did not know. Definition: Hypothetical preference among GB adults. Qualification: Rounded total 99%. Keep the no-proposal and unsure respondents in the denominator; this is not 67% of people currently expecting a proposal. | GB adults Great Britain 2024-11-22 Overall report n=4,216. Published input bases: 4,216. Overall report size is not the valid base for every item. | YouGov Published 2024-11-22 Original Daily Question, all-adult result chart. |
How do UK adults view parental permission and future marriage?
YouGov’s 2026 full results separate a specifically worded father-permission tradition from future marriage intentions. The intention questions have a restricted previously/never-married base. Neither question measures an imminent proposal or consent between current partners.
| ID | Finding and qualification | Population, actual period and base | Original source and locator |
|---|---|---|---|
| F57 | 42% favored preserving the groom asking the bride’s father for permission;44% favored dropping it and 14% were unsure. Definition: Attitude to the specifically worded father-permission tradition. Qualification: Not permission sought in real proposals, and not an equivalent question about parents of all genders. | UK adults 18+; marriage-intention items restricted to the source’s previously/never-married base United Kingdom, including Northern Ireland 2026-08-07 to 2026-08-09 Overall report n=1,784. Published input bases: 1,784. Overall report size is not the valid base for every item. | YouGov Published 2026-08-27 Original cross-tab PDF physical p.3, WeddingTraditions_3. |
| F58 | 46% of men versus 39% of women favored the father-permission tradition;40% versus 47% favored dropping it. Definition: Weighted response percentages with unweighted male/female bases 829/955. Qualification: Not paired partners, observed family approval or a measure of private relationship consent. | UK adults 18+; marriage-intention items restricted to the source’s previously/never-married base United Kingdom, including Northern Ireland 2026-08-07 to 2026-08-09 Overall report n=1,784. Published input bases: 829, 955. Overall report size is not the valid base for every item. | YouGov Published 2026-08-27 Original cross-tab PDF physical p.3, WeddingTraditions_3, gender columns. |
| F59 | In the previously/never-married base,19% definitely and 23% probably wanted to marry someday;18% probably did not and 25% definitely did not. Definition: Stated future marriage intention in the source’s restricted base. Qualification: Not current engagements, proposal intentions or all UK adults. The source base label is retained; no new 42% net is reconstructed from rounded categories. | Source’s UK adults married in the past or never married; unweighted n=968, weighted base 993 United Kingdom, including Northern Ireland 2026-08-07 to 2026-08-09 Overall report n=1,784. Published input bases: 968. Overall report size is not the valid base for every item. | YouGov Published 2026-08-27 Original cross-tab PDF physical p.1, MarriageWish; unweighted base 968, weighted base 993. |
| F60 | Definitely wanting to marry someday was 35% at ages 18–24,33% at 25–34 and 3% at 55+ in the restricted base. Definition: Strength of future marriage intention among previously/never-married age groups. Qualification: These are different age groups, not individual decline over time, engagement prevalence or timing of a planned proposal. | Previously/never-married UK age groups; unweighted bases 18–24:n 176,25–34:n 174,55+:n 337 United Kingdom, including Northern Ireland 2026-08-07 to 2026-08-09 Overall report n=1,784. Published input bases: 174, 176, 337. Overall report size is not the valid base for every item. | YouGov Published 2026-08-27 Original cross-tab PDF physical p.1, MarriageWish age columns; unweighted bases 176/174/337. |
What comparisons does MyLittleDesire add?
We organize useful contrasts, show the arithmetic and preserve the population and question limits. Some differences are already apparent in the original publications. These are descriptive comparisons of published aggregates, not new fieldwork, new scientific discoveries or newly tested causal effects.
| Comparison | Arithmetic and units | Original source | Interpretation limit |
|---|---|---|---|
| C01 · Planned proposals minus discussed proposal preferences | 85% − 51% = +34.0 percentage points | The Knot / The Knot Worldwide F07 / F08 | Separate marginal measures; not the share planned without a prior conversation. Item bases are not disclosed. |
| C02 · Surprise proposals minus prior proposal-preference discussion | 81% − 51% = +30.0 percentage points | The Knot / The Knot Worldwide F07 / F08 | Separate marginal questions. No individual overlap or contradiction is established. |
| C03 · Ring recipient input minus no recipient input | 79% − 21% = +58.0 percentage points | The Knot / The Knot Worldwide F14 / F14 | Published complementary input categories; not shared final decision-making or who paid. |
| C04 · Natural-stone minus lab-grown listed ring cost | 7,000.00 − 4,300.00 = +2,700.00 US dollars | The Knot / The Knot Worldwide F16 / F16 | Unadjusted publisher-listed subtype averages/costs, not like-for-like products, a recommended spend or a causal saving. |
| C05 · Lab-grown minus natural-stone listed carat weight | 2 − 1.6 = +0.4 carats | The Knot / The Knot Worldwide F17 / F17 | Publisher’s common carat label; center versus total weight is not fully specified. Not a comparison of otherwise identical rings. |
| C06 · Ring-style influence: friends/family minus social media | 48% − 28% = +20.0 percentage points | Jewelers Mutual F20 / F20 | Separate overlapping influence responses in the selected insurance-decision-maker sample; not a causal or trust effect. |
| C07 · Ring-style influence: trends minus celebrities | 47% − 15% = +32.0 percentage points | Jewelers Mutual F20 / F20 | Overlapping responses; not the number of people influenced by trends but not celebrities. |
| C08 · Solitaire settings: 2026 minus 2024 reported wave | 37% − 22% = +15.0 percentage points | Jewelers Mutual F28 / F28 | Prior-wave methodology not fully established here; descriptive published contrast, not individual change. |
| C09 · Equal-celebration support: 55+ minus 25–34 | 53% − 42% = +11.0 percentage points | Ernest Jones F30 / F30 | Cross-sectional age groups; sample bases and uncertainty not disclosed. |
| C10 · Reciprocal-gift support: 25–34 minus 55+ | 24% − 7% = +17.0 percentage points | Ernest Jones F31 / F31 | Cross-sectional stated preference, not actual gifts or equal relationship power. |
| C11 · Being asked for gift: 18–24 minus 55+ comfort | 20% − 4% = +16.0 percentage points | Ernest Jones F32 / F32 | Different age groups; comfort with a request differs from voluntarily offering a gift. |
| C12 · Changed social expectations: 25–34 minus 55+ | 55% − 22% = +33.0 percentage points | Ernest Jones F36 / F36 | Perceived change, not personal pressure or a demonstrated effect of media exposure. |
| C13 · Overall equality support minus reciprocal-gift support | 48% − 13% = +35.0 percentage points | Ernest Jones F29 / F31 | Separate marginal statements; the 35-point contrast is not an individual inconsistency rate. |
| C14 · New-tradition support: women minus men | 41% − 35% = +6.0 percentage points | Ernest Jones F35 / F35 | Unadjusted gender contrast; no significance test or population certainty is added. |
| C15 · Financial readiness as two incomes: Gen Z minus millennials | 46% − 25% = +21.0 percentage points | Chime / Talker Research F39 / F39 | Separate generation groups in a selected relationship sample; subgroup bases not disclosed. |
| C16 · Ring-spending priority: budget minus symbolic value | 40% − 21% = +19.0 percentage points | Chime / Talker Research F41 / F41 | Selected published answer categories; full response table and item base not disclosed. |
| C17 · Accepted minus rejected accounts: prior marriage discussion | 100% − 40% = +60.0 percentage points | Lisa B. Hoplock and Danu Anthony Stinson / University of Victoria F45 / F45 | Historical outcome-selected narratives, valid n 54/43. Not the effect of discussion on the probability of acceptance. |
| C18 · Accepted minus rejected accounts: ring offered | 90% − 51% = +39.0 percentage points | Lisa B. Hoplock and Danu Anthony Stinson / University of Victoria F46 / F46 | Historical selected accounts, valid n 138/94; rounded published percentages, not a causal ring effect. |
| C19 · Rejected minus accepted accounts: other people present | 45% − 32% = +13.0 percentage points | Lisa B. Hoplock and Danu Anthony Stinson / University of Victoria F48 / F48 | Selected accounts, valid n 105/182. This 13-point contrast is not the real-world risk of proposal rejection. |
| C20 · Rejected minus accepted accounts: prior dating duration | 2.2 − 4.2 = -2.00 years | Lisa B. Hoplock and Danu Anthony Stinson / University of Victoria F44 / F44 | Selected historical accounts, valid n 67/39. Reproduces the original−2.00-year contrast; original 95% CI is recorded as a source finding. |
Which sources can be compared?
Within-study contrasts are usually easier to interpret than country comparisons. Even within a source, questions and valid bases can differ. The following map explains why apparently similar percentages should stay separate.
| Research source | Eligible population | Actual period | Key comparison boundary |
|---|---|---|---|
| The Knot / The Knot Worldwide | The Knot/WeddingWire adult members married during 2025; some report findings also draw on ad hoc engaged/newlywed studies | 2025 newlywed cohort; retrospective proposals/dating can predate 2025; additional studies fielded during 2025 | Opt-in brand-member sample, not a probability sample of every US proposal. Successful newlyweds exclude many declined proposals and relationships that never married. Core n=10,474 is not established as every item’s valid base. Release dateline is February 18,2026; the current newsroom page displays April 24,2026. Wedding cohort, fieldwork and proposal-event year are different. |
| Jewelers Mutual | Adults 18+ responsible for household insurance decisions, who bought/received an engagement ring within five years and were engaged or married within five years | May 2026 survey; rings purchased/received and engagement/marriage within preceding five years | Selected insurance-decision-maker sample, not all engaged people or all couples. Question/subgroup bases, weights and precision are not provided. Resource and newsroom pages contain inconsistencies for some unused research/loss figures. The 2024 comparison sample is not fully documented here. Direct local HTML downloads returned a blocked body; the original pages and methods were read through public web extraction. |
| Ernest Jones | UK adults | 2026 survey; precise field dates not disclosed | Recruitment, survey vendor, weights, field dates, full response options and subgroup bases are not disclosed. Promotional context is an engagement-watch launch. Responses express attitudes, not observed proposal conduct. No significance tests are supplied. City and birth-month storytelling is excluded. |
| Chime / Talker Research | US adults in serious relationships, engaged or married | 2026 publication; precise field dates not disclosed on issuer page | Not all US adults. The issuer page does not publish recruitment, weighting, complete questionnaire, field dates or generation/item bases. Stated preferences are not completed purchases or proof of social-media causation. Ring-cost recall is not used because its eligible base is unclear. |
| Lisa B. Hoplock and Danu Anthony Stinson / University of Victoria | Selected first-person written accounts of men proposing to women | Accounts posted April 2006–January 2015; sampled January 7–February 12 and May 6–7,2015; proposal events can predate posts | Outcome-balanced search selection prevents estimating the real-world rejection rate. Old self-selected internet narratives, missing item information, gender/relationship restrictions and uncertain verification limit generalization. Accounts are not a nationally representative US/Canadian sample. Associations are not evidence that a ring, kneeling or privacy causes acceptance. |
| Easy Weddings | Engaged and recently married couples in the industry survey | 2026 report; mixed engaged/recently married sample; proposal-date display covers 2024–2025; precise field dates undisclosed | Source contributions and valid bases are not allocated to each selected panel. More than 4,200 is not an exact item n, and 68,000 Instagram followers are not additional survey respondents. Planned versus actual costs and ring-purchase dates are not fully separated. Not an official national proposal census. |
| Finder / Qualtrics | Australian respondents; release does not state the age cutoff | August 2026 | Release’s broader 60,000+ historical tracker count is not this wave’s sample. Recruitment, exact dates, weights and uncertainty are not fully disclosed. These are views on a salary-spending norm, not actual ring expenditure or a financial recommendation. |
| YouGov | GB adults | 2024-11-22 | Great Britain is not the full United Kingdom. Opt-in polling; item-specific weighting/precision not disclosed on the question page. Preferences are not actual proposal experiences. Rounded answers sum to 99%; do not redistribute the missing point. |
| YouGov | UK adults 18+; marriage-intention items restricted to the source’s previously/never-married base | 2026-08-07 to 2026-08-09 | Attitudes, not real proposal acceptance or current engagements. Keep weighted estimates distinct from unweighted sample counts. Marriage-intention responses include people without a current partner and do not identify an intention to propose soon. |
Three tempting comparisons to avoid
- Privacy: the GB adult preference question and US newlywed proposal-setting question are different measures. Their difference is not a country gap in actual private proposals.
- Ring collaboration: The Knot’s recipient-input measure is broader than Jewelers Mutual’s purchaser final-decision measure. The difference does not establish that one group communicates better.
- Cost and timing: Australian and US ring costs use different currencies and samples. Their engagement-length figures also mix different planned/completed and wedding-cohort definitions. No country cost or duration ranking is calculated.
How was this research resource compiled?
We checked original industry reports, original survey publications and the author-hosted manuscript of a peer-reviewed study. For each finding, we recorded the original organization, direct source, publication label, actual period, eligible population, disclosed sample information, definition, exact table or section locator, caveat and review date. Supporting publications from one research program are kept in the same source record.
The 60 grouped findings contain 137 numeric inputs. Related response categories are grouped instead of being treated as independent research discoveries. The Knot supplies 18 findings, the largest share at 30%; no single source supplies most of the resource. The nine source records represent eight publishing/research groups, with two distinct YouGov surveys. They are not nine proven statistically independent datasets, because panel overlap and the allocation of additional industry studies are not fully disclosed.
MyLittleDesire adds question-based organization, measurement comparisons, four charts and 20 reproducible subtractions. Results preserve percentage points, US dollars, carats or years as appropriate. The historical dating-duration difference and its 95% confidence interval come from the original authors; we do not estimate new intervals. We do not infer individual overlap from marginal percentages.
Important limitations
- Most contemporary evidence is commercially commissioned and uses selected panels, customers or wedding-platform members. It is not a government census of proposals.
- Several releases do not disclose recruitment, weights, full questionnaires, item bases or subgroup uncertainty. We preserve those limits and do not invent precision or national representativeness.
- Publication year, fieldwork year, proposal event, ring-purchase window and wedding cohort are distinct. Historical or retrospective observations do not become 2027 measurements because of this page’s title.
- The historical narrative study restricts the analyzed proposals to men proposing to women. Its country mix is unknown. It cannot establish a real-world rejection rate or acceptance advice.
- We withheld the Queensmith customer figures because its introduction and methods give conflicting sample totals. We also excluded ambiguous Jewelers Mutual research/loss figures and a range mislabeled as an average.
- The Chime cost-recall item, retailer LGBTQ survey generalizations and hypothetical refusal rates are not used as verified population benchmarks.
- No adequate Canada-specific population proposal benchmark was verified. A Canadian university’s authorship does not establish Canadian population coverage.
- Currency, cost definition and target population prevent an international ring-cost league table. No exchange-rate conversion or price-equivalence adjustment is invented.
Questions publishers ask
What percentage of proposals are surprises?
The Knot reported 81% in its 2026 study covering a 2025 newlywed cohort and additional research. Keep the wedding cohort and retrospective nature with the figure; it is not a 2027 population estimate. The Knot / The Knot Worldwide.
Can a planned proposal still be a surprise?
Yes. The Knot separately reported 85% planned and 81% surprise. Planning by one partner and surprise for the other can coexist, but the report does not publish their individual overlap. The Knot / The Knot Worldwide.
How many couples discuss proposal preferences?
The Knot reported 51% discussing preferences beforehand. That question differs from discussing marriage in principle or selecting a ring. The Knot / The Knot Worldwide.
How much does an engagement ring cost?
The Knot listed average spending of US$4,600 in its selected US study; Easy Weddings reported A$6,842 in its Australian industry data. Different currencies, samples and cost definitions prevent a direct national ranking.
Do most people prefer private proposals?
In YouGov’s November 2024 GB all-adult question,67% preferred private,5% public,18% wanted no proposal and 9% were unsure. Preferences are not actual proposal locations. YouGov.
How many ring recipients help choose the ring?
The Knot reported 79% with some selection input. Jewelers Mutual’s 22% shared final-decision figure asks a narrower question of a different selected purchaser group; the figures should not be substituted. The Knot / The Knot Worldwide.
What percentage of marriage proposals are rejected?
A reliable overall population rejection rate was not established. The academic study deliberately selected accepted and rejected online stories, so its sample split cannot answer that question.
Does kneeling or having a ring make acceptance more likely?
The historical narrative study found associations in selected stories. It did not establish that any gesture causes acceptance or provide a real-world risk forecast. Lisa B. Hoplock and Danu Anthony Stinson / University of Victoria.
Does the three-month salary rule describe actual ring spending?
No. Finder’s 2026 survey measured opinions about that norm;69% favored spending less. It does not establish what they spent or what a specific couple should spend. Finder / Qualtrics.
Did MyLittleDesire conduct the underlying research?
No. The original organizations collected or analyzed the underlying material. MyLittleDesire checked the publications, organized the findings and added transparent comparisons and chart presentation.
Complete original sources
- [S01] The Knot / The Knot Worldwide. The Knot Real Weddings Study 2026. Published 2026-02-18.
Actual period: 2025 newlywed cohort; retrospective proposals/dating can predate 2025; additional studies fielded during 2025.
Population: The Knot/WeddingWire adult members married during 2025; some report findings also draw on ad hoc engaged/newlywed studies. Overall/core report n=10,474.
Method: Original industry report. Core respondents recruited by email from The Knot/WeddingWire membership throughout 2025. The report also incorporates ad hoc studies; selected item/subgroup bases are not specified.
Limits: Opt-in brand-member sample, not a probability sample of every US proposal. Successful newlyweds exclude many declined proposals and relationships that never married. Core n=10,474 is not established as every item’s valid base. Release dateline is February 18,2026; the current newsroom page displays April 24,2026. Wedding cohort, fieldwork and proposal-event year are different.
Supporting originals: Original supporting document 1
Checked 2026-10-30. - [S02] Jewelers Mutual. 2026 Engagement Ring Study. Published 2026-10; associated newsroom release 2026-10-08.
Actual period: May 2026 survey; rings purchased/received and engagement/marriage within preceding five years.
Population: Adults 18+ responsible for household insurance decisions, who bought/received an engagement ring within five years and were engaged or married within five years. Overall/core report n=2,000.
Method: Original insurer-commissioned online-panel self-completion survey. Eligibility and month are disclosed in the original newsroom release.
Limits: Selected insurance-decision-maker sample, not all engaged people or all couples. Question/subgroup bases, weights and precision are not provided. Resource and newsroom pages contain inconsistencies for some unused research/loss figures. The 2024 comparison sample is not fully documented here. Direct local HTML downloads returned a blocked body; the original pages and methods were read through public web extraction.
Supporting originals: Original supporting document 1
Checked 2026-10-30. - [S03] Ernest Jones. It’s Your Time Too: how does Britain really feel about equal engagements. Published 2026; exact publication date not displayed.
Actual period: 2026 survey; precise field dates not disclosed.
Population: UK adults. Overall/core report n=2,000.
Method: Original retailer survey of 2,000 UK adults. Seven attitude statements and a detailed demographic breakdown are published.
Limits: Recruitment, survey vendor, weights, field dates, full response options and subgroup bases are not disclosed. Promotional context is an engagement-watch launch. Responses express attitudes, not observed proposal conduct. No significance tests are supplied. City and birth-month storytelling is excluded.
Checked 2026-10-30. - [S04] Chime / Talker Research. The Rise of the Goal-Setting Engagement. Published 2026-03-20.
Actual period: 2026 publication; precise field dates not disclosed on issuer page.
Population: US adults in serious relationships, engaged or married. Overall/core report n=2,000.
Method: Original commissioning organization’s report on a Talker Research survey. Total n and relationship eligibility are disclosed.
Limits: Not all US adults. The issuer page does not publish recruitment, weighting, complete questionnaire, field dates or generation/item bases. Stated preferences are not completed purchases or proof of social-media causation. Ring-cost recall is not used because its eligible base is unclear.
Checked 2026-10-30. - [S05] Lisa B. Hoplock and Danu Anthony Stinson / University of Victoria. Rules of engagement: A content analysis of accepted and rejected marriage proposals. Published 2021-07-29.
Actual period: Accounts posted April 2006–January 2015; sampled January 7–February 12 and May 6–7,2015; proposal events can predate posts.
Population: Selected first-person written accounts of men proposing to women. Overall/core report n=374.
Method: Original author-hosted manuscript of a peer-reviewed study (online 2021, journal issue 2022). Researchers deliberately sought 200 accepted and 200 rejected accounts, then excluded female/mutual proposals for the final 374-account analysis. Trained coders; item-specific valid bases reported.
Limits: Outcome-balanced search selection prevents estimating the real-world rejection rate. Old self-selected internet narratives, missing item information, gender/relationship restrictions and uncertain verification limit generalization. Accounts are not a nationally representative US/Canadian sample. Associations are not evidence that a ring, kneeling or privacy causes acceptance.
Supporting originals: Original supporting document 1; Original supporting document 2; Original supporting document 3
Checked 2026-10-30. - [S06] Easy Weddings. 2026 Australian Wedding Industry Report. Published 2026-02; exact date not printed.
Actual period: 2026 report; mixed engaged/recently married sample; proposal-date display covers 2024–2025; precise field dates undisclosed.
Population: Engaged and recently married couples in the industry survey. Exact selected item n not published.
Method: Original industry report combining more than 4,200 engaged/recently married couples,540 wedding businesses, marketplace data and Instagram-community input.
Limits: Source contributions and valid bases are not allocated to each selected panel. More than 4,200 is not an exact item n, and 68,000 Instagram followers are not additional survey respondents. Planned versus actual costs and ring-purchase dates are not fully separated. Not an official national proposal census.
Checked 2026-10-30. - [S07] Finder / Qualtrics. The price of proposing: Australians slam outdated engagement ring rule. Published 2026-10-15.
Actual period: August 2026.
Population: Australian respondents; release does not state the age cutoff. Overall/core report n=1,006.
Method: Original Finder Consumer Sentiment Tracker release. Qualtrics operates the survey; the selected wave and n are given.
Limits: Release’s broader 60,000+ historical tracker count is not this wave’s sample. Recruitment, exact dates, weights and uncertainty are not fully disclosed. These are views on a salary-spending norm, not actual ring expenditure or a financial recommendation.
Checked 2026-10-30. - [S08] YouGov. Would you prefer a public or a private marriage proposal?. Published 2024-11-22.
Actual period: 2024-11-22.
Population: GB adults. Overall/core report n=4,216.
Method: Original YouGov Daily Question with field date, adult base and complete overall response distribution.
Limits: Great Britain is not the full United Kingdom. Opt-in polling; item-specific weighting/precision not disclosed on the question page. Preferences are not actual proposal experiences. Rounded answers sum to 99%; do not redistribute the missing point.
Checked 2026-10-30. - [S09] YouGov. The YouGov Big Survey on Weddings: original results. Published 2026-08-27.
Actual period: 2026-08-07 to 2026-08-09.
Population: UK adults 18+; marriage-intention items restricted to the source’s previously/never-married base. Overall/core report n=1,784.
Method: Original online-panel survey and full cross-tab PDF. The tables separately publish unweighted respondent counts and weighted bases, including Northern Ireland. Article/index dates and sample match the original report.
Limits: Attitudes, not real proposal acceptance or current engagements. Keep weighted estimates distinct from unweighted sample counts. Marriage-intention responses include people without a current partner and do not identify an intention to propose soon.
Supporting originals: Original supporting document 1; Original supporting document 2
Checked 2026-10-30.
How to cite this resource
MyLittleDesire. Engagement Proposal Statistics 2027: Planning, Rings, Preferences and Traditions. https://mylittledesire.com/engagement-proposal-statistics/.