Online safety research measures many different things: unwanted contact, exposure to content, privacy knowledge, family conversations and the steps young people take when something goes wrong. This resource keeps those measures separate while making useful comparisons easier to find. It includes teen-only studies and clearly labeled broader child and parent research from the US, UK, Canada and Australia.
What should an online safety statistic specify?
Check the outcome, eligible age group, respondent, recall period and denominator before quoting a percentage.
| Term | Definition | Interpretation |
|---|---|---|
| Teen-only versus child samples | Teen-only estimates here generally cover 13–17. Other sources include ages 9–17, 10–17, 11–17 or 10–15. | Read the exact age and population in each finding; broader child results are not relabeled teen-only. |
| Exposure, contact and victimization | Seeing content, receiving a request and being personally depicted or targeted are separate outcomes. | A broad online-content exposure rate is not a deepfake-victimization rate. |
| Recall period | Previous four weeks, previous 12 months and ever are different observation windows. | A lifetime figure cannot be treated as an annual rate or compared as a new survey wave. |
| Perceived risk or benefit | A respondent’s worry, confidence, perceived help or perceived harm. | Not necessarily logged behavior, tested skill, clinical diagnosis or causation. |
| Conditional base | Only people eligible for a follow-up, such as exposed teens, technology users or privacy-discussing parents. | Keep the condition with the percentage. Overall study n is not automatically the valid item/subgroup n. |
| Multiple responses | The same person can select several sources, experiences or actions. | Do not sum the margins into unique people or infer who selected both. |
| Parent–child comparison | Can mean aggregate group margins or genuinely matched responses. | Only the specified eSafety technology table uses the child’s report as a matched user reference. Even that is not device verification. |
| Sampling and uncertainty | Some studies use probability recruitment; others use opt-in panels with quotas and weights. | Demographic balance or a published conventional margin does not convert an opt-in panel into a probability sample. |
ALSO READ:-
Family Structure Statistics 2027
Shared Meals And Social Connection Statistics 2027
Grandparent Grandchild Relationship Statistics 2027
Singles And Singlehood Statistics 2027
Parent Adult Child Relationship Statistics 2027
Which comparisons can a writer safely make?
| Comparison | What is matched or different | Appropriate interpretation | Original source |
|---|---|---|---|
| US online/offline pilot | Same study, ages, recall window and full-sample base | Compare margins descriptively; retain SE; do not sum contexts or invent a paired test. | S01 / Table 2 |
| Australian lifetime / past-year | Same outcome and survey, different recall windows | Show age patterns side by side; a window difference is not a time trend. | S05 / age chart |
| Australian parent awareness | Matched to child-reported users of each technology | Retain different user bases and the separate don’t-know option. | S06 / Table 10 |
| Canadian privacy topics | Same conditional discussers, n=252 | Compare topic mentions; do not generalize to all parents or tested knowledge. | S07 / Figure 38 |
| CSM 44% exposure and 24% known-person imagery | The second uses only exposed teens | Keep both denominators visible; neither equals personal deepfake victimization. | S10 / Figures D and F |
Key teen online safety findings
13.4% / 2.0%
16.4% / 18.5%
Reported unwanted sexual images online / offline in the same four-week measure.
Reported direct harassment online / offline.
64%
89%
Received unfamiliar friend/follow requests at least weekly.
Had received information about staying safe online.
19%
25% / 16%
Received sexual messages from an adult, among sexual-message recipients.
Experienced measured tracking, monitoring or harassment ever / in the past year.
16%
68% / 28%
Of parents of child-reported AI users were unaware of that use.
Discussed scams / deepfakes among privacy-discussing parents.
63%
87% / 46%
Believed a privacy policy meant a site would not share their information.
Used online safety tools / sought offline support after an online sexual interaction.
44%
24%
Had seen sexual content they believed was AI-generated.
Had seen believed-AI content depicting self or a known person, among exposed teens.
Are the same risks reported online and offline?
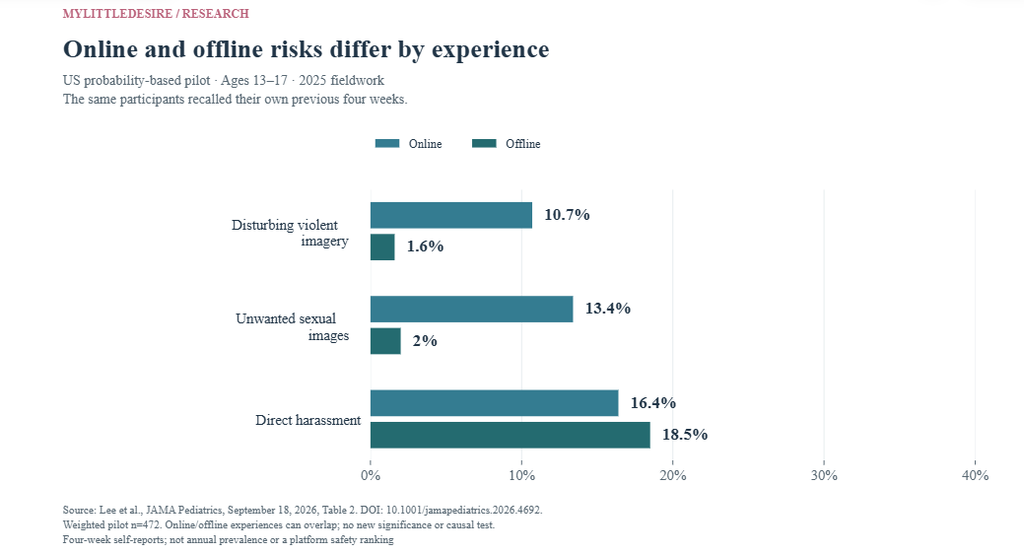
The answer depends on the experience. A 2025 US teen pilot found more unwanted sexual images and disturbing violent imagery online, while direct harassment was reported at similar levels in both settings. All these items use each respondent’s previous four weeks, which makes the descriptive comparison more useful than mixing annual and lifetime figures.
| ID | Finding and qualification | Population, actual period and base | Original source and locator |
|---|---|---|---|
| F01 | 10.7% reported disturbing violent imagery online and 1.6% offline during the previous four weeks. Definition: Saw violent, bloody or disturbing images that bothered the respondent. Qualification: Small weighted exploratory pilot; overlapping contexts. Difference is descriptive, with no new significance or causal claim. | US adolescents 13–17 in the UAS pilot United States February–December 2025; preceding four weeks Published eligible item/group base(s): 472. An overall report n is not a subgroup base. | Stanford University and collaborating institutions / JAMA Pediatrics Published 2026-09-18 Table 2, full-sample Online and Offline columns; corresponding question row |
| F02 | 13.4% reported unwanted sexual images online and 2% offline during the previous four weeks. Definition: Saw nudity or sexual images the respondent did not want to see. Qualification: Small weighted exploratory pilot; overlapping contexts. Difference is descriptive, with no new significance or causal claim. | US adolescents 13–17 in the UAS pilot United States February–December 2025; preceding four weeks Published eligible item/group base(s): 472. An overall report n is not a subgroup base. | Stanford University and collaborating institutions / JAMA Pediatrics Published 2026-09-18 Table 2, full-sample Online and Offline columns; corresponding question row |
| F03 | 16.4% reported direct harassment online and 18.5% offline during the previous four weeks. Definition: Insult, disrespect, inappropriate contact, damaged reputation, threats or exclusion. Qualification: Small weighted exploratory pilot; overlapping contexts. Difference is descriptive, with no new significance or causal claim. | US adolescents 13–17 in the UAS pilot United States February–December 2025; preceding four weeks Published eligible item/group base(s): 472. An overall report n is not a subgroup base. | Stanford University and collaborating institutions / JAMA Pediatrics Published 2026-09-18 Table 2, full-sample Online and Offline columns; corresponding question row |
| F04 | 28.9% reported witnessing harassment of others online and 26.1% offline during the previous four weeks. Definition: Witnessed the listed harassment behaviors directed at someone else. Qualification: Small weighted exploratory pilot; overlapping contexts. Difference is descriptive, with no new significance or causal claim. | US adolescents 13–17 in the UAS pilot United States February–December 2025; preceding four weeks Published eligible item/group base(s): 472. An overall report n is not a subgroup base. | Stanford University and collaborating institutions / JAMA Pediatrics Published 2026-09-18 Table 2, full-sample Online and Offline columns; corresponding question row |
| F05 | 16.5% reported unwanted conversations online and 12.8% offline during the previous four weeks. Definition: Got involved in a conversation the respondent did not want. Qualification: Small weighted exploratory pilot; overlapping contexts. Difference is descriptive, with no new significance or causal claim. | US adolescents 13–17 in the UAS pilot United States February–December 2025; preceding four weeks Published eligible item/group base(s): 472. An overall report n is not a subgroup base. | Stanford University and collaborating institutions / JAMA Pediatrics Published 2026-09-18 Table 2, full-sample Online and Offline columns; corresponding question row |
| F06 | 36.7% reported witnessed identity-based discrimination online and 19.3% offline during the previous four weeks. Definition: Saw discrimination based on gender, religion, race, sexual orientation or another identity characteristic. Qualification: Small weighted exploratory pilot; overlapping contexts. Difference is descriptive, with no new significance or causal claim. | US adolescents 13–17 in the UAS pilot United States February–December 2025; preceding four weeks Published eligible item/group base(s): 472. An overall report n is not a subgroup base. | Stanford University and collaborating institutions / JAMA Pediatrics Published 2026-09-18 Table 2, full-sample Online and Offline columns; corresponding question row |
| F07 | 51.5% said technology sometimes or often interfered with their sleep. Definition: Self-reported technology-related sleep interference; Table 2 Overall column. Qualification: Not a clinical sleep diagnosis or evidence that a specific platform caused sleep disruption. | US adolescents 13–17 in the UAS pilot United States February–December 2025; preceding four weeks Published eligible item/group base(s): 472. An overall report n is not a subgroup base. | Stanford University and collaborating institutions / JAMA Pediatrics Published 2026-09-18 Table 2, final sleep row, Overall column |
| F08 | 91.5% owned a personal smartphone; 26.9% reported parental controls managing smartphone use in the full-sample table. Definition: Table 1 full sample, separate ownership and control questions. Qualification: The control figure is not relabeled as a smartphone-owner-only rate or a measured protection effect. | US adolescents 13–17 in the UAS pilot United States 2025 survey; current device/controls questions Published eligible item/group base(s): 472. An overall report n is not a subgroup base. | Stanford University and collaborating institutions / JAMA Pediatrics Published 2026-09-18 Table 1, Smartphone ownership and Parents use parental controls rows |
What do teens and parents report about social platforms?
Platform users report a mix of benefits and problems. Pew found that 44% of Snapchat teen users felt it helped friendships, while narrower harassment measures were reported by minorities of users across the three sites. Parent and teen time-use views also differ, but their group margins cannot identify which individual families disagree.
| ID | Finding and qualification | Population, actual period and base | Original source and locator |
|---|---|---|---|
| F09 | 27% of Snapchat users, 19% of Instagram users and 18% of TikTok users had experienced at least one of three measured harassment types. Definition: Ever experienced offensive name-calling, a false rumor or a physical threat on the named platform. Qualification: Different platform user groups can overlap; the percentages do not identify a causal platform effect. This narrower measure is not a rate of all online harms. | US users aged 13–17 living with parents; each platform’s users only United States 2025-09-25 to 2025-10-09 Published eligible item/group base(s): 772, 908, 996. An overall report n is not a subgroup base. | Pew Research Center Published 2026-04-15 Report printed p.9, harassment chart; topline TSNSBULL, each platform |
| F10 | 57% of Snapchat users messaged people directly daily, versus 34% on Instagram and 24% on TikTok. Definition: Several times a day or about once a day; published daily NET. Qualification: Different platform user groups can overlap; the percentages do not identify a causal platform effect. Messaging frequency does not measure unsafe contact. | US users aged 13–17 living with parents; each platform’s users only United States 2025-09-25 to 2025-10-09 Published eligible item/group base(s): 772, 908, 996. An overall report n is not a subgroup base. | Pew Research Center Published 2026-04-15 Report printed p.5; daily direct-messaging chart / topline platform messaging |
| F11 | 28% of TikTok users felt they spent too much time there; the figures were 19% for Instagram and 19% for Snapchat. Definition: Self-assessment of amount of time on each platform. Qualification: Different platform user groups can overlap; the percentages do not identify a causal platform effect. Not objectively logged duration or a diagnosis. | US users aged 13–17 living with parents; each platform’s users only United States 2025-09-25 to 2025-10-09 Published eligible item/group base(s): 772, 908, 996. An overall report n is not a subgroup base. | Pew Research Center Published 2026-04-15 Report printed p.6, screen-time chart |
| F12 | 37% of TikTok users said it hurt their sleep, compared with 26% on Snapchat and 24% on Instagram. Definition: Hurt a lot or a little in the amount-of-sleep item. Qualification: Different platform user groups can overlap; the percentages do not identify a causal platform effect. A perceived effect, not a causal or clinical estimate. | US users aged 13–17 living with parents; each platform’s users only United States 2025-09-25 to 2025-10-09 Published eligible item/group base(s): 772, 908, 996. An overall report n is not a subgroup base. | Pew Research Center Published 2026-04-15 Report printed p.7, Amount of sleep hurt column |
| F13 | 44% of Snapchat users said it helped their friendships, versus 36% on Instagram and 24% on TikTok. Definition: Helped a lot or a little in the friendship-impact item. Qualification: Different platform user groups can overlap; the percentages do not identify a causal platform effect. This is perceived benefit and does not mean the remaining users were harmed. | US users aged 13–17 living with parents; each platform’s users only United States 2025-09-25 to 2025-10-09 Published eligible item/group base(s): 772, 908, 996. An overall report n is not a subgroup base. | Pew Research Center Published 2026-04-15 Report printed p.7, Friendships helped column |
| F14 | 24% of parents said social media hurt their teen’s mental health, while 8% said it helped. Definition: Broad social-media impact; hurt/help a lot or a little. Qualification: All parents were asked; not all are parents of social-media users. Perceptions are not clinical outcomes or teen self-reports. | US parents of teens 13–17 United States 2025-09-25 to 2025-10-09 Published eligible item/group base(s): 1,458. An overall report n is not a subgroup base. | Pew Research Center Published 2026-04-15 Parent chapter, Parents’ views of social media’s impact; topline PSMIMPACT |
| F15 | 44% of parents whose teen used TikTok thought the teen spent too much time there, compared with 28% of teen TikTok users themselves. Definition: Separate weighted respondent-group margins about time on TikTok. Qualification: Parent and teen user bases differ (962 and 996); this is not a 16% parent–child disagreement or deception rate. | Parent-reported TikTok-user group and teen-reported TikTok-user group United States 2025-09-25 to 2025-10-09 Published eligible item/group base(s): 962. An overall report n is not a subgroup base. | Pew Research Center Published 2026-04-15 Parent chapter, Feelings about their teen using TikTok; topline parent/teen TikTok time items |
| F16 | 85% of parents said they ever talked with their teen about using social media. Definition: Ever talked about social media; PSMTALK asked of all parents. Qualification: Does not establish conversation frequency, subject depth or effectiveness. | US parents of teens 13–17 United States 2025-09-25 to 2025-10-09 Published eligible item/group base(s): 1,458. An overall report n is not a subgroup base. | Pew Research Center Published 2026-04-15 Parent chapter, Talking with their teen; topline PSMTALK |
How do children encounter unfamiliar or unwanted contacts?
Ofcom found that 64% of communication-app users received unfamiliar friend or follow requests at least weekly. Its broader ever-contact question uses a different app-user base and includes experiences that are not necessarily illegal. Keep those two measures separate.
| ID | Finding and qualification | Population, actual period and base | Original source and locator |
|---|---|---|---|
| F17 | 79% felt confident communicating online, compared with 65% in person. Definition: Very/fairly outgoing or confident; S17. Qualification: Self-description rather than a measured skill or proof of safety. | UK children 11–17 United Kingdom 2026-02-13 to 2026-03-19 Published eligible item/group base(s): 4,097. An overall report n is not a subgroup base. | Ofcom / Savanta Published 2026-09-09 report update Research PDF physical p.15, S17 |
| F18 | 64% mainly connected with people they knew personally, 30% had a mix and 6% mainly connected with people they did not know personally. Definition: Composition of friends/followers under the question’s known-person definition. Qualification: Known and unknown contacts do not by themselves classify a relationship as safe or harmful. | UK children 11–17 using communication or connection apps/platforms United Kingdom 2026-02-13 to 2026-03-19 Published eligible item/group base(s): 3,836. An overall report n is not a subgroup base. | Ofcom / Savanta Published 2026-09-09 report update Research PDF physical p.16, A30; base 3,836 |
| F19 | 64% received friend/follow requests at least weekly from someone they had not messaged or spoken to before; 14% received them daily. Definition: Frequency of requests; daily is included in at-least-weekly. Qualification: Not all UK children, and not necessarily unwanted, adult-origin or criminal contact. | UK children 11–17 using communication or connection apps/platforms United Kingdom 2026-02-13 to 2026-03-19 Published eligible item/group base(s): 3,836. An overall report n is not a subgroup base. | Ofcom / Savanta Published 2026-09-09 report update Research PDF physical p.24, A70; base 3,836 |
| F20 | 82% were likely to reply to someone known who added them, 80% to someone they added and 34% to an unknown person who added them. Definition: Very or fairly likely to reply; A100 hypothetical scenarios. Qualification: Intentions are not observed replies or evidence that every unknown contact is dangerous. | UK children 11–17 using communication or connection apps/platforms United Kingdom 2026-02-13 to 2026-03-19 Published eligible item/group base(s): 3,836. An overall report n is not a subgroup base. | Ofcom / Savanta Published 2026-09-09 report update Research PDF physical p.25, A100; base 3,836 |
| F21 | In an unprompted question, 16% mentioned not knowing the sender, 11% suspicious messages/accounts and 10% rude, dangerous or inappropriate content as considerations against replying. Definition: Coded open-ended A300 responses across all respondents. Qualification: These are unprompted mentions, not a checklist endorsement rate or only people who already refused a message. Categories may overlap. | UK children 11–17 United Kingdom 2026-02-13 to 2026-03-19 Published eligible item/group base(s): 4,097. An overall report n is not a subgroup base. | Ofcom / Savanta Published 2026-09-09 report update Research PDF physical p.27, A300; base 4,097 |
| F22 | 79% had ever experienced at least one of the ten potentially uncomfortable contact types asked about. Definition: Published ten-item ever-experience NET; B1. Qualification: Not a past-year estimate, not necessarily illegal and not equivalent to all children having experienced grooming. | UK children 11–17 using any app or platform United Kingdom 2026-02-13 to 2026-03-19 Published eligible item/group base(s): 4,065. An overall report n is not a subgroup base. | Ofcom / Savanta Published 2026-09-09 report update Research PDF physical p.31, B1; base 4,065 |
| F23 | 39% had received unwanted friend/follow requests, 32% unfamiliar group-chat additions, 25% abusive messages and 22% requests from someone impersonating another person. Definition: Ever-experience categories under B1. Qualification: Categories overlap and must not be summed into unique affected children. Brief context; detailed cyberbullying analysis belongs in the related hub. | UK children 11–17 using any app or platform United Kingdom 2026-02-13 to 2026-03-19 Published eligible item/group base(s): 4,065. An overall report n is not a subgroup base. | Ofcom / Savanta Published 2026-09-09 report update Research PDF physical p.31, B1 |
| F24 | 14% had ever been asked for nude or semi-nude images/videos; 16% had received such images/videos. Definition: B1 contact types, ever. Qualification: Self-reported contact; sender age, consent context and legality are not established by these two percentages. | UK children 11–17 using any app or platform United Kingdom 2026-02-13 to 2026-03-19 Published eligible item/group base(s): 4,065. An overall report n is not a subgroup base. | Ofcom / Savanta Published 2026-09-09 report update Research PDF physical p.31, B1 |
Where do young people receive safety information?
In England and Wales, 89% of children aged 10–15 had read or received safety information in the previous year. Among recipients, 95% obtained it from school and 62% from a parent or guardian. The sensitive-content and sexual-message modules cover only ages 13–15, rather than the full child sample.
| ID | Finding and qualification | Population, actual period and base | Original source and locator |
|---|---|---|---|
| F25 | 89% had read or received information about staying safe online in the previous 12 months. Definition: Any safety information read/received. Qualification: Broader than teens alone. Redesigned official statistics in development; no direct comparison with the former face-to-face series. | Children 10–15, England and Wales England and Wales December 2025 / March 2026 collection; ONS year ending February 2026, previous 12 months Exact item/subgroup valid n is not printed beside these selected figures. An overall report n is not a subgroup base. | Office for National Statistics Published 2026-09-02 Bulletin section 2, Online behaviour and security |
| F26 | 71% received information about blocking/reporting upsetting content, 66% about talking to people online and 60% about posting personal information. Definition: Listed safety-information topics; multiple responses. Qualification: Not successful use of the skills or the share of incidents reported. Redesigned official statistics in development; no direct comparison with the former face-to-face series. | Children 10–15, England and Wales England and Wales December 2025 / March 2026 collection; ONS year ending February 2026, previous 12 months Exact item/subgroup valid n is not printed beside these selected figures. An overall report n is not a subgroup base. | Office for National Statistics Published 2026-09-02 Bulletin section 2 / Figure 2 and accompanying text |
| F27 | Among recipients of safety information, 95% received it from school and 62% from a parent or guardian. Definition: Conditional information-source question. Qualification: Not percentages of all children; sources overlap. Redesigned official statistics in development; no direct comparison with the former face-to-face series. | Children 10–15, England and Wales, who received safety information England and Wales December 2025 / March 2026 collection; ONS year ending February 2026, previous 12 months Exact item/subgroup valid n is not printed beside these selected figures. An overall report n is not a subgroup base. | Office for National Statistics Published 2026-09-02 Bulletin section 2, paragraph following Figure 2 |
| F28 | 48% saw a lot or a fair amount of hateful content, 19% eating-disorder content, 15% sexual images/videos and 12% content showing or encouraging self-harm. Definition: A lot/fair amount, not any exposure; sensitive module only 13–15. Qualification: Content types overlap. Avoid comparison with a four-week or ever-exposure question. Redesigned official statistics in development; no direct comparison with the former face-to-face series. | Online-going children 13–15, England and Wales England and Wales December 2025 / March 2026 collection; ONS year ending February 2026, previous 12 months Exact item/subgroup valid n is not printed beside these selected figures. An overall report n is not a subgroup base. | Office for National Statistics Published 2026-09-02 Bulletin section 3, Exposure to harmful content / Figure 3 note |
| F29 | 12% received at least one sexual message; the figures were 13% for girls and 10% for boys, and 7%, 13% and 16% at ages 13, 14 and 15. Definition: At least one sexual message in the preceding 12 months. Qualification: This question does not itself mean every message was unwanted or from an adult. Overall n=6,031 is not the module base. Redesigned official statistics in development; no direct comparison with the former face-to-face series. | Children 13–15, England and Wales England and Wales December 2025 / March 2026 collection; ONS year ending February 2026, previous 12 months Exact item/subgroup valid n is not printed beside these selected figures. An overall report n is not a subgroup base. | Office for National Statistics Published 2026-09-02 Bulletin section 3, Sending and receiving sexual messages |
| F30 | Among recipients, 71% received messages from someone about their age, 24% from someone a few years older but under 18 and 19% from an adult. Definition: Conditional sender-age groups; multiple sources can be named. Qualification: 19% is not the percentage of all 13–15-year-olds receiving adult messages. Do not sum overlapping sender groups. Redesigned official statistics in development; no direct comparison with the former face-to-face series. | Children 13–15, England and Wales, who received sexual messages England and Wales December 2025 / March 2026 collection; ONS year ending February 2026, previous 12 months Exact item/subgroup valid n is not printed beside these selected figures. An overall report n is not a subgroup base. | Office for National Statistics Published 2026-09-02 Bulletin section 3, Figure 4 and sender-age paragraphs |
How does the recall period change a tracking or harassment statistic?
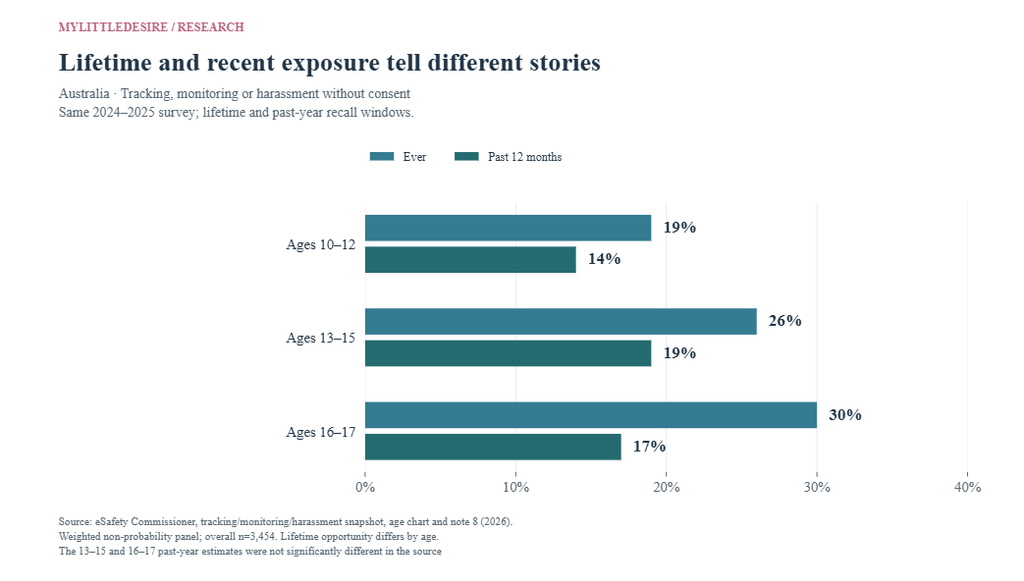
In the Australian survey, lifetime non-consensual tracking, monitoring or harassment rose across the three age groups, but the past-year figures did not show the same steady pattern. The two older age groups’ past-year estimates were not significantly different in the source. These are separate ages observed at one time, not a trend in the same children.
| ID | Finding and qualification | Population, actual period and base | Original source and locator |
|---|---|---|---|
| F31 | 25% had ever experienced non-consensual tracking, monitoring or harassment; 16% had experienced it in the past 12 months. Definition: Combined measured experience types, with exclusions for comfortable protective caregiver checks. Qualification: Weighted non-probability panel, not a probability sample. Lifetime and past-year values are different recall windows, not consecutive survey waves. | Australian children 10–17 Australia December 2024–February 2025 Published eligible item/group base(s): 3,454. An overall report n is not a subgroup base. | eSafety Commissioner Published Page last updated 2026-09-21; first-publication day not established Snapshot, A significant minority; notes 2–3 |
| F32 | Lifetime prevalence was 19% at ages 10–12, 26% at 13–15 and 30% at 16–17; past-year prevalence was 14%, 19% and 17%, respectively. Definition: Same outcome, age groups and recall windows in the published age chart. Qualification: Weighted non-probability panel, not a probability sample. Lifetime and past-year values are different recall windows, not consecutive survey waves. The past-year 13–15 and 16–17 estimates were not significantly different in the source. | Australian children 10–17 in the specified age groups Australia December 2024–February 2025 Exact item/subgroup valid n is not printed beside these selected figures. An overall report n is not a subgroup base. | eSafety Commissioner Published Page last updated 2026-09-21; first-publication day not established Snapshot age-chart alternative text; note 8 |
| F33 | 17% had their device/messages checked without permission, 12% experienced persistent frightening unwanted contact and 8% had live location tracked without permission; past-year figures were 11%, 6% and 4%. Definition: Persistent contact requires at least two weeks and ten attempts; comfortable protective caregiver checks excluded. Qualification: Weighted non-probability panel, not a probability sample. Lifetime and past-year values are different recall windows, not consecutive survey waves. Forms overlap and do not all imply stranger contact. | Australian children 10–17 Australia December 2024–February 2025 Published eligible item/group base(s): 3,454. An overall report n is not a subgroup base. | eSafety Commissioner Published Page last updated 2026-09-21; first-publication day not established Snapshot experience-type section; notes 9–11 |
| F34 | 77% said the most recent selected experience involved someone known in real life; 13% named someone they did not already know in real life. Definition: One selected most-recent type of experience per respondent; multiple answers possible. Qualification: Not all children, all affected children, or all incidents. Do not treat these margins as an exhaustive offender distribution. | Australian 10–17-year-olds in the recent-experience follow-up, n=429 Australia December 2024–February 2025 Published eligible item/group base(s): 429. An overall report n is not a subgroup base. | eSafety Commissioner Published Page last updated 2026-09-21; first-publication day not established Snapshot known-person section; notes 12–13 |
| F35 | 70% felt at least one negative emotion after the selected recent experience, including 43% annoyed/angry, 22% sad/hurt and 17% embarrassed/shamed. Definition: Self-reported responses to the selected event; multiple emotions. Qualification: Not diagnosed mental illness or a measured causal treatment effect. Conditional group, not all children. | Australian recent-experience follow-up respondents 10–17, n=429 Australia December 2024–February 2025 Published eligible item/group base(s): 429. An overall report n is not a subgroup base. | eSafety Commissioner Published Page last updated 2026-09-21; first-publication day not established Snapshot negative-emotions section; notes 12 and 19 |
| F36 | 44% reported at least one difficulty after the selected event; 16% reported arguments or reduced time with family/friends, 14% more worry/sadness and 10% concentration difficulties. Definition: Self-reported difficulties after a selected most-recent experience. Qualification: Multiple responses and retrospective attribution; not all children or a causal clinical result. | Australian recent-experience follow-up respondents 10–17, n=429 Australia December 2024–February 2025 Published eligible item/group base(s): 429. An overall report n is not a subgroup base. | eSafety Commissioner Published Page last updated 2026-09-21; first-publication day not established Snapshot difficulties section and chart alternative text; notes 12 and 20 |
How aware are parents of children’s technology use?
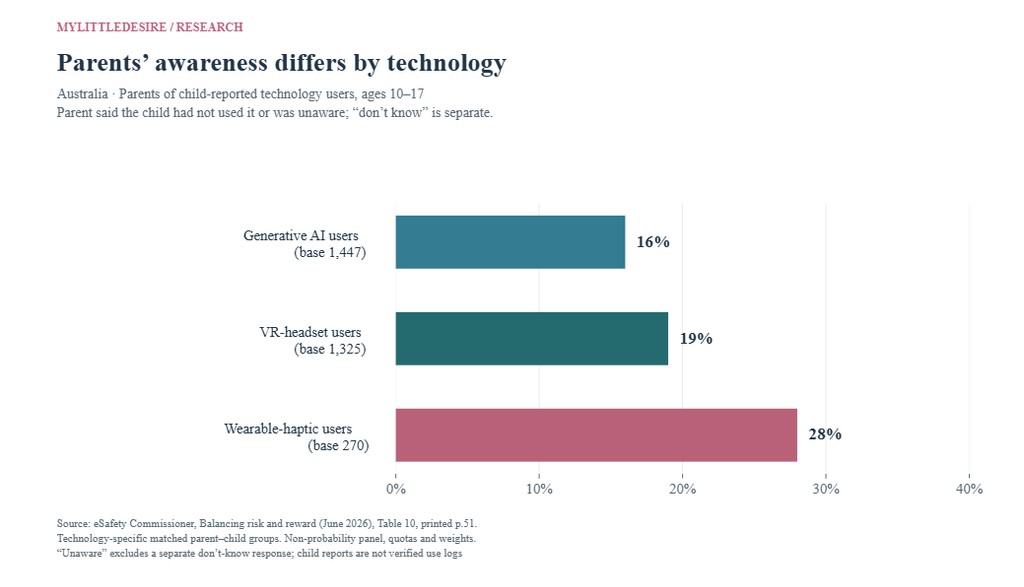
The Australian matched parent–child survey found different levels of parent unawareness across child-reported technology-user groups. This is more specific than asking whether parents feel informed. The comparison uses child reports as its reference and does not verify device logs.
| ID | Finding and qualification | Population, actual period and base | Original source and locator |
|---|---|---|---|
| F37 | 83% felt they could talk openly with their child about online challenges; 26% felt they did not really know what their child did online. Definition: Parent agreement with separate statements. Qualification: The views can overlap; the two margins do not identify individual mismatch. Same non-probability parent–child survey as S05; not independent replication. | Parents/caregivers of Australian children 10–17 Australia December 2024–February 2025 Exact item/subgroup valid n is not printed beside these selected figures. An overall report n is not a subgroup base. | eSafety Commissioner Published June 2026 report; webpage last updated 2026-06-17 PDF physical p.6 / printed pp.10–11 key findings; parental-awareness section |
| F38 | 92% had at least one online rule, 68% monitored online activities and 29% did not use parental controls. Definition: Restrictive, passive and technical mediation are separate measures. Qualification: Strategies can overlap; use is not demonstrated effectiveness. Same non-probability parent–child survey as S05; not independent replication. | Parents/caregivers of Australian children 10–17 Australia December 2024–February 2025 Exact item/subgroup valid n is not printed beside these selected figures. An overall report n is not a subgroup base. | eSafety Commissioner Published June 2026 report; webpage last updated 2026-06-17 PDF physical pp.6–7 key findings; printed pp.60–67, Figures 13–15 |
| F39 | 58% found helping their child stay safe online challenging; 46% felt confident the child could look after themselves online. Definition: Agreement with separate safety-confidence statements. Qualification: A parent can hold both views. Not a measure that children are actually safe. Same non-probability parent–child survey as S05; not independent replication. | Parents/caregivers of Australian children 10–17 Australia December 2024–February 2025 Published eligible item/group base(s): 3,454. An overall report n is not a subgroup base. | eSafety Commissioner Published June 2026 report; webpage last updated 2026-06-17 PDF physical p.30 / printed pp.58–59, Figure 12 |
| F40 | Among parents whose child reported each technology’s use, 16% were unaware of generative-AI use, 19% of VR-headset use and 28% of wearable-haptic use. Definition: Parent said the child had not used it or was unaware; separate don’t-know category excluded. Qualification: Different, overlapping technology-user groups (1,447 / 1,325 / 270). Child self-report is the reference, not verified device logs. Same non-probability parent–child survey as S05; not independent replication. | Parents/caregivers of Australian children 10–17 restricted separately to child-reported technology users Australia December 2024–February 2025 Published eligible item/group base(s): 270, 1,325, 1,447. An overall report n is not a subgroup base. | eSafety Commissioner Published June 2026 report; webpage last updated 2026-06-17 PDF physical p.26 / printed p.51, Table 10 |
| F41 | Among child-reported AI users, parent unawareness was 21% at ages 10–12, 16% at 13–15 and 11% at 16–17. Definition: Same unaware category in Table 11; age-specific user bases 403, 619 and 425. Qualification: Not all parents in those age groups or proof of deliberate concealment. Same non-probability parent–child survey as S05; not independent replication. | Parents/caregivers of Australian children 10–17 of child-reported generative-AI users in each age group Australia December 2024–February 2025 Published eligible item/group base(s): 403, 425, 619. An overall report n is not a subgroup base. | eSafety Commissioner Published June 2026 report; webpage last updated 2026-06-17 PDF physical p.26 / printed p.50, Table 11 |
| F42 | 35% of parents identified emotional benefits of online activity for their child, compared with 50% of children themselves. Definition: Published aggregate parent/child emotional-benefit comparison. Qualification: Different respondent perspectives; the 15-point gap is not the proportion of parents unaware of a benefit or a clinical wellbeing effect. Same non-probability parent–child survey as S05; not independent replication. | Parents/caregivers of Australian children 10–17 and child reports aged 10–17 Australia December 2024–February 2025 Exact item/subgroup valid n is not printed beside these selected figures. An overall report n is not a subgroup base. | eSafety Commissioner Published June 2026 report; webpage last updated 2026-06-17 PDF physical p.6 / printed p.11, emotional-benefit key finding |
Which privacy topics do families discuss?
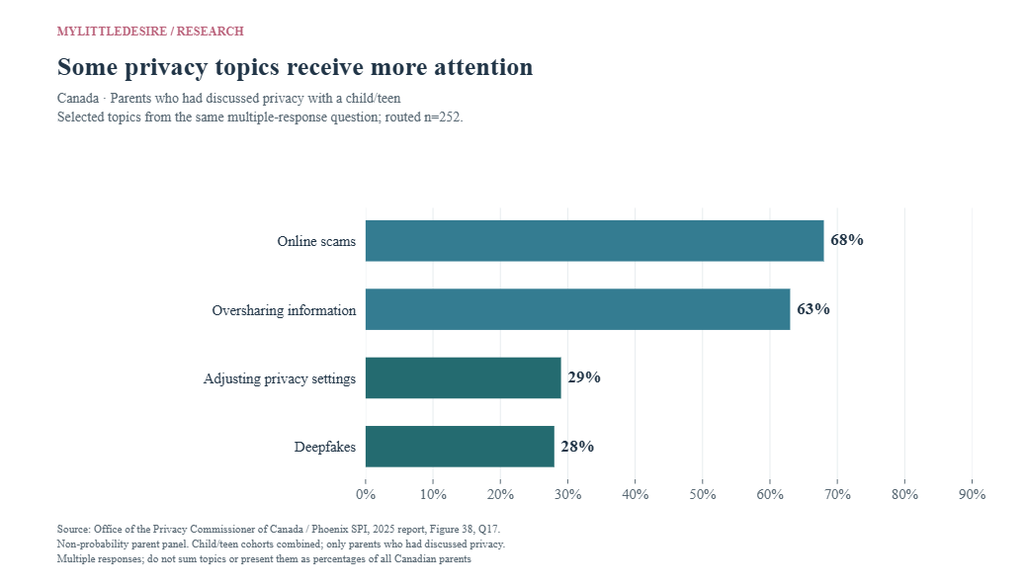
Among Canadian parents who had discussed privacy with a child or teen, 68% covered scams and 28% covered deepfakes. Those figures use the same routed base of 252 privacy discussers. They describe conversation topics rather than all parents or tested child knowledge.
| ID | Finding and qualification | Population, actual period and base | Original source and locator |
|---|---|---|---|
| F43 | 79% of parents assessing their teen and 55% assessing their child believed they were at least moderately aware of personal-information-sharing risks. Definition: Moderately, very or extremely aware in parent perception. Qualification: Not tested privacy knowledge. Canadian non-probability parent survey, not a youth self-report. Different assigned child/teen cohorts; exact age-cell valid n not supplied. | Canadian parents assigned teen 13–17 or child 6–12 cohort Canada 2025-02-25 to 2025-02-28 Exact item/subgroup valid n is not printed beside these selected figures. An overall report n is not a subgroup base. | Office of the Privacy Commissioner of Canada / Phoenix SPI Published March 2025 final report; page modified 2025-05-08 Figure 31, Q9; surrounding narrative |
| F44 | 84% of parents assessing a teen and 92% assessing a child felt very or extremely responsible for safe online decisions. Definition: Very/extremely responsible, Q11. Qualification: Not a direct observation of supervision or actual risk. Canadian non-probability parent survey, not a youth self-report. Different assigned child/teen cohorts; exact age-cell valid n not supplied. | Canadian assigned teen 13–17 / child 6–12 parent cohorts Canada 2025-02-25 to 2025-02-28 Exact item/subgroup valid n is not printed beside these selected figures. An overall report n is not a subgroup base. | Office of the Privacy Commissioner of Canada / Phoenix SPI Published March 2025 final report; page modified 2025-05-08 Figure 33, Q11 |
| F45 | 92% reported ever discussing personal-information protection with their teen, versus 75% with their child. Definition: Ever had the discussion, Q14. Qualification: Not a within-family age progression or proof that conversations prevented harm. Canadian non-probability parent survey, not a youth self-report. Different assigned child/teen cohorts; exact age-cell valid n not supplied. | Canadian assigned teen 13–17 / child 6–12 parent cohorts Canada 2025-02-25 to 2025-02-28 Exact item/subgroup valid n is not printed beside these selected figures. An overall report n is not a subgroup base. | Office of the Privacy Commissioner of Canada / Phoenix SPI Published March 2025 final report; page modified 2025-05-08 Figure 35, Q14 |
| F46 | Among privacy discussers, 65% assessing a teen and 68% assessing a child felt very or extremely capable of these conversations. Definition: Very/extremely capable, conditional Q15. Qualification: Do not relabel as all parents or substitute total n=302 into the age subgroups. Canadian non-probability parent survey, not a youth self-report. Different assigned child/teen cohorts; exact age-cell valid n not supplied. | Canadian privacy-discussing parents; overall routed n=252, age-specific n unavailable Canada 2025-02-25 to 2025-02-28 Exact item/subgroup valid n is not printed beside these selected figures. An overall report n is not a subgroup base. | Office of the Privacy Commissioner of Canada / Phoenix SPI Published March 2025 final report; page modified 2025-05-08 Figure 36, Q15; base parents who discussed protection |
| F47 | Among privacy discussers, 13% talked at least weekly, 45% monthly, 33% two or three times a year and 9% once a year or less. Definition: Published mutually exclusive frequency response categories, Q16. Qualification: Conditional on ever discussing privacy. The age-specific frequency narrative has an inconsistent age label and is not used. | Canadian parents who discussed privacy, n=252 Canada 2025-02-25 to 2025-02-28 Published eligible item/group base(s): 252. An overall report n is not a subgroup base. | Office of the Privacy Commissioner of Canada / Phoenix SPI Published March 2025 final report; page modified 2025-05-08 Figure 37, Q16; base n=252 |
| F48 | Among privacy discussers, 68% covered scams, 63% oversharing, 29% adjusting privacy settings and 28% deepfakes. Definition: Selected topics from multiple-response Q17. Qualification: Topics overlap; these are not all parents or a measure of the child’s comprehension. | Canadian parents who discussed privacy, n=252 Canada 2025-02-25 to 2025-02-28 Published eligible item/group base(s): 252. An overall report n is not a subgroup base. | Office of the Privacy Commissioner of Canada / Phoenix SPI Published March 2025 final report; page modified 2025-05-08 Figure 38, Q17; base n=252 |
What does earlier Canadian research show about privacy understanding?
The historical 2021 MediaSmarts survey found that 63% believed a privacy policy meant a website would not share their personal information. The researchers identified that belief as mistaken. These findings remain useful for understanding measurement and literacy, with their original year and ages clearly attached.
| ID | Finding and qualification | Population, actual period and base | Original source and locator |
|---|---|---|---|
| F49 | 82% said they did not share information such as their home address, phone number or full birthday anywhere online. Definition: Self-reported sharing of listed personal identifiers. Qualification: Does not mean they shared no personal data or faced no privacy risk. Historical school/GenPop survey, not a current 2027 estimate. Grades 4–11 cover ages 9–17, not teens only. | Canadian survey participants in grades 4–11, ages 9–17 Canada 2021; precise starting month inconsistent across original report/page Exact item/subgroup valid n is not printed beside these selected figures. An overall report n is not a subgroup base. | MediaSmarts Published January 2023 report; exact publication day not established Report printed p.12 / PDF physical p.13, Protecting information |
| F50 | 48% had never read a privacy policy or terms of service; 27% had read one alone and 25% with a parent or guardian. Definition: Ever read policy/terms; multiple assistance options. Qualification: Reading does not establish comprehension; categories are not an exhaustive exclusive distribution. Historical school/GenPop survey, not a current 2027 estimate. Grades 4–11 cover ages 9–17, not teens only. | Canadian survey participants in grades 4–11, ages 9–17 Canada 2021; precise starting month inconsistent across original report/page Exact item/subgroup valid n is not printed beside these selected figures. An overall report n is not a subgroup base. | MediaSmarts Published January 2023 report; exact publication day not established Report printed pp.17–18 / physical pp.18–19, Figure 4 |
| F51 | 63% believed that the presence of a privacy policy meant a website would not share their personal information. Definition: The researchers identify this as a mistaken privacy-policy belief. Qualification: A policy can describe data sharing; this is an understanding question, not the share of sites that share data. Historical school/GenPop survey, not a current 2027 estimate. Grades 4–11 cover ages 9–17, not teens only. | Canadian survey participants in grades 4–11, ages 9–17 Canada 2021; precise starting month inconsistent across original report/page Exact item/subgroup valid n is not printed beside these selected figures. An overall report n is not a subgroup base. | MediaSmarts Published January 2023 report; exact publication day not established Report printed p.18 / physical p.19, text following Figure 4 |
| F52 | 52% used privacy settings; the figures were 56% in the older 12–17 group and 46% in the younger 9–11 group. Definition: Use of settings when engaging in online spaces under the report’s question. Qualification: Age-group total n=659/399 is not substituted for an unprinted valid item base. Historical school/GenPop survey, not a current 2027 estimate. Grades 4–11 cover ages 9–17, not teens only. | Canadian grade 4–11 participants; older/younger age groups as stated Canada 2021; precise starting month inconsistent across original report/page Exact item/subgroup valid n is not printed beside these selected figures. An overall report n is not a subgroup base. | MediaSmarts Published January 2023 report; exact publication day not established Report printed p.19 / physical p.20, Figure 5 and narrative |
How do young people respond to online risks?
Thorn’s 2025 survey found that online tools and offline support were overlapping response routes among minors reporting an online sexual interaction. Its age-restriction, deepfake and perceived-normality questions measure different experiences; none should be substituted for another.
| ID | Finding and qualification | Population, actual period and base | Original source and locator |
|---|---|---|---|
| F53 | 50% of teens and 43% of preteens said they had accessed an app, website or platform before reaching its minimum age. Definition: Ever underage access; Figure 4A. Qualification: Not a measured age-check failure rate for every platform or evidence of any later policy’s impact. Weighted opt-in panel and sensitive self-report, not a probability sample. | US teen respondents 13–17 and preteen respondents 9–12 United States 2025-11-12 to 2025-12-01 Exact item/subgroup valid n is not printed beside these selected figures. An overall report n is not a subgroup base. | Thorn / Burson Published July 2026; original press release dated 2026-07-28 Report PDF physical p.9 narrative / Figure 4A |
| F54 | 7% of teens said they had seen a deepfake nude of another minor; 4% said one had been created of them. Definition: Ever, to the respondent’s best knowledge; QDFX1/QDFX3. Qualification: Not independently verified AI images, and not the same definition as CSM’s broader believed-AI sexual-content question. Weighted opt-in panel and sensitive self-report, not a probability sample. | US teens 13–17 United States 2025-11-12 to 2025-12-01 Exact item/subgroup valid n is not printed beside these selected figures. An overall report n is not a subgroup base. | Thorn / Burson Published July 2026; original press release dated 2026-07-28 Report PDF physical p.20, Figures 10A–10B |
| F55 | Among minors who had an online sexual interaction, 87% used online safety tools and 46% sought offline support. Definition: Multiple response routes to the scenarios experienced. Qualification: Routes overlap; do not infer the number who told no one from tool-use margins. Tool use does not prove removal or resolution. Weighted opt-in panel and sensitive self-report, not a probability sample. | US minors 9–17 reporting an online sexual interaction; conditional base United States 2025-11-12 to 2025-12-01 Exact item/subgroup valid n is not printed beside these selected figures. An overall report n is not a subgroup base. | Thorn / Burson Published July 2026; original press release dated 2026-07-28 Report PDF physical p.29 narrative / Figure 23 |
| F56 | 23% of teens and 9% of preteens agreed that it was normal for people their age to share intimate images with each other. Definition: Attitude of normality, not admission of sharing. Qualification: Do not equate perceived norms with actual behavior. Weighted opt-in panel and sensitive self-report, not a probability sample. | US teen respondents 13–17 and preteen respondents 9–12 United States 2025-11-12 to 2025-12-01 Exact item/subgroup valid n is not printed beside these selected figures. An overall report n is not a subgroup base. | Thorn / Burson Published July 2026; original press release dated 2026-07-28 Report Figure 13, perceptions of normalcy / original report overview |
What do the deepfake statistics actually measure?
Common Sense Media found that 44% of teens had seen sexual content they believed was AI-generated. Among that exposed group, 24% had seen content depicting themselves or someone they knew. The second figure is conditional: it is not 24% of all teens or the percentage personally victimized.
| ID | Finding and qualification | Population, actual period and base | Original source and locator |
|---|---|---|---|
| F57 | 44% had ever seen sexual content they believed was AI-generated. Definition: Believed-AI nude/sexual imagery or videos; Figure D. Qualification: Not 44% victimized in a deepfake or a forensic AI-detection measure. Demographically weighted opt-in panel, not a probability sample; believed-AI classification is self-report. | US teens 13–17 United States 2025-11-21 to 2025-12-09 Published eligible item/group base(s): 1,314. An overall report n is not a subgroup base. | Common Sense Media / Burson Published 2026-07-21 Report printed p.9 / physical p.11, Figure D |
| F58 | Among exposed teens, 24% had seen believed-AI sexual content depicting themselves or someone they knew personally. Definition: Conditional known-person exposure; not all teens. Qualification: Not 24% of all teens, and not 24% personally victimized. Demographically weighted opt-in panel, not a probability sample; believed-AI classification is self-report. | US teens 13–17 who had ever seen believed-AI sexual content, n=586 United States 2025-11-21 to 2025-12-09 Published eligible item/group base(s): 586. An overall report n is not a subgroup base. | Common Sense Media / Burson Published 2026-07-21 Report printed p.11 / physical p.13, Figure F |
| F59 | 67% were at least somewhat worried about being depicted without consent; the figures were 71% of girls and 62% of boys. Definition: Somewhat, pretty or extremely worried. Qualification: Worry does not measure actual victimization or a future probability of victimization. Demographically weighted opt-in panel, not a probability sample; believed-AI classification is self-report. | US teens 13–17; gender subgroups as reported United States 2025-11-21 to 2025-12-09 Published eligible item/group base(s): 1,314. An overall report n is not a subgroup base. | Common Sense Media / Burson Published 2026-07-21 Report printed p.34 / physical p.36, Figure 12 and narrative |
| F60 | Among exposed teens, 42% typically blocked/unfollowed the person, 30% reported content to the platform and 22% talked to parents or adults. Definition: Typical response to encountering the content; multiple responses. Qualification: Not all teens, mutually exclusive actions or proof of effective removal. Demographically weighted opt-in panel, not a probability sample; believed-AI classification is self-report. | US teens 13–17 who had ever seen believed-AI sexual content, n=586 United States 2025-11-21 to 2025-12-09 Published eligible item/group base(s): 586. An overall report n is not a subgroup base. | Common Sense Media / Burson Published 2026-07-21 Report printed p.36 / physical p.38, Figure 14 |
24 comparisons with reproducible inputs
All differences below use percentage points, rather than relative percentage change. The original questions and eligible populations remain part of the result. No new significance test, causal estimate or individual overlap is inferred.
| ID | Comparison | Arithmetic and unit | Original inputs and qualification |
|---|---|---|---|
| C01 | Disturbing violent imagery: online minus offline | 10.7 − 1.6 = 9.1 percentage points | F01 / F01 Same four-week pilot and full-sample base; online/offline experiences can overlap. No new paired test or causal interpretation. |
| C02 | Unwanted sexual images: online minus offline | 13.4 − 2 = 11.4 percentage points | F02 / F02 Same four-week pilot and full-sample base; online/offline experiences can overlap. No new paired test or causal interpretation. |
| C03 | Direct harassment: online minus offline | 16.4 − 18.5 = -2.1 percentage points | F03 / F03 Same four-week pilot and full-sample base; online/offline experiences can overlap. No new paired test or causal interpretation. |
| C04 | Witnessing harassment: online minus offline | 28.9 − 26.1 = 2.8 percentage points | F04 / F04 Same four-week pilot and full-sample base; online/offline experiences can overlap. No new paired test or causal interpretation. |
| C05 | Unwanted conversations: online minus offline | 16.5 − 12.8 = 3.7 percentage points | F05 / F05 Same four-week pilot and full-sample base; online/offline experiences can overlap. No new paired test or causal interpretation. |
| C06 | Witnessing identity discrimination: online minus offline | 36.7 − 19.3 = 17.4 percentage points | F06 / F06 Same four-week pilot and full-sample base; online/offline experiences can overlap. No new paired test or causal interpretation. |
| C07 | Communication confidence: online minus in person | 79 − 65 = 14.0 percentage points | F17 / F17 Self-description within the same survey, not observed competence. |
| C08 | Likely replies: known-added minus unknown-added | 82 − 34 = 48.0 percentage points | F20 / F20 Same app-user base and hypothetical scenarios; not actual replies. |
| C09 | Likely replies: self-added minus unknown-added | 80 − 34 = 46.0 percentage points | F20 / F20 Same app-user base; intentions, not observed behavior. |
| C10 | Safety information: school minus parent source | 95 − 62 = 33.0 percentage points | F27 / F27 Only information recipients; sources overlap, so this does not count school-only children. |
| C11 | Sexual messages received: girls minus boys | 13 − 10 = 3.0 percentage points | F29 / F29 Ages 13–15, same prior-year definition; no new adjusted/significance test. |
| C12 | Sexual messages received: age 15 minus age 13 | 16 − 7 = 9.0 percentage points | F29 / F29 Cross-sectional age groups, not growth within the same child. |
| C13 | Tracking/monitoring/harassment: lifetime, oldest minus youngest | 30 − 19 = 11.0 percentage points | F32 / F32 Ages 16–17 versus 10–12; lifetime opportunity differs. |
| C14 | Tracking/monitoring/harassment: past year, oldest minus youngest | 17 − 14 = 3.0 percentage points | F32 / F32 Same outcome with a past-year window; not a longitudinal trend. |
| C15 | Tracking/monitoring/harassment: past year, oldest minus middle | 17 − 19 = -2.0 percentage points | F32 / F32 Source says 13–15 and 16–17 past-year estimates are not significantly different; no claim of a decline. |
| C16 | Parent unawareness: haptic-user minus AI-user groups | 28 − 16 = 12.0 percentage points | F40 / F40 Different, overlapping child-user populations and n=270 versus 1,447; not a within-parent mismatch or technology effect. |
| C17 | Parent AI unawareness: younger-child minus older-teen users | 21 − 11 = 10.0 percentage points | F41 / F41 Within child-reported AI users at ages 10–12 versus 16–17; child report is not device verification. |
| C18 | Canadian privacy discussions: teen minus child parent cohort | 92 − 75 = 17.0 percentage points | F45 / F45 Assigned cohorts, not paired children followed within the same home. |
| C19 | Canadian guidance responsibility: teen minus child cohort | 84 − 92 = -8.0 percentage points | F44 / F44 Parent perceptions in separately assigned age cohorts; no behavior/outcome effect. |
| C20 | Privacy-discussion topics: scams minus deepfakes | 68 − 28 = 40.0 percentage points | F48 / F48 Same routed n=252; multiple topics can overlap. Not all parents. |
| C21 | Privacy-discussion topics: oversharing minus adjusting settings | 63 − 29 = 34.0 percentage points | F48 / F48 Same routed discussers; topic mentions, not tested skills. |
| C22 | Historical privacy-settings use: older minus younger youth | 56 − 46 = 10.0 percentage points | F52 / F52 2021, ages 12–17 versus 9–11; not a current trend. |
| C23 | Deepfake worry: girls minus boys | 71 − 62 = 9.0 percentage points | F59 / F59 Same opt-in teen survey; worry is not victimization or a causal gender effect. |
| C24 | Underage access: teens minus preteens | 50 − 43 = 7.0 percentage points | F53 / F53 Same survey, ever access; not a tested age-verification failure rate. |
Common questions about teen online safety statistics
Are online and offline harassment rates directly comparable?
The JAMA pilot asked the same teen sample about the preceding four weeks in both settings. Its direct-harassment figures were 16.4% online and 18.5% offline. They are descriptive margins with overlapping experiences, not proof of a causal difference. Original source.
Does a weekly unfamiliar friend request mean a child was groomed?
No. The Ofcom 64% figure measures incoming requests among communication-app users. It does not establish the sender’s age, criminal intent, whether the request was unwanted or whether any reply occurred. Original source.
Does 19% adult senders mean 19% of all children received adult sexual messages?
No. That ONS figure applies only to 13–15-year-olds who received a sexual message. The whole age group and the recipient subset have different denominators. Original source.
Are parents’ confidence and awareness the same thing?
No. The Australian report separately asks how informed parents feel and compares parent answers with child-reported technology use. In the matched AI-user group, 16% of parents were unaware of the reported use. Original source.
Do 24% of all teens appear in AI-generated sexual content?
The selected Common Sense Media result does not say that. It gives 24% among teens who had seen believed-AI sexual content, and the category includes self or someone known personally. It is not an own-image-victimization rate. Original source.
Do reporting and blocking statistics show that the problem was resolved?
No. They measure reported actions or support routes. They do not independently verify content removal, account action, safety or the young person’s later outcome. Original source.
Methodology and limitations
Sources and verification
We used original reports, agency publications, research papers, questionnaires and toplines. Every finding records the original URL, source locator, population, actual period, definition and qualification. Selected JAMA and eSafety sources were read using public web retrieval when direct HTTP requests failed. Those failures are recorded rather than treated as missing proof of the published findings.
What the research count means
There are 60 grouped findings and 152 numeric inputs across ten source records from nine publishing organizations. Related response categories share finding IDs. These are not 60 independent studies. The two eSafety records reuse Keeping Kids Safe Online, and parents and children can belong to the same research program. The largest source contributes eight findings.
Who is represented
Teen-only US studies, UK children aged 11–17, England-and-Wales children aged 10–15, Australian children 10–17 and Canadian youth/parent samples are all labeled separately. Some sources include younger children. Parent answers are not silently substituted for children’s own experiences. The source records describe recruitment, weighting, coverage and available overall sample sizes.
Actual dates and the 2027 edition
2027 is the editorial edition. Sources were reviewed November 1, 2026. Selected observations extend into 2026, while several 2026 publications report 2025 fieldwork. Historical Canadian privacy observations remain 2021, not current prevalence. MediaSmarts’ report and landing page differ about the starting month; the discrepancy is retained. No 2027 observations or future publication dates are invented.
Uncertainty and missing bases
Published standard errors for 15 selected US pilot estimates are numeric in the input sheet. No new confidence intervals, significance tests or sampling-error claims are generated. Missing item/subgroup n, intervals, SE and SD remain blank. Overall sample sizes are not assigned to routed questions. ONS’s redesigned survey is official statistics in development and is not directly comparable with its former face-to-face series.
What MyLittleDesire contributed
MyLittleDesire created four chart designs, a comparability guide and 24 reproducible descriptive differences. Every calculation points to its source input IDs and keeps percentage-point units. Some differences are already evident in the researchers’ reports. The contribution is accessible synthesis and verification, not new survey fieldwork or 24 new scientific discoveries.
Comparison limits
The same four-week US questions support online/offline descriptive margins, but those contexts can overlap. Australian lifetime and past-year age patterns do not track the same children over time. Technology-awareness rates use different, overlapping user groups. Canadian conversation topics condition on having discussed privacy. Marginal differences do not identify individual overlap, concealment or paired disagreement.
Sensitive and emerging risks
Content and intimate-image findings use non-graphic wording and preserve the original consent, exposure and age distinctions. Believed-AI content is not forensic confirmation. Use of a blocking or reporting tool does not demonstrate removal or resolution. The report does not estimate a child’s personal risk from a population percentage or blame affected young people.
Updating the evidence
Review new source releases and original question definitions before changing values. Update charts and calculations together with their inputs. Keep historically useful findings dated, retain unresolved claims outside the publishable core and record genuine substantive reviews. Do not change dates solely to create an appearance of freshness.
Related research on online relationships
Cyberbullying and Online Social Relationships Statistics focuses on bullying patterns and social context. Teen Friendship and Peer Support Statistics examines support and connection. AI Companions and Digital Relationships Statistics distinguishes chatbot, companionship and relationship use. This safety resource concentrates on privacy, contact, family awareness and responses to harm.
Complete original-source bibliography
- S01 · Stanford University and collaborating institutions / JAMA Pediatrics. Adolescents’ Experiences of Online Harms by Platform.
Published 2026-09-18. Data period: February–December 2025; previous four weeks for harm items.
Population: Adolescents aged 13–17; platform-specific users only where stated
Method: Cross-sectional probability-based Understanding America Study teen pilot, recruited through panel households with permission/assent and weighted to demographic benchmarks. Original Tables 1–2 and methods were read through public web retrieval. Selected full-sample percentages include published standard errors.
Limits: Small exploratory pilot, not preregistered. Self-reports and broad harm definitions. Online/offline experiences can overlap; do not sum their percentages or derive unique victim counts. Marginal differences are not paired disagreement, causation or new significance tests. Different platform user groups do not identify platform effects. Direct local HTTP retrieval returned 403; public research-page retrieval succeeded.
Reviewed November 1, 2026. - S02 · Pew Research Center. Teens’ Experiences on TikTok, Instagram and Snapchat.
Published 2026-04-15. Data period: 2025-09-25 to 2025-10-09.
Population: Teens 13–17 living with parents and parents of teens 13–17; each platform has a user-only base
Method: Ipsos KnowledgePanel probability recruitment via parents; separate parent and teen weights. Original report and topline inspected. Teen platform bases: Snapchat 772, Instagram 908, TikTok 996. Parent-reported TikTok-user base 962.
Limits: Platform percentages are not all-teen percentages or safety league tables. Experiences in harassment items are ever, while messaging is daily and perceived effects have separate wording. Parent and teen TikTok-user samples differ; their margins are not matched dyad disagreement rates. Overall ±3.3-point survey margin is not assigned as a subgroup CI.
Supporting document 1 · Supporting document 2 · Supporting document 3
Reviewed November 1, 2026. - S03 · Ofcom / Savanta. Understanding Online Communications Among Children 2026.
Published 2026-09-09 report update. Data period: 2026-02-13 to 2026-03-19.
Population: Children aged 11–17; all respondents or app/communication-user subsets as specified
Method: Online quota panel; 94% recruited through parents and 6% directly aged 16–17. Weighted by age, gender, nation, region, ethnicity and socioeconomic grade. Original research, technical report and questionnaire inspected.
Limits: Non-probability panel, not a probability sample. Relevant bases differ: all 4,097, communication/connection users 3,836, any app/platform users 4,065. Ever-contact items are not past-year prevalence; weekly requests measure frequency. Potentially uncomfortable contact does not necessarily mean illegal contact or grooming. Method/wording changes prevent a clean 2023 trend.
Supporting document 1 · Supporting document 2 · Supporting document 3
Reviewed November 1, 2026. - S04 · Office for National Statistics. Children’s perceptions of crime and online safety in England and Wales: year ending February 2026.
Published 2026-09-02. Data period: Collection December 2025 and March 2026; experiences December 2024–February 2026, as defined by ONS.
Population: Children 10–15 in private households; sensitive-content and sexual-message questions only 13–15
Method: Redesigned self-completion Children’s Crime Survey for England and Wales using linked education/health sampling data and weighting. Published bulletin, definitions and quality section inspected.
Limits: Official statistics in development, not accredited official statistics. Break from the prior face-to-face series; no direct trend. Two collection rounds may not fully capture seasonality. Overall n=6,031 is not the valid n for the 13–15 module or the conditional message-receiver group. Lot/fair-amount exposure differs from any exposure. School/parent information sources condition on receiving information.
Supporting document 1
Reviewed November 1, 2026. - S05 · eSafety Commissioner. How common is non-consensual tracking, monitoring and harassment among children in Australia?.
Published Page last updated 2026-09-21; first-publication day not established. Data period: December 2024–February 2025; lifetime and previous 12 months distinguished.
Population: Children aged 10–17; follow-up questions concern one selected most-recent experience
Method: Keeping Kids Safe Online core survey; non-probability Octopus/Pure Profile panels recruited through parents, quotas and weights. A subset n=429 answered details about this most-recent experience. Original accessible text, footnotes and methodology read through public web retrieval.
Limits: Same underlying study as S06. Demographic weighting does not make this a probability sample. Persistent unwanted contact requires at least two weeks and ten contact attempts; comfortable protective parental checks are excluded by question wording. Recent-event follow-ups are not all affected children or all incidents. Direct HTTP returned 503; public research-page retrieval succeeded.
Supporting document 1
Reviewed November 1, 2026. - S06 · eSafety Commissioner. Balancing risk and reward: Parenting in the digital world.
Published June 2026 report; webpage last updated 2026-06-17. Data period: December 2024–February 2025.
Population: Parents/caregivers and their children 10–17; technology-awareness rows restricted to child-reported users
Method: Matched parent–child Keeping Kids Safe Online core survey; same non-probability quota/weighted program as S05. Original PDF tables were inspected through public retrieval. Parent awareness is compared against child self-report, which is not device-verified use.
Limits: Predates the implementation of Australian social-media age restrictions; not a policy impact study. Technology-user bases differ and overlap: AI 1,447, VR 1,325, haptics 270. The unaware category excludes a separate don’t-know category. Report publication date is not fieldwork date. Direct HTTP returned 503; public PDF/page retrieval succeeded.
Supporting document 1 · Supporting document 2
Reviewed November 1, 2026. - S07 · Office of the Privacy Commissioner of Canada / Phoenix SPI. 2024–2025 Public Opinion Research on Privacy Issues.
Published March 2025 final report; page modified 2025-05-08. Data period: 2025-02-25 to 2025-02-28, parent/teacher online component.
Population: Parents with children 6–12 or teens 13–17; those with both assigned one age cohort
Method: Online non-probability parent/teacher panel; parent component n=302. Figures 31, 33 and 35–38 provide the selected parent results. The separate n=1,500 telephone survey of people 16+ is not used as the parent sample.
Limits: Age cohorts are different assigned parent groups, not paired children within every family. Discussion-capability, frequency and topics condition on discussing privacy, n=252 overall. Age-specific valid n not printed beside figures remains blank. One frequency narrative says 12–17 despite the 13–17 design; that age-specific frequency claim is withheld.
Supporting document 1
Reviewed November 1, 2026. - S08 · MediaSmarts. Young Canadians in a Wireless World, Phase IV: Online Privacy and Consent.
Published January 2023 report; exact publication day not established. Data period: 2021; report methods say October–December, landing page says September–December.
Population: Students in grades 4–11, ages 9–17; older group 12–17 and younger group 9–11
Method: Historical school-plus-general-population recruitment administered with Environics: 79 classroom and 979 GenPop respondents. Report methods pp.9–10 and original privacy figures inspected. Younger group n=399, older n=659 overall.
Limits: Historical 2021 observation, not current 2027 prevalence. Pandemic recruitment changed the design; not a simple nationally representative school probability sample. Report and landing page differ on starting month, so precise fieldwork is not silently harmonized. Undisclosed question-valid n remains blank; total age-group n is not automatically substituted.
Supporting document 1 · Supporting document 2
Reviewed November 1, 2026. - S09 · Thorn / Burson. Youth Perspectives on Online Safety, 2025: An annual report of youth attitudes and experiences.
Published July 2026; original press release dated 2026-07-28. Data period: 2025-11-12 to 2025-12-01.
Population: Minors 9–17; teens 13–17 and preteens 9–12; some follow-ups conditional on an online sexual interaction
Method: Non-probabilistic opt-in online quota sample, weighted to Census age/gender/race/geography benchmarks; parent permission and anonymity. Overall teen n=657 and preteen n=346. Original methods and Figures 4A, 10, 13 and 23 inspected.
Limits: Sensitive self-report and possible underreporting. Prior-year differences use different cross-sections. Deepfake items ask best knowledge, not forensic verification. Online/offline help routes can overlap; use of tools is not a guarantee of removal or disclosure. Routed valid n not explicitly provided remains blank.
Supporting document 1
Reviewed November 1, 2026. - S10 · Common Sense Media / Burson. Teens and Explicit Deepfakes in the Age of AI.
Published 2026-07-21. Data period: 2025-11-21 to 2025-12-09.
Population: Teens 13–17; exposed teens n=586 for selected follow-ups
Method: Parent-recruited opt-in online panels with quotas and demographic weighting. Original report Figures D/F, 12 and 14 plus methods pp.47–50 inspected. Distinguishes believed-AI exposure from depicted-person identification and subsequent actions.
Limits: Non-probability panel despite representative demographic targets. Report’s conventional sampling-error statement is not treated as proof of probability sampling. Exposure is respondent belief, not independently verified AI detection. Conditional 24% known-person exposure is not 24% of all teens. Qualitative interview incentives are separate from survey incentives.
Supporting document 1
Reviewed November 1, 2026.
How to cite this resource
MyLittleDesire. Teen Online Safety Statistics 2027 . https://mylittledesire.com/teen-online-safety-statistics/