
Sharing a meal can mean lunch with a friend, breakfast with a sibling or dinner with the whole household. Those experiences are connected, but their statistics answer different questions. This resource organizes the evidence so each finding keeps its original definition, population and year.
What do shared-meal statistics measure?
Check who was present, the meal type, recall period and denominator before comparing values.
| Measure | Definition | Where used |
|---|---|---|
| Shared lunch/dinner | A lunch or dinner with someone known during the previous seven days. Maximum 14 combined meal slots. | Gallup F01–F09; breakfast excluded |
| An all-meals-alone day | Every recorded primary eating/drinking period on one diary day was alone. | ATUS F10–F14; not a lifelong habit or loneliness scale |
| Parent–child meal | The responding parent and child eat together. | Australian F47; fewer required diners |
| Whole-household meal | Everyone who lives in the house eats together. | Australian F48; stricter measure |
| Most days or daily | A combined frequency category broader than every day. | Canadian students F39–F41 |
| Whole-family meal days | Days when all co-resident family members eat a meal together, weighted to children. | US NSCH F60 |
| Breakfast companions | Question routed only to a selected child’s usual at-home breakfast. | Mott F57; parent and sibling can overlap |
| Perceived benefit or future plan | A respondent’s view or intention, separate from measured behavior or causal benefit. | AHA and FMI findings |
Key shared-meal and social-connection findings
7.9
7.5
Shared lunches and dinners per week in the US profile.
Shared lunches and dinners per week in the UK profile.
8.4
8.5
Shared lunches and dinners per week in Canada.
Shared lunches and dinners per week in Australia.
26%
18%
Ate all recorded meals alone on the previous day.
Ate all recorded meals alone despite living with others.
84%
42%
Wanted more meals with loved ones.
Named different schedules as a family-meal barrier.
59%
43%
Had daily parent–child dinners in the Australian sample.
Had daily whole-household dinners in that sample.
16%
45.8%
Ate breakfast alone in the at-home-breakfast group.
Had all co-resident family members eat together daily.
How often do people share lunch and dinner?
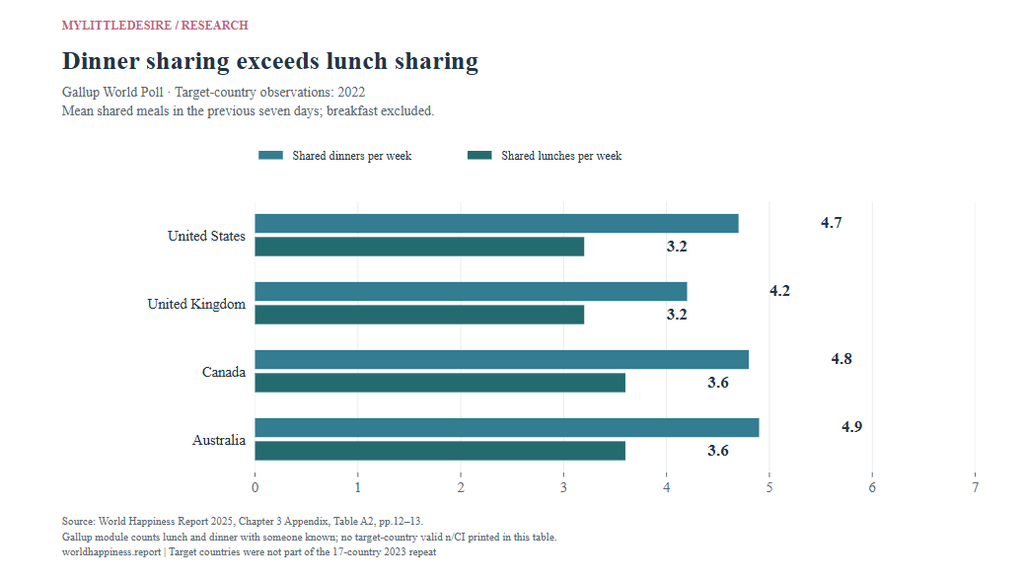
In Gallup’s target-country observations, shared dinners were more common than shared lunches. All four profiles use the same recall window and lunch/dinner measure. The country observations come from 2022, although the chapter was published in 2025.
| ID | Finding and qualification | Population, actual period and base | Original source and locator |
|---|---|---|---|
| F01 | United States respondents averaged 7.9 shared lunches and dinners per week: 4.7 dinners and 3.2 lunches. Definition: Mean shared lunch/dinner slots in the preceding seven days. Qualification: Country estimates are rounded. No country-specific interval or valid n is printed in this table; do not label differences statistically significant. | Gallup-covered residents in United States 142 countries and territories; target-country profiles use 2022 2022; target country not in the 2023 repeat list Exact eligible item/subgroup n is not printed beside these figures. An overall survey n is not automatically a routed item’s valid base. | World Happiness Report / Gallup Published 2025-03-20 Appendix Table A2, physical p.13 |
| F02 | United Kingdom respondents averaged 7.5 shared lunches and dinners per week: 4.2 dinners and 3.2 lunches. Definition: Mean shared lunch/dinner slots in the preceding seven days. Qualification: Country estimates are rounded. No country-specific interval or valid n is printed in this table; do not label differences statistically significant. | Gallup-covered residents in United Kingdom 142 countries and territories; target-country profiles use 2022 2022; target country not in the 2023 repeat list Exact eligible item/subgroup n is not printed beside these figures. An overall survey n is not automatically a routed item’s valid base. | World Happiness Report / Gallup Published 2025-03-20 Appendix Table A2, physical p.13 |
| F03 | Canada respondents averaged 8.4 shared lunches and dinners per week: 4.8 dinners and 3.6 lunches. Definition: Mean shared lunch/dinner slots in the preceding seven days. Qualification: Country estimates are rounded. No country-specific interval or valid n is printed in this table; do not label differences statistically significant. | Gallup-covered residents in Canada 142 countries and territories; target-country profiles use 2022 2022; target country not in the 2023 repeat list Exact eligible item/subgroup n is not printed beside these figures. An overall survey n is not automatically a routed item’s valid base. | World Happiness Report / Gallup Published 2025-03-20 Appendix Table A2, physical p.13 |
| F04 | Australia respondents averaged 8.5 shared lunches and dinners per week: 4.9 dinners and 3.6 lunches. Definition: Mean shared lunch/dinner slots in the preceding seven days. Qualification: Country estimates are rounded. No country-specific interval or valid n is printed in this table; do not label differences statistically significant. | Gallup-covered residents in Australia 142 countries and territories; target-country profiles use 2022 2022; target country not in the 2023 repeat list Exact eligible item/subgroup n is not printed beside these figures. An overall survey n is not automatically a routed item’s valid base. | World Happiness Report / Gallup Published 2025-03-20 Appendix Table A2, physical p.12 |
| F05 | Global means were 7.7 shared meals weekly under age 30, 7.4 at 30–44, 7.2 at 45–59 and 6.6 at 60+. Definition: Lunches plus dinners; cross-sectional age groups. Qualification: Age differences do not describe the same people as they grow older. | Global Gallup meal-module age groups 142 countries and territories; target-country profiles use 2022 2022; repeated in 17 countries in 2023 Published input base(s): 31,325, 33,088, 43,342, 44,129. An overall survey n is not automatically a routed item’s valid base. | World Happiness Report / Gallup Published 2025-03-20 Appendix Table A1, physical p.11. |
| F06 | Regional means were 8.8 shared meals weekly in Latin America/Caribbean and 8.3 in both Western Europe and North America/Australia/New Zealand. Definition: Source-defined regional averages of lunches plus dinners. Qualification: The combined North America/ANZ region is not a US-only or Australia-only estimate. | Respondents in the named Gallup regions 142 countries and territories; target-country profiles use 2022 2022; repeated in 17 countries in 2023 Published input base(s): 4,010, 20,036, 21,535. An overall survey n is not automatically a routed item’s valid base. | World Happiness Report / Gallup Published 2025-03-20 Appendix Table A1, physical p.11. |
| F07 | Average life evaluations were 4.9 among people sharing no lunch or dinner in the week and 5.2 among those sharing one. Definition: Cantril life-evaluation score, 0–10, grouped by recalled shared lunches/dinners. Qualification: Observational group means do not show that adding one meal raises any individual’s score. | Global meal-module respondents in the two displayed groups 142 countries and territories; target-country profiles use 2022 2022; repeated in 17 countries in 2023 Exact eligible item/subgroup n is not printed beside these figures. An overall survey n is not automatically a routed item’s valid base. | World Happiness Report / Gallup Published 2025-03-20 Chapter Figure 3.5 and accompanying paragraph. |
| F08 | The reported country-level correlation between income and meal sharing was 0.2; income explained 4.6% of cross-country meal-sharing variation. Definition: Country-level descriptive association, not a person-level effect. Qualification: Do not infer that income is irrelevant or that the remaining variation is caused by one factor. | Country-level aggregates from the Gallup module 142 countries and territories; target-country profiles use 2022 2022; repeated in 17 countries in 2023 Exact eligible item/subgroup n is not printed beside these figures. An overall survey n is not automatically a routed item’s valid base. | World Happiness Report / Gallup Published 2025-03-20 Sharing meals around the world, paragraph before Figure 3.3. |
| F09 | Global means were 7.4 shared meals weekly for men and 7.3 for women. Definition: Lunch/dinner mean by reported gender. Qualification: The chapter reports regional gender differences as statistically insignificant. A rounded global 0.1 gap is not proof of a meaningful gender divide. | Global male/female groups in Table A1 142 countries and territories; target-country profiles use 2022 2022; repeated in 17 countries in 2023 Published input base(s): 70,122, 82,015. An overall survey n is not automatically a routed item’s valid base. | World Happiness Report / Gallup Published 2025-03-20 Appendix Table A1, physical p.11; gender discussion in chapter. |
Can people live with others and still eat alone?
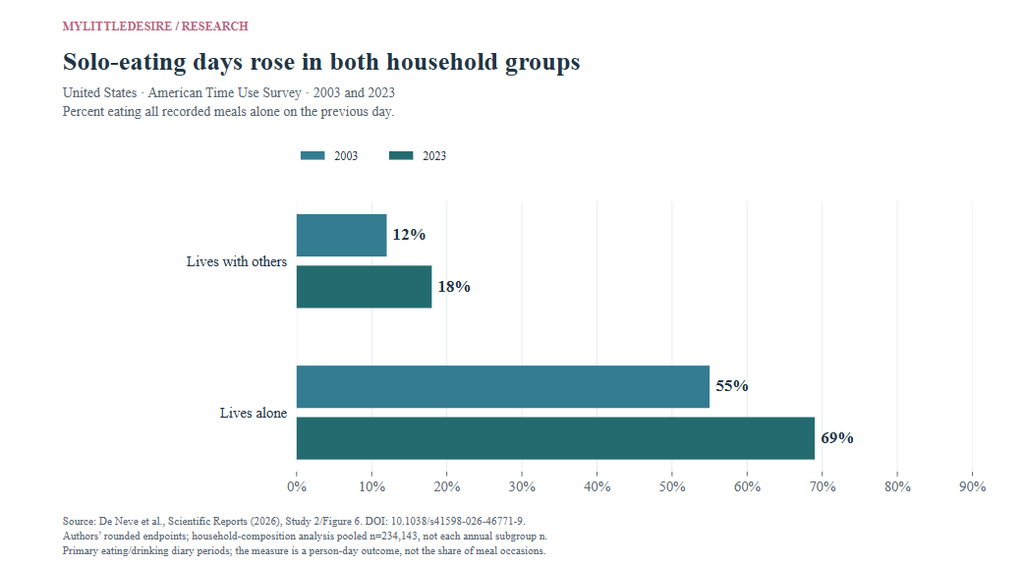
Yes. In the authors’ US time-diary analysis, 18% of adults living with other people ate all recorded meals alone on their 2023 diary day, compared with 12% in 2003. Sharing a home and sharing a meal are different experiences.
| ID | Finding and qualification | Population, actual period and base | Original source and locator |
|---|---|---|---|
| F10 | 26% of adults in the authors’ 2023 ATUS analysis ate all their recorded meals alone on the previous day. Definition: Person-day outcome: every recorded primary eating/drinking period was alone. Qualification: This is not 26% of all meal occasions or people who always eat alone. WHR describes the 2003–2023 relative increase as 53%; no exact 2003 overall point is reconstructed from that rounded claim. | US ATUS adult respondents in the authors’ analysis United States 2023 Exact eligible item/subgroup n is not printed beside these figures. An overall survey n is not automatically a routed item’s valid base. | De Neve, Dugan, Kaats and Prati / Scientific Reports Published 2026-04-22; version of record 2026-06-17 Study 2 results, paragraph before Figure 6. |
| F11 | Among adults living with other people, the all-meals-alone diary-day rate rose from 12% in 2003 to 18% in 2023. Definition: Same person-day outcome within the non-solo-household group. Qualification: Rounded endpoints; repeated cross-sections, not a panel following the same adults. | US adult ATUS respondents living with others United States 2003 and 2023 Exact eligible item/subgroup n is not printed beside these figures. An overall survey n is not automatically a routed item’s valid base. | De Neve, Dugan, Kaats and Prati / Scientific Reports Published 2026-04-22; version of record 2026-06-17 Study 2 results, household-composition paragraph and Figure 6A. |
| F12 | Among adults living alone, the all-meals-alone diary-day rate rose from 55% in 2003 to 69% in 2023. Definition: Same person-day outcome within one-person households. Qualification: A larger absolute rise can coexist with a smaller relative rise because the starting rates differ. | US adult ATUS respondents living alone United States 2003 and 2023 Exact eligible item/subgroup n is not printed beside these figures. An overall survey n is not automatically a routed item’s valid base. | De Neve, Dugan, Kaats and Prati / Scientific Reports Published 2026-04-22; version of record 2026-06-17 Study 2 results, household-composition paragraph and Figure 6A. |
| F13 | The authors estimated that rising solo living accounted for 17% of the increase in solo-eating days under their regression comparison. Definition: Authors’ statistical adjustment comparing models with and without living-alone control. Qualification: Not a causal attribution and not 17 percentage points. It does not show that the remaining increase is explained by remote work. | ATUS repeated cross-sections in the published model United States 2003–2023 Exact eligible item/subgroup n is not printed beside these figures. An overall survey n is not automatically a routed item’s valid base. | De Neve, Dugan, Kaats and Prati / Scientific Reports Published 2026-04-22; version of record 2026-06-17 Study 2 results, paragraph on living alone; Appendix Figure B3 referenced. |
| F14 | The authors reported about a 90% increase in all-meals-alone days among 18–24-year-olds over the two decades. Definition: Relative change since the 2003 age-group baseline. Qualification: Approximate reported increase, not a 90% prevalence or a 90-point change; no exact endpoints are invented. | US ATUS respondents ages 18–24 United States 2003–2023 Exact eligible item/subgroup n is not printed beside these figures. An overall survey n is not automatically a routed item’s valid base. | De Neve, Dugan, Kaats and Prati / Scientific Reports Published 2026-04-22; version of record 2026-06-17 Study 2 results, discussion of Figure 7B. |
How do meals fit into friendship and social support?
The historical UK survey documents meals with relatives, friends, neighbours and colleagues, alongside attitudes and support networks. It helps explain which relationships meals can involve. Its 2016 panel percentages should not be presented as current national prevalence.
| ID | Finding and qualification | Population, actual period and base | Original source and locator |
|---|---|---|---|
| F15 | 93% reported eating with family or friends at least sometimes. Definition: Survey’s sometimes-or-more social-eating description. Qualification: Historical panel survey; not a strict weekly or daily threshold. | UK panel adults over 18 United Kingdom April 2016 Exact eligible item/subgroup n is not printed beside these figures. An overall survey n is not automatically a routed item’s valid base. | R. I. M. Dunbar / University of Oxford Published 2017-03-11 Results, opening paragraph/Figure 1. |
| F16 | In the previous six months, 15% had not shared a meal with another family member, 30% with a best friend and 45% with an old friend. Definition: No meal with each named relationship category in six months. Qualification: These overlapping categories are not a distribution that should sum to 100%. | UK panel adults over 18 United Kingdom April 2016; six months recalled Exact eligible item/subgroup n is not printed beside these figures. An overall survey n is not automatically a routed item’s valid base. | R. I. M. Dunbar / University of Oxford Published 2017-03-11 Results, first paragraph/Figure 2. |
| F17 | Nearly 70% said they had never eaten with a neighbour; 15% never with a colleague, 32% with a boss/manager and 37% with a community group. Definition: Reported never dining with each named category. Qualification: Do not replace never with the six-month reference period used for the preceding question. | UK panel adults over 18 United Kingdom April 2016; never-response reference Exact eligible item/subgroup n is not printed beside these figures. An overall survey n is not automatically a routed item’s valid base. | R. I. M. Dunbar / University of Oxford Published 2017-03-11 Results, first paragraph. |
| F18 | 65% felt there was someone they should make more effort to see or spend time with. Definition: Self-reported desire for more contact, not an isolation diagnosis. Qualification: The adjacent 75% meal-as-best-way result has unclear routing in the narrative and is omitted. | UK panel adults over 18 United Kingdom April 2016 Exact eligible item/subgroup n is not printed beside these figures. An overall survey n is not automatically a routed item’s valid base. | R. I. M. Dunbar / University of Oxford Published 2017-03-11 Results, final sentences of opening paragraph. |
| F19 | 76.4% agreed that sharing a meal was a good way to bring people closer; 18.1% were unsure. Definition: Attitude about shared meals, not observed improvement. Qualification: Do not present agreement as a causal effectiveness rate. | UK panel adults over 18 United Kingdom April 2016 Exact eligible item/subgroup n is not printed beside these figures. An overall survey n is not automatically a routed item’s valid base. | R. I. M. Dunbar / University of Oxford Published 2017-03-11 Results, paragraph before discussion of meal activities. |
| F20 | The last social lunch averaged 3.3 people and the last social dinner 3.6, including the respondent. Definition: Recalled most recent lunch/dinner with someone outside the household. Qualification: Valid recalled-meal bases vary. The text’s spread figures are not assigned an SD/SE interpretation here. | Respondents recalling eligible recent social meals United Kingdom April 2016 Exact eligible item/subgroup n is not printed beside these figures. An overall survey n is not automatically a routed item’s valid base. | R. I. M. Dunbar / University of Oxford Published 2017-03-11 Results, Figure 3 paragraph. |
| F21 | At the recalled social dinners, laughter occurred at 67.9%, reminiscing at 51.5% and jokes at 22.3%. Definition: Presence of reported activities at the last eligible social dinner. Qualification: Activities can overlap; the percentages are not portions of dinner time or estimated causal effects. | Respondents with an eligible recalled social dinner United Kingdom April 2016 Exact eligible item/subgroup n is not printed beside these figures. An overall survey n is not automatically a routed item’s valid base. | R. I. M. Dunbar / University of Oxford Published 2017-03-11 Original Table 2, Frequency (%) column. |
| F22 | Respondents reported an average of 4.63 people they could rely on for emotional or other support. Definition: Support network can include family as well as friends. Qualification: Not the number of dining companions or a guaranteed effect of eating together. The displayed spread is not reclassified as an SD. | UK panel adults over 18 United Kingdom April 2016 Exact eligible item/subgroup n is not printed beside these figures. An overall survey n is not automatically a routed item’s valid base. | R. I. M. Dunbar / University of Oxford Published 2017-03-11 Results, support-clique paragraph/Figure 4. |
Do people want more opportunities to eat together?
Many respondents in the AHA survey did: 84% wished for more meals with loved ones. The parent and employed-person findings use narrower groups, and perceived stress relief is not a measured clinical effect.
| ID | Finding and qualification | Population, actual period and base | Original source and locator |
|---|---|---|---|
| F23 | 84% wished they could share meals with loved ones more often. Definition: Preference among sampled US adults 18+. Qualification: A wish is not a report that these adults currently eat every meal alone. | US adult survey respondents United States 2022-09-14 to 2022-09-20 Exact eligible item/subgroup n is not printed beside these figures. An overall survey n is not automatically a routed item’s valid base. | American Heart Association / Wakefield Research Published 2022-10-10 Original survey release, highlights and opening results. |
| F24 | 91% of parents noticed less family stress when sharing meals. Definition: Parent-reported perception, not the full adult sample. Qualification: Parent item n is not supplied. No causal or clinically measured stress reduction is estimated. | Parent subset of the US adult survey United States 2022-09-14 to 2022-09-20 Exact eligible item/subgroup n is not printed beside these figures. An overall survey n is not automatically a routed item’s valid base. | American Heart Association / Wakefield Research Published 2022-10-10 Original survey release, first highlight. |
| F25 | 67% said shared meals reminded them to connect with people; 54% said meals prompted them to slow down. Definition: Two separate self-reported experiences. Qualification: Responses may overlap; subtracting them cannot identify people who connect without slowing down. | US adult survey respondents United States 2022-09-14 to 2022-09-20 Exact eligible item/subgroup n is not printed beside these figures. An overall survey n is not automatically a routed item’s valid base. | American Heart Association / Wakefield Research Published 2022-10-10 Original survey release, connection/slow-down paragraph. |
| F26 | 59% said they were more likely to make healthier food choices when eating with other people. Definition: Self-reported tendency, not a measured dietary score. Qualification: No estimate of disease risk or nutritional improvement is inferred. | US adult survey respondents United States 2022-09-14 to 2022-09-20 Exact eligible item/subgroup n is not printed beside these figures. An overall survey n is not automatically a routed item’s valid base. | American Heart Association / Wakefield Research Published 2022-10-10 Original survey release, food-choice paragraph. |
| F27 | 69% of employed respondents said more time for a meal break with a colleague would leave them less stressed at work. Definition: Hypothetical preference among full- or part-time workers. Qualification: Not an evaluated workplace lunch intervention; exact employed-item n unavailable. | Employed full- or part-time US survey respondents United States 2022-09-14 to 2022-09-20 Exact eligible item/subgroup n is not printed beside these figures. An overall survey n is not automatically a routed item’s valid base. | American Heart Association / Wakefield Research Published 2022-10-10 Original survey release, employed-adult paragraph. |
| F28 | 65% were at least somewhat stressed; 27% were very or extremely stressed. Definition: Background stress categories among US adult respondents. Qualification: Nested categories, not two exclusive groups. This context does not prove shared meals treat stress. | US adult survey respondents United States 2022-09-14 to 2022-09-20 Exact eligible item/subgroup n is not printed beside these figures. An overall survey n is not automatically a routed item’s valid base. | American Heart Association / Wakefield Research Published 2022-10-10 Original survey release, stress-level paragraph. |
What helps or obstructs family meals?
Among grocery shoppers in the April 2025 FMI survey, conflicting schedules were the most frequently selected listed barrier. Perceived connection, practical routines and future intentions are reported separately, preserving the difference between what people do and what they hope to do.
| ID | Finding and qualification | Population, actual period and base | Original source and locator |
|---|---|---|---|
| F29 | 59% judged family-meal benefits greater than the effort/cost; among households with children, 65% did. Definition: Published overall combined percentage and nested household-with-children group. Qualification: Not proof that meal costs fall. Household-with-children valid n is not printed. | US grocery shoppers; specified child-household subset United States 2025-04-10 to 2025-04-16 Exact eligible item/subgroup n is not printed beside these figures. An overall survey n is not automatically a routed item’s valid base. | FMI Foundation Published April 2025; exact publication day not established Physical p.14, benefits-versus-costs slide. |
| F30 | For family meals, 54% included a partner in their definition of family, 45% adult relatives, 33% children, 21% pets and 12% other adults. Definition: Multiple selections reflecting who exists in the respondent’s life. Qualification: Not a ranking of whom people love; not every shopper has children, a partner or pets. | US grocery shoppers United States 2025-04-10 to 2025-04-16 Exact eligible item/subgroup n is not printed beside these figures. An overall survey n is not automatically a routed item’s valid base. | FMI Foundation Published April 2025; exact publication day not established Physical p.6, Definition of Family. |
| F31 | 44% reported more family meals at home over the past year, 44% the same amount and 12% fewer. Definition: Retrospective perceived change, not a measured meal count. Qualification: Recall and household composition may affect the response. | US grocery shoppers United States 2025-04-10 to 2025-04-16 Exact eligible item/subgroup n is not printed beside these figures. An overall survey n is not automatically a routed item’s valid base. | FMI Foundation Published April 2025; exact publication day not established Physical p.7, Have family meals at home row. |
| F32 | Plans to share more family meals were reported by 54% for dinner, 43% for breakfast and 40% for lunch. Definition: Intention to increase each meal type. Qualification: These are plans, not realized 2026 or 2027 meal-sharing rates. | US grocery shoppers United States 2025-04-10 to 2025-04-16 Exact eligible item/subgroup n is not printed beside these figures. An overall survey n is not automatically a routed item’s valid base. | FMI Foundation Published April 2025; exact publication day not established Physical p.12, Future Family Meals. |
| F33 | 54% saw family meals as time with people, 52% felt more connected, 45% saw a regular routine, 33% a daily high point and 31% a calming experience. Definition: Multiple perceived experiences of family meals. Qualification: No effect size or clinical outcome was measured. | US grocery shoppers United States 2025-04-10 to 2025-04-16 Exact eligible item/subgroup n is not printed beside these figures. An overall survey n is not automatically a routed item’s valid base. | FMI Foundation Published April 2025; exact publication day not established Physical p.13, EXPERIENCE responses. |
| F34 | At home, 44% described meals at a table, 40% in the same room, 30% asking about the day, 23% excluding electronics and 18% using conversation prompts. Definition: Multiple reported practices, not mutually exclusive groups. Qualification: A table location is not proof of conversation or quality time. | US grocery shoppers United States 2025-04-10 to 2025-04-16 Exact eligible item/subgroup n is not printed beside these figures. An overall survey n is not automatically a routed item’s valid base. | FMI Foundation Published April 2025; exact publication day not established Physical p.15, Family Meals at Home. |
| F35 | Shared-meal barriers included schedules (42%), tastes (31%), preparation time (23%), unwilling companions (16%) and children’s activities (12%); 23% selected none. Definition: Multiple selections about barriers to family meals. Qualification: Schedules, tastes and time can overlap; these are not exclusive causes of missed meals. | US grocery shoppers United States 2025-04-10 to 2025-04-16 Exact eligible item/subgroup n is not printed beside these figures. An overall survey n is not automatically a routed item’s valid base. | FMI Foundation Published April 2025; exact publication day not established Physical p.17, Barriers. |
| F36 | 74% associated family meals with respectful interaction, 68% with a safe setting for difficult social issues and 66% with more civil conversation. Definition: Attitudes about conversation at family meals. Qualification: Not observed conflict reduction or a trial of dialogue techniques. | US grocery shoppers United States 2025-04-10 to 2025-04-16 Exact eligible item/subgroup n is not printed beside these figures. An overall survey n is not automatically a routed item’s valid base. | FMI Foundation Published April 2025; exact publication day not established Physical pp.23–25, published agreement NETs. |
| F37 | 61% planned more family meals because they considered them economical. Definition: Reported plan and motivation. Qualification: Not a measured saving, spending total or proof of lower grocery bills. | US grocery shoppers United States 2025-04-10 to 2025-04-16 Exact eligible item/subgroup n is not printed beside these figures. An overall survey n is not automatically a routed item’s valid base. | FMI Foundation Published April 2025; exact publication day not established Physical p.22, published agreement NET. |
| F38 | If they had more time, 33% would have more family meals and 28% would cook together more. Definition: Hypothetical multiple selections. Qualification: The separate activities can overlap and do not predict future behavior. | US grocery shoppers United States 2025-04-10 to 2025-04-16 Exact eligible item/subgroup n is not printed beside these figures. An overall survey n is not automatically a routed item’s valid base. | FMI Foundation Published April 2025; exact publication day not established Physical p.11, additional-time question. |
How frequent are family meals among Canadian students?
The Canadian school survey uses a broader threshold than daily eating: most days or every day. Its grade and gender comparisons are useful within that definition, but cannot be compared directly with a daily-only US estimate.
| ID | Finding and qualification | Population, actual period and base | Original source and locator |
|---|---|---|---|
| F39 | In grades 6–8, 85% of cisgender boys and 82% of cisgender girls ate family meals most days or every day. Definition: Most days or daily, not a daily-only measure. Qualification: Selected gender/grade groups; exact valid meal-item n unavailable. | Covered Canadian school students in grades 6–8, by gender Nine Canadian provinces and two territories; excludes New Brunswick and Nunavut 2022 and 2023 fieldwork during 2021–22 and 2022–23 school years; named 2022 cycle Exact eligible item/subgroup n is not printed beside these figures. An overall survey n is not automatically a routed item’s valid base. | Public Health Agency of Canada / Canadian HBSC team Published 2025-06-23 Figure 8.5, HTML text table; PDF physical p.116. |
| F40 | In grades 9–10, the corresponding figures were 79% for cisgender boys and 73% for cisgender girls. Definition: Most days or daily, within each named group. Qualification: These are different grade groups, not changes within the same children. | Covered Canadian school students in grades 9–10, by gender Nine Canadian provinces and two territories; excludes New Brunswick and Nunavut 2022 and 2023 fieldwork during 2021–22 and 2022–23 school years; named 2022 cycle Exact eligible item/subgroup n is not printed beside these figures. An overall survey n is not automatically a routed item’s valid base. | Public Health Agency of Canada / Canadian HBSC team Published 2025-06-23 Figure 8.5, HTML text table; PDF physical p.116. |
| F41 | Among transgender and gender-diverse students, 68% in grades 6–8 and 66% in grades 9–10 reported family meals most days or daily. Definition: TGD group as defined in the source’s sex/gender methods. Qualification: Younger-group HTML confidence bound is anomalous and is withheld. Older group interval is retained. No new significance test is inferred from the two-point gap. | Covered TGD Canadian school students in grades 6–10 Nine Canadian provinces and two territories; excludes New Brunswick and Nunavut 2022 and 2023 fieldwork during 2021–22 and 2022–23 school years; named 2022 cycle Exact eligible item/subgroup n is not printed beside these figures. An overall survey n is not automatically a routed item’s valid base. | Public Health Agency of Canada / Canadian HBSC team Published 2025-06-23 Figure 8.5, both point labels visually checked in PDF physical p.116. |
What do older Canadian time diaries show?
The official 2015-cycle findings distinguish eating alone, eating apart from a partner and eating while doing another activity. Daily eating time adds context about routines without measuring relationship quality.
| ID | Finding and qualification | Population, actual period and base | Original source and locator |
|---|---|---|---|
| F42 | 30% ate every meal alone on their diary day. Definition: All-meals-alone diary-day prevalence. Qualification: Historical 2015 covered population. Not 30% of meals, not everyone living alone and not a current Canada/US comparison. | GSS-covered people 15+ in ten provinces Canada, ten provinces 2015 GSS reference cycle; fieldwork April 7, 2015–April 6, 2016 Exact eligible item/subgroup n is not printed beside these figures. An overall survey n is not automatically a routed item’s valid base. | Statistics Canada Published 2018-03-23 Who do Canadians eat with? infographic. |
| F43 | Among people with a partner, 30% ate no meals with that partner on the diary day. Definition: Partnered-person conditional measure. Qualification: Eating apart from a partner does not mean eating alone, relationship conflict or living separately. | Partnered respondents in the GSS covered population Canada, ten provinces 2015 GSS reference cycle; fieldwork April 7, 2015–April 6, 2016 Exact eligible item/subgroup n is not printed beside these figures. An overall survey n is not automatically a routed item’s valid base. | Statistics Canada Published 2018-03-23 Who do Canadians eat with? second statement. |
| F44 | 10% reported eating only while doing another activity. Definition: All eating reported as simultaneous with something else. Qualification: This is distinct from eating alone and does not necessarily involve a screen. | GSS-covered people 15+ in ten provinces Canada, ten provinces 2015 GSS reference cycle; fieldwork April 7, 2015–April 6, 2016 Exact eligible item/subgroup n is not printed beside these figures. An overall survey n is not automatically a routed item’s valid base. | Statistics Canada Published 2018-03-23 Final distracted-eating statement. |
| F45 | Average time eating was 91 minutes per day; the average meal lasted 44 minutes. Definition: Population time allocation and mean meal duration. Qualification: These are rounded separate summaries; do not infer a meal count by dividing them or assume every minute was social. | GSS-covered people 15+ in ten provinces Canada, ten provinces 2015 GSS reference cycle; fieldwork April 7, 2015–April 6, 2016 Exact eligible item/subgroup n is not printed beside these figures. An overall survey n is not automatically a routed item’s valid base. | Statistics Canada Published 2018-03-23 Opening infographic statements. |
| F46 | Average daily eating time was 105 minutes in Quebec, 91 in Atlantic Canada and British Columbia, and 84 in Ontario and the Prairies. Definition: Daily eating time, not shared-meal duration. Qualification: Regional time differences alone do not measure connection, companionship or wellbeing. | GSS-covered people 15+ by region Canada, ten provinces 2015 GSS reference cycle; fieldwork April 7, 2015–April 6, 2016 Exact eligible item/subgroup n is not printed beside these figures. An overall survey n is not automatically a routed item’s valid base. | Statistics Canada Published 2018-03-23 Region/minutes-per-day infographic table. |
How much does the definition of a family meal matter?
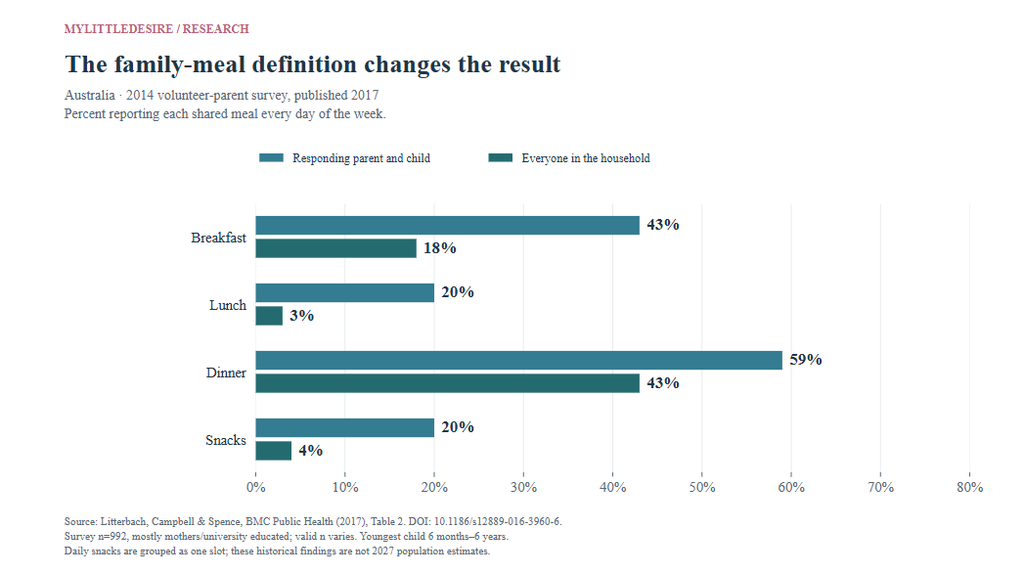
The Australian volunteer survey asked about both a responding parent eating with their child and everyone in the household eating together. Daily dinner prevalence was 59% under the first measure and 43% under the second. This is a historical measurement example, with a 16-point descriptive difference.
| ID | Finding and qualification | Population, actual period and base | Original source and locator |
|---|---|---|---|
| F47 | Daily responding parent and child meals were reported at 43% for breakfast, 20% for lunch, 59% for dinner, 20% for snacks. Definition: Every day in a week, separately by meal type; snacks grouped as one daily slot. Qualification: Historical convenience sample. Item-valid subsets can differ, and the meal definition must travel with every percentage. | Australian parent volunteers with a youngest child aged 6 months–6 years Australia 2014 Exact eligible item/subgroup n is not printed beside these figures. An overall survey n is not automatically a routed item’s valid base. | Litterbach, Campbell and Spence / Deakin University Published 2017-01-24 Table 2, 7 days/week row for the named definition. |
| F48 | Daily everyone in the household meals were reported at 18% for breakfast, 3% for lunch, 43% for dinner, 4% for snacks. Definition: Every day in a week, separately by meal type; snacks grouped as one daily slot. Qualification: Historical convenience sample. Item-valid subsets can differ, and the meal definition must travel with every percentage. | Australian parent volunteers with a youngest child aged 6 months–6 years Australia 2014 Exact eligible item/subgroup n is not printed beside these figures. An overall survey n is not automatically a routed item’s valid base. | Litterbach, Campbell and Spence / Deakin University Published 2017-01-24 Table 2, 7 days/week row for the named definition. |
| F49 | 4% shared fewer than seven parent–child eating occasions weekly; 43% shared 21–28. Definition: Breakfast, lunch, dinner and one snack slot per day, maximum 28. Qualification: A shared occasion is not necessarily the whole household dining together. | Australian parent volunteers in the summed-frequency item Australia 2014 Exact eligible item/subgroup n is not printed beside these figures. An overall survey n is not automatically a routed item’s valid base. | Litterbach, Campbell and Spence / Deakin University Published 2017-01-24 Table 2, summed-frequency rows, respondent and child. |
| F50 | Whole-household eating occasions were below seven weekly for 17%, seven to under 14 for 48%, 14 to under 21 for 26%, and 21–28 for 9%. Definition: Same four daily meal slots, stricter household-presence definition. Qualification: Do not assume an exact paired person-level gap from these aggregate distributions. | Australian parent volunteers in the whole-household frequency item Australia 2014 Exact eligible item/subgroup n is not printed beside these figures. An overall survey n is not automatically a routed item’s valid base. | Litterbach, Campbell and Spence / Deakin University Published 2017-01-24 Table 2, summed-frequency rows, everyone in the house. |
| F51 | Common dinner times were 6 p.m. (28%), 5:30 p.m. (26%) and 6:30 p.m. (17%). Definition: Typical reported dinner time; item n=737. Qualification: Not an optimum time recommendation or a national Australian schedule. | Australian volunteer parents answering dinner-time question Australia 2014 Published input base(s): 737. An overall survey n is not automatically a routed item’s valid base. | Litterbach, Campbell and Spence / Deakin University Published 2017-01-24 Results: Time and duration of the evening meal. |
| F52 | Half reported a typical evening meal lasting 30 minutes; reported durations ranged from 10 to 60 minutes. Definition: Duration item n=864, separate from timing item. Qualification: The 50% describes an exact reported duration, not a 30-minute causal threshold. | Australian volunteer parents answering meal-duration question Australia 2014 Published input base(s): 864. An overall survey n is not automatically a routed item’s valid base. | Litterbach, Campbell and Spence / Deakin University Published 2017-01-24 Results: Time and duration of the evening meal. |
| F53 | 58% considered family meals very important and 34% quite important. Definition: Two importance categories. Qualification: Attitudes do not establish daily participation or a treatment effect. | Australian volunteer parents answering importance item Australia 2014 Exact eligible item/subgroup n is not printed beside these figures. An overall survey n is not automatically a routed item’s valid base. | Litterbach, Campbell and Spence / Deakin University Published 2017-01-24 Results: Parent perceived importance of family meals. |
| F54 | 64% reported TV during fewer than seven weekly eating occasions; 22% at seven to under 14, 10% at 14 to under 21 and 3% at 21–28. Definition: Weekly TV-associated meal/snack slots, as the table labels them. Qualification: Rounded totals are 99. The narrative’s one-or-fewer-per-day shorthand is not substituted for the table threshold. | Australian volunteer parents answering mealtime-TV items Australia 2014 Published input base(s): 946. An overall survey n is not automatically a routed item’s valid base. | Litterbach, Campbell and Spence / Deakin University Published 2017-01-24 Table 3, summed weekly TV frequency; valid n=946. |
| F55 | About seven in ten ate the same food as their child on at least five evenings weekly. Definition: Same foods is a food-content measure, separate from co-presence. Qualification: Source gives an approximate description. Do not assume this means every household member ate together. | Australian volunteer parents answering same-food item Australia 2014 Exact eligible item/subgroup n is not printed beside these figures. An overall survey n is not automatically a routed item’s valid base. | Litterbach, Campbell and Spence / Deakin University Published 2017-01-24 Results: Parent eating the same food as their child. |
Who shares children’s breakfasts, and how much time is available?
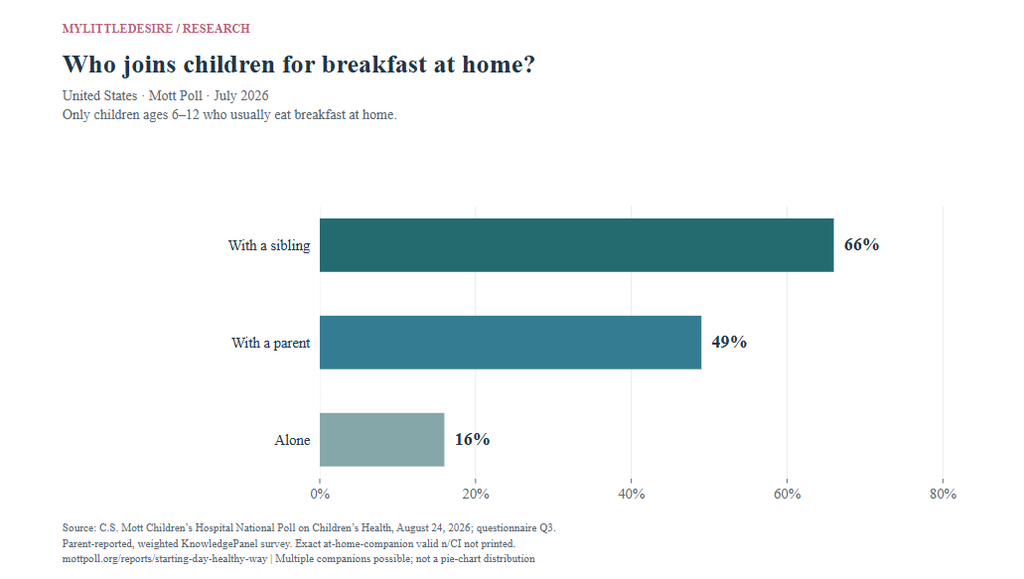
The Mott questionnaire makes an important distinction: its companion question applies only to children who usually eat breakfast at home. Siblings and parents can both be present. These figures describe that routed group rather than every US child.
| ID | Finding and qualification | Population, actual period and base | Original source and locator |
|---|---|---|---|
| F56 | On school days, 68% usually ate breakfast at home, 23% at school, 5% en route and 4% usually skipped it. Definition: Parent report of the selected 6–12-year-old’s usual school-day breakfast location. Qualification: School breakfast does not establish whether a child ate alone or with others. | US parents of selected children 6–12 United States July 2026 Exact eligible item/subgroup n is not printed beside these figures. An overall survey n is not automatically a routed item’s valid base. | University of Michigan, C.S. Mott Children’s Hospital / Ipsos Published 2026-08-24 Report opening results; questionnaire Q1, physical p.1. |
| F57 | In the at-home-breakfast group, 66% ate with a sibling, 49% with a parent and 16% alone. Definition: Conditional on usual breakfast at home; parent and sibling can both be selected. Qualification: Not all US children or all 1,037 respondents. Exact routed valid n not printed. The percentages must not be combined into a pie chart. | US parents whose selected child 6–12 usually eats breakfast at home United States July 2026 Exact eligible item/subgroup n is not printed beside these figures. An overall survey n is not automatically a routed item’s valid base. | University of Michigan, C.S. Mott Children’s Hospital / Ipsos Published 2026-08-24 Report opening results, interpreted with questionnaire Q3 routing (Q1=home), physical p.1. |
| F58 | 35% had no more than 15 minutes for breakfast, 47% had 15–25 minutes and 19% had 30 minutes or more. Definition: Available breakfast time, not time spent talking. Qualification: Published categories overlap at 15 minutes and rounded percentages total 101. No reclassification into new mutually exclusive bins. | US parents of selected children 6–12 United States July 2026 Exact eligible item/subgroup n is not printed beside these figures. An overall survey n is not automatically a routed item’s valid base. | University of Michigan, C.S. Mott Children’s Hospital / Ipsos Published 2026-08-24 Report results; questionnaire Q2, physical p.1. |
| F59 | Among breakfast-eating children, parents cited lack of time (30%) and screen distractions (11%) as healthy-breakfast barriers. Definition: Multiple-response barriers to a healthy breakfast. Qualification: Not direct reasons for eating alone or for missing shared meals. Routed item n unavailable. | Parents of selected children 6–12 who usually eat breakfast United States July 2026 Exact eligible item/subgroup n is not printed beside these figures. An overall survey n is not automatically a routed item’s valid base. | University of Michigan, C.S. Mott Children’s Hospital / Ipsos Published 2026-08-24 Report results; questionnaire Q8 routing (Q1=home, en route or school), physical p.2. |
What share of US children have daily whole-family meals?
In the 2023–2024 NSCH table, 45.8% of children had all co-resident family members eat together every day in the preceding week. The weights represent children, so this must not be described as 45.8% of families.
| ID | Finding and qualification | Population, actual period and base | Original source and locator |
|---|---|---|---|
| F60 | For 2023–2024, 45.8% of children had all co-resident family members eat together daily, 27.7% on 4–6 days, 23.1% on 1–3 days and 3.4% on no days. Definition: Child-weighted shares for days in the preceding week; all household family members present. Qualification: Not percentages of families. Excludes missing item responses; do not compare the 45.8% directly with the looser Canadian most-days threshold. | US children 0–17 represented by eligible parent/guardian responses United States 2023–2024 Exact eligible item/subgroup n is not printed beside these figures. An overall survey n is not automatically a routed item’s valid base. | HRSA / US Census Bureau; CAHMI Data Resource Center analysis Published 2023–2024 combined release; exact page publication date not established National table: percentages, 95% CIs and sample counts; K8Q11/Indicator 6.9. |
22 comparisons with reproducible inputs
The contrasts below are descriptive. A larger percentage-point rise need not be the larger relative percentage rise. None is a new causal estimate, and rounded source values limit precision.
| ID | Comparison | Arithmetic and unit | Original inputs and qualification |
|---|---|---|---|
| C01 | US: shared dinners minus lunches weekly | 4.7 − 3.2 = 1.5 meals/week | F01 / F01 Matched survey meal types and target-country 2022 period. Rounded means; no new significance claim. |
| C02 | UK: shared dinners minus lunches weekly | 4.2 − 3.2 = 1.0 meals/week | F02 / F02 Matched survey meal types and target-country 2022 period. Rounded means; no new significance claim. |
| C03 | Canada: shared dinners minus lunches weekly | 4.8 − 3.6 = 1.2 meals/week | F03 / F03 Matched survey meal types and target-country 2022 period. Rounded means; no new significance claim. |
| C04 | Australia: shared dinners minus lunches weekly | 4.9 − 3.6 = 1.3 meals/week | F04 / F04 Matched survey meal types and target-country 2022 period. Rounded means; no new significance claim. |
| C05 | Australia minus UK total | 8.5 − 7.5 = 1.0 meals/week | F04 / F02 Matched Gallup lunch+dinner measure, 2022 target-country data; point difference is not a statistically established ranking. |
| C06 | Canada minus US total | 8.4 − 7.9 = 0.5 meals/week | F03 / F01 Matched Gallup lunch+dinner measure, 2022 target-country data; point difference is not a statistically established ranking. |
| C07 | Breakfast: daily parent–child minus whole-household prevalence | 43 − 18 = 25.0 percentage points | F47 / F48 2014 Australian convenience sample. Distinct measure definitions/item subsets; not exact paired household discordance. |
| C08 | Lunch: daily parent–child minus whole-household prevalence | 20 − 3 = 17.0 percentage points | F47 / F48 2014 Australian convenience sample. Distinct measure definitions/item subsets; not exact paired household discordance. |
| C09 | Dinner: daily parent–child minus whole-household prevalence | 59 − 43 = 16.0 percentage points | F47 / F48 2014 Australian convenience sample. Distinct measure definitions/item subsets; not exact paired household discordance. |
| C10 | Snacks: daily parent–child minus whole-household prevalence | 20 − 4 = 16.0 percentage points | F47 / F48 2014 Australian convenience sample. Distinct measure definitions/item subsets; not exact paired household discordance. |
| C11 | Lives with others: 2023 minus 2003 solo-eating-day rate | 18 − 12 = 6.0 percentage points | F11 / F11 Rounded endpoints. Absolute point change within the same household definition. |
| C12 | Lives alone: 2023 minus 2003 solo-eating-day rate | 69 − 55 = 14.0 percentage points | F12 / F12 Rounded endpoints. Absolute and relative change answer different questions. |
| C13 | Lives with others: relative solo-eating-day rise | (18 − 12) / 12 × 100 = 50.0 relative percent change | F11 / F11 Calculated from rounded 18 and 12. Describes repeated cross-sections, not individuals. |
| C14 | Lives alone: relative solo-eating-day rise | (69 − 55) / 55 × 100 = 25.5 relative percent change | F12 / F12 Calculated from rounded 69 and 55, yielding 25.5%; authors describe approximately 25%. Neither is a new exact microdata estimate. |
| C15 | At-home breakfast: sibling minus parent companion prevalence | 66 − 49 = 17.0 percentage points | F57 / F57 Home-breakfast eligible group only. Responses overlap; not the fraction with a sibling but no parent. |
| C16 | Family-meal barriers: schedules minus preparation time | 42 − 23 = 19.0 percentage points | F35 / F35 2025 grocery shoppers; overlapping multiple responses, not attributable fractions. |
| C17 | Family-meal barriers: schedules minus tastes | 42 − 31 = 11.0 percentage points | F35 / F35 Different barriers may be selected by the same shopper. |
| C18 | Future sharing: dinner minus breakfast intentions | 54 − 43 = 11.0 percentage points | F32 / F32 Intended increase, not actual meal-sharing prevalence. |
| C19 | Younger versus older grades: cisgender boys | 85 − 79 = 6.0 percentage points | F39 / F40 Different grade groups in one survey cycle, not a longitudinal decline or new significance test. |
| C20 | Younger versus older grades: cisgender girls | 82 − 73 = 9.0 percentage points | F39 / F40 Most days/daily threshold, not daily-only. Original intervals retained separately. |
| C21 | Global age contrast: under 30 minus 60+ shared meals | 7.7 − 6.6 = 1.1 meals/week | F05 / F05 Cross-sectional global lunch/dinner averages; not a universal age trajectory. |
| C22 | Life evaluation: one shared meal versus none | 5.2 − 4.9 = 0.3 points on 0–10 scale | F07 / F07 0–10 life-evaluation points; association, not the effect of adding a meal. |
Common questions about shared meals
How many meals do Americans share each week?
The Gallup US profile averages 7.9 shared lunches and dinners weekly, based on 2022 observations. Breakfast is excluded, so this is not the number of all weekly meals eaten together. Original source.
Does eating alone mean living alone?
No. The US ATUS analysis reports that 18% of adults living with others ate all recorded meals alone on their 2023 diary day. It measures one day, not permanent isolation. Original source.
Do most children eat breakfast with a parent?
The Mott July 2026 report gives 49% with a parent in the at-home-breakfast group. The questionnaire routes that question to children who usually eat breakfast at home, and sibling responses can overlap. It is not a rate for all US children. Original source.
Why do family-meal statistics disagree?
Definitions differ. In the historical Australian sample, daily dinner was 59% for the responding parent and child but 43% for everyone in the household. Sample, year and threshold also matter. Original source.
What is a percentage-point increase compared with a percentage increase?
The ATUS living-with-others estimate rose from 12% to 18%. That is 6 percentage points, or a 50.0% relative increase calculated from the rounded endpoints. Both describe the same comparison with different units. Original source.
Do shared meals cause better mental health?
The selected observational and attitude studies do not establish that claim. Reported stress perceptions, wellbeing associations and meal-sharing behavior should each be described under their own research design. Original source.
Methodology and limitations
Source selection
We selected accessible original government analyses, research papers, original survey reports and published questionnaires. Each finding has a direct source, locator, actual data period, eligible population, definition and qualification. Published country-table labels and the Canadian family-meal figure were visually checked.
What the count means
This resource contains 60 grouped findings and 151 numeric inputs from ten source records. Findings can include related categories or subgroup comparisons from one question. These are not 60 studies. The largest source contribution is ten findings. WHR 2025 and the 2026 peer-reviewed follow-up contain overlapping Gallup/ATUS research, which is not counted as an independent replication.
Geography and timing
The four target-country Gallup profiles use 2022 observations, because those countries were not in the 17-country 2023 repeat list. The Canadian HBSC 2022 cycle collected data in 2022 and 2023. The 2015 Canadian time-use cycle was fielded April 2015–April 2016. Historical UK and Australian surveys are explicitly dated. A publication year is not a fieldwork year.
Sampling and eligible groups
The Australian 2014 survey is a convenience sample, largely mothers and university-educated parents. The UK survey is a balanced panel. FMI covers grocery shoppers and gives limited recruitment/weighting information. AHA supplies limited recruitment detail. Mott’s report block contains 1,037 parents but its at-home-breakfast question has a narrower routed base. Overall survey n is never substituted for an undisclosed subgroup n.
Uncertainty and inconsistencies
Original intervals are retained in the numeric input sheet when available. Missing n, confidence intervals, standard errors and standard deviations remain blank. The Canadian younger-TGD HTML interval contains an anomalous lower bound and is withheld rather than corrected. Australian narrative/table inconsistencies for snack-frequency NETs, dinner location and TV shorthand are documented in the holdouts. Only independently checked measures are used.
What MyLittleDesire contributed
We created four branded charts and 22 reproducible descriptive comparisons, with source input IDs and units. This is organization and synthesis of existing evidence, not original fieldwork. Some contrasts are already apparent in the original publications; they are not new scientific discoveries. Percentage-point change, relative percentage change and differences in mean weekly meals remain distinct.
Limits of inference
Observational associations and perceived benefits do not prove that shared meals cause better health, happiness or relationship outcomes. Separate response margins do not identify individual overlaps. Different question-valid subsets do not establish paired household disagreement. No new significance tests, confidence intervals, national extrapolations or microdata estimates were calculated.
The 2027 edition
2027 identifies the editorial edition. Sources were reviewed October 31, 2026. This does not imply 2027 fieldwork, projections or a future publication date. The newer NSCH combined wave is advertised, but its meal estimate was not retrieved; the selected result stays 2023–2024. Dates should change only following a real review or substantive update.
Related research on social connection
Friendship Statistics covers friendship counts, quality and support networks. Loneliness Statistics covers loneliness prevalence and measurement. Teen Friendship and Peer Support Statistics examines young people’s social ties. Eating alone is one behavior and is not itself a loneliness diagnosis.
Complete original-source bibliography
- S01 · World Happiness Report / Gallup. Sharing meals with others: How sharing meals supports happiness and social connections.
Published 2025-03-20. Data period: 2022; repeated in 17 countries in 2023.
Population: Gallup World Poll covered residents 15+; valid analytic bases differ by table
Method: Nationally representative weighted Gallup samples. More than 150,000 respondents across the meal-sharing module. Respondents recalled lunches and dinners with someone they knew during the previous seven days. Appendix Tables A1/A2 and narrative inspected; country-table row labels visually checked.
Limits: Two meal slots per day give a maximum of 14 shared lunches/dinners, not 21 total weekly meals. Breakfast is excluded. Someone known need not be a relative or housemate. Country figures are rounded means without printed country-level intervals. Target countries were not in the 17-country 2023 repeat list. The Ajinomoto Group funded the module. Cross-sectional associations are not causal. The 2026 paper repeats this underlying research, not an independent replication.
Supporting document 1 · Supporting document 2 · Supporting document 3 - S02 · De Neve, Dugan, Kaats and Prati / Scientific Reports. Sharing meals is associated with greater wellbeing: Study 2, American Time Use Survey.
Published 2026-04-22; version of record 2026-06-17. Data period: 2003–2023 ATUS; selected 2003/2023 comparisons.
Population: Adults in the authors’ ATUS analysis; weighted diary-day respondents, not every meal occasion
Method: Secondary observational analysis of BLS/Census time diaries. Eating/drinking as the primary activity identifies dining periods; all such periods alone on the previous day defines the person-day outcome. Figure 6 household-composition analysis n=234,143, not the n for each annual subgroup; other models have different bases. Methods list 239,272 unique respondents and 1,307,107 broader eating/preparation/cooking episodes.
Limits: An all-meals-alone day is not habitual loneliness, living alone or every meal eaten alone over a week. Rounded endpoints are descriptive. The reported living-alone adjustment is not a causal decomposition. These ATUS data also appear in WHR 2025 and are counted once. No microdata reanalysis or newly estimated uncertainty was performed.
Supporting document 1 · Supporting document 2 - S03 · R. I. M. Dunbar / University of Oxford. Breaking Bread: the Functions of Social Eating.
Published 2017-03-11. Data period: One week in April 2016.
Population: OnePoll panel adults over 18, balanced by region, age and gender
Method: Stratified commissioned online-panel survey in collaboration with the Big Lunch project. Recalled meals, attitudes and support networks; individual analytic bases vary. Results narrative and original Table 2 inspected.
Limits: Historical survey, not a 2027 prevalence estimate. Panel balancing does not establish random probability sampling. Six-month non-contact, never eating with a category, and last social lunch/dinner have different reference periods. Path analysis of this survey cannot establish causality. Recalled behaviors are self-reported.
Supporting document 1 - S04 · American Heart Association / Wakefield Research. AHA Family Meals Survey.
Published 2022-10-10. Data period: 2022-09-14 to 2022-09-20.
Population: US adults 18+; parent and employed-person items have narrower eligible bases
Method: Email invitation and online survey. Sponsor describes the sample as nationally representative and reports an overall ±3.1 percentage-point sampling margin. Recruitment/weighting detail is limited in the accessible release.
Limits: Parent and employed-person valid n and intervals are not given. Overall n and margin must not be applied to those subgroups. Perceived stress relief and healthier food choices are reports of attitudes/behavior, not measured treatment effects or proof of disease prevention. - S05 · FMI Foundation. Family Meals Barometer: April 2025 Update.
Published April 2025; exact publication day not established. Data period: 2025-04-10 to 2025-04-16.
Population: National online sample of grocery shoppers
Method: Public original 28-page report, including methodology on physical p.27. Multiple-response practices/benefits/barriers, retrospective behavior and future intentions. Grocery shoppers are the report population, not automatically all US adults.
Limits: Industry-sponsored research. Recruitment, weighting, response rate and item-level bases/uncertainty are not supplied. Statements about connection and benefits are respondents’ perceptions, not an intervention test. Future intentions are not realized behavior. Conditional family-connection items with unclear routing are omitted.
Supporting document 1 - S06 · Public Health Agency of Canada / Canadian HBSC team. The health of young people in Canada: Focus on mental health, Figure 8.5.
Published 2025-06-23. Data period: 2022 and 2023 fieldwork during 2021–22 and 2022–23 school years; named 2022 cycle.
Population: School students in grades 6–10; grade/gender subgroup valid meal-item n not printed
Method: School/classroom survey, online or paper. 317 schools and 26,360 students overall; 25,943 reported grade/gender for Table 1.1. Figure 8.5 and physical PDF p.116 visually checked. Published intervals retained where internally consistent.
Limits: Most days OR every day is broader than strictly daily. Not every young person in Canada is covered. TGD means transgender and gender-diverse, based on reported sex assigned at birth and gender identity. The younger-TGD HTML interval has an anomalous 32.8 lower bound inconsistent with the plotted uncertainty; that interval is withheld, not silently corrected. Points are verified independently in the figure. Cross-sectional grades are not a panel trend.
Supporting document 1 - S07 · Statistics Canada. Time to eat.
Published 2018-03-23. Data period: 2015 GSS reference cycle; fieldwork April 7, 2015–April 6, 2016.
Population: Non-institutionalized people 15+; partnered-person item is conditional
Method: Original official infographic with time-use diary findings. GSS Cycle 29 sampling and coverage documentation reviewed. Selected infographic item n and uncertainty are not printed.
Limits: Archived historical findings. All daily meals alone refers to the diary day, not a permanent personal trait. Time spent eating measures time allocation, not social-connection quality. Partnered respondents are a separate denominator. Distracted eating and solo eating can overlap.
Supporting document 1 - S08 · Litterbach, Campbell and Spence / Deakin University. Family meals with young children: an online study of family mealtime characteristics, among Australian families with children aged six months to six years.
Published 2017-01-24. Data period: 2014.
Population: Parents of a youngest eligible child aged six months to six years; 97% mothers and 71% university educated
Method: Online convenience recruitment through parenting blogs and Facebook. Respondents completed at least one relevant item, so valid n varies. Family frequency n=958; timing n=737; duration n=864. Original results and Table 2 inspected.
Limits: Not a nationally representative Australian sample. Reporting parent plus child differs from everyone in the household. Different questions may have different valid respondent subsets; gaps are differences between margins, not paired household-level discordance estimates. Rounded categories can fail to match published narrative NETs. Meal slots include one aggregated snack slot daily, up to 28 occasions/week.
Supporting document 1 · Supporting document 2 - S09 · University of Michigan, C.S. Mott Children’s Hospital / Ipsos. Starting the day in a healthy way.
Published 2026-08-24. Data period: July 2026.
Population: Parents with a child 6–12; at-home-breakfast and breakfast-eating subsets depend on routing
Method: Weighted Ipsos KnowledgePanel household survey. Overall parent survey n=2,027, completion 69%; report block n=1,037. Sponsor reports ±1–4 percentage points, depending on result. Published questionnaire p.1 routes companion Q3 only to Q1=home; Q8 barriers only to children usually eating breakfast.
Limits: Companion percentages are among the at-home-breakfast eligible group, not all US children 6–12. Parent and sibling responses may overlap. Exact routed valid n and item-specific intervals are not printed. The Q2 time categories overlap at 15 minutes as published; do not rebin. Barriers concern a healthy breakfast, not a direct measure of why shared meals are missed.
Supporting document 1 - S10 · HRSA / US Census Bureau; CAHMI Data Resource Center analysis. 2023–2024 NSCH, Indicator 6.9: Family eats meals together.
Published 2023–2024 combined release; exact page publication date not established. Data period: 2023–2024.
Population: Children 0–17, represented by parent/guardian responses
Method: Weighted household survey administered by the US Census Bureau. One child selected per household. Item K8Q11 asks days in the previous week when all co-resident family members ate a meal together. Original national table, weighted estimates, category counts and 95% CIs inspected.
Limits: Estimates represent children, not a percentage of families or parents. Item missing values excluded. The unweighted category counts sum to 104,575 valid responses, a calculated total rather than a source-wide sample n. 2024–2025 availability is advertised on the site, but this newer meal estimate was not retrieved; the selected period stays 2023–2024.
How to cite this resource
MyLittleDesire. Shared Meals & Social Connection Statistics 2027. https://mylittledesire.com/shared-meals-social-connection-statistics/.