
Couples can share bills, own joint accounts and still divide financial responsibilities in very different ways. This resource brings together original research on account choices, money conversations, financial roles, shared goals and pressure within relationships.
60 grouped findings from 10 original-source publications, with 138 numeric inputs, 20 transparent descriptive calculations and four MyLittleDesire charts. The evidence covers the United States, United Kingdom, Canada and Australia. It combines government-data analyses, an academic panel study and original commissioned surveys.
What are the key couples’ money management statistics?
23%
38% / 36% / 26%
Had no joint account in the Census Bureau’s eligible married-couple population in 2023. Original source [S01].
Reported fully joint, mixed, or fully separate accounts in Bankrate’s partnered survey. Original source [S02].
91% vs. 29%
29% vs. 20%
Felt able to talk openly versus regularly discussing day-to-day finances. Original source [S03].
Wanted planning time versus reporting that they provided it. Separate marginal questions. Original source [S03].
58%
36%
Reported unequal contributions to household finances. Original source [S03].
Lacked a clear understanding of their partner’s pension savings. Original source [S04].
81%
75%
Described themselves as financially compatible in the couple-labeled survey results. Original source [S05].
Discussed money weekly or a few times monthly. Other frequencies are not classified here. Original source [S05].
77%
26%
Agreed they were stressed about money. N/A answers were excluded. Original source [S06].
Discussed improving finances but did not know the next step. Original source [S06].
29% vs. 33%
29%
Had joint-only accounts in 2014 versus 2002 in the selected HILDA sample. Original source [S08].
Of eligible marriages had spouses each earning 40%–60% of combined earnings. Original source [S10].
What does “managing money together” actually measure?
Account ownership, financial contributions and decision-making describe different parts of a couple’s financial life. A joint account does not establish equal decision power, and separate accounts do not establish secrecy.
| Measure | What it describes | What it does not establish |
|---|---|---|
| Any joint account | At least one shared account, possibly alongside individual accounts. | All money is pooled. |
| All-joint accounts | All accounts covered by a particular question are jointly held. | Equal income, access in practice or equal decision power. |
| Mixed accounts | Some joint and some individual accounts. | Financial deception or a lack of commitment. |
| Equal financial contributions | A reported division of household funding. | Equal unpaid work, equal opportunity or perceived fairness. |
| Egalitarian earnings in Pew | Each spouse earns 40%–60% of combined earnings. | Exactly equal earnings, all income, wealth or control. |
| Money discussion frequency | How often a defined financial topic is discussed. | Communication quality or agreement. |
| Financial compatibility | A respondent’s perception of alignment. | An objective test of financial skill or relationship health. |
| Financial role | Who handles administration or takes primary responsibility. | Who has the final say in major decisions. |
| Support given/wanted | Separate distributions of reported actions and preferences. | Individual overlap, satisfaction or matched-partner deficits. |
| Percentage-point difference | One percentage minus another, preserving definitions and bases. | A percent increase, causal effect or new significance test. |
ALSO READ:-
Cyberbullying And Online Social Relationships Statistics 2027
Teen Friendship And Peer Support Statistics 2027
Couples Therapy and Counseling Statistics 2027
Sibling Relationship Statistics 2027
How many US couples use joint or separate accounts?
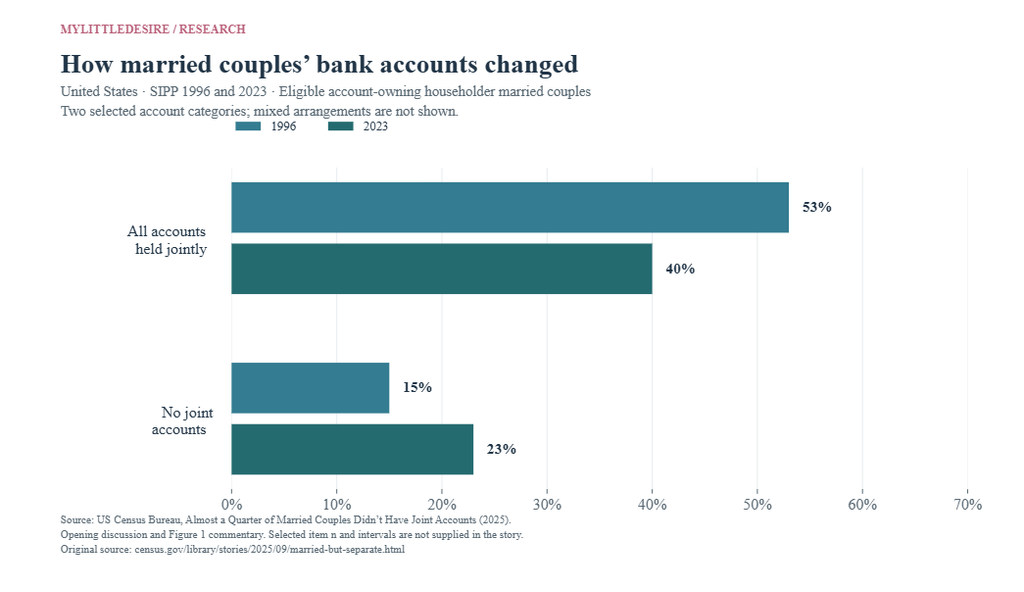
The Census Bureau’s historical account records and Bankrate’s newer survey answer related questions for different populations. The Census figures concern eligible householder couples with financial-institution assets. Bankrate includes married, civil-partnered and live-in partners. Their percentages should not be spliced into a single annual trend.
| ID | Finding and qualification | Population, actual period and base | Original source and locator |
|---|---|---|---|
| F01 | The share without any joint account rose from 15% in 1996 to 23% in 2023; any-joint ownership fell from 85% to 77%. Definition: Any joint financial-institution account held with a spouse. Qualification: Eligible account-owning householder married couples; not every US married couple. | Householder married couples owning assets at financial institutions; specified opposite-sex and unmarried subgroups United States SIPP 1996 and 2023; subgroup comparisons 2023 Item/subgroup bases are not provided alongside these estimates. Overall report size is not the valid base for every item. | US Census Bureau Published 2025-09-24 Opening paragraphs; Figure 1 discussion. |
| F02 | All-joint account ownership fell from 53% in 1996 to 40% in 2023. Definition: All bank accounts held jointly. Qualification: Eligible account-owning householder married couples; not every US married couple. | Householder married couples owning assets at financial institutions; specified opposite-sex and unmarried subgroups United States SIPP 1996 and 2023; subgroup comparisons 2023 Item/subgroup bases are not provided alongside these estimates. Overall report size is not the valid base for every item. | US Census Bureau Published 2025-09-24 Paragraph beginning In 1996, just over half; Figure 1. |
| F03 | Among opposite-sex married couples, all-joint ownership was 47% when the wife married at ages 20–24, versus 29% at ages 30–34. Definition: Wife’s age when married, not her current age. Qualification: Unadjusted cross-sectional groups; does not establish that marrying later causes account separation. | Opposite-sex married account-owning householder couples; wife’s marriage-age subgroups United States SIPP 2023 Item/subgroup bases are not provided alongside these estimates. Overall report size is not the valid base for every item. | US Census Bureau Published 2025-09-24 Reasons for Separate Finances; Figure 2 discussion. |
| F04 | Any-joint ownership was 79% for couples married 9–13 years, versus 68% for those married 4–8 years. Definition: Marriage-duration groups in the same survey. Qualification: A cross-sectional duration contrast, not a tracked transition from separate to joint accounts. | Householder married couples owning assets at financial institutions; specified opposite-sex and unmarried subgroups United States SIPP 2023 Item/subgroup bases are not provided alongside these estimates. Overall report size is not the valid base for every item. | US Census Bureau Published 2025-09-24 Reasons for Separate Finances; Figure 3 discussion. |
| F05 | Joint ownership was 75% among opposite-sex couples with minor children, versus 64% among child-bearing-age couples without children. Definition: Specified parental/age subgroups in the original story. Qualification: Comparison has stated child-bearing-age eligibility; it is not all childless couples of every age. | Opposite-sex account-owning householder couples; source-specified parental/child-bearing-age groups United States SIPP 2023 Item/subgroup bases are not provided alongside these estimates. Overall report size is not the valid base for every item. | US Census Bureau Published 2025-09-24 Reasons for Separate Finances; paragraph after Figure 3. |
| F06 | Joint ownership was 73% among remarried divorcees, versus 79% among spouses who had never divorced. Definition: Prior-divorce history in current marriages. Qualification: No adjustment for age, duration or assets; not evidence of mistrust or remarriage quality. | Householder married couples owning assets at financial institutions; specified opposite-sex and unmarried subgroups United States SIPP 2023 Item/subgroup bases are not provided alongside these estimates. Overall report size is not the valid base for every item. | US Census Bureau Published 2025-09-24 Divorcees or Living Together Unmarried. |
| F07 | 16% of unmarried householder couples had joint accounts; the figure was 25% among those living with minor children. Definition: Joint bank-account ownership among unmarried householder couples. Qualification: The parents are a subset of the overall unmarried group, not a separate non-overlapping comparator. | Unmarried householder couples; minor-child subset separately identified United States SIPP 2023 Item/subgroup bases are not provided alongside these estimates. Overall report size is not the valid base for every item. | US Census Bureau Published 2025-09-24 Divorcees or Living Together Unmarried; last substantive paragraph. |
| F08 | Among joint-account holders, the share also using individual accounts rose from 37% in 1996 to 49% in 2023. Definition: Conditional share among couples with at least one joint account. Qualification: 49% is not the share of all married couples with mixed accounts; preserve the conditional denominator. | Householder married couples owning assets at financial institutions; specified opposite-sex and unmarried subgroups United States SIPP 1996 and 2023; subgroup comparisons 2023 Item/subgroup bases are not provided alongside these estimates. Overall report size is not the valid base for every item. | US Census Bureau Published 2025-09-24 Paragraph beginning Couples with a mix of joint and solo accounts. |
For the wider relationship context, see cohabitation and living together statistics. The account figures here keep married and unmarried eligibility separate.
How do account choices vary across generations?
Bankrate’s December 2025 survey found more complete separation among younger respondents. It also found more complete pooling among older respondents. These groups were surveyed at one point in time; the comparison cannot tell us how a particular couple will manage money later.
| ID | Finding and qualification | Population, actual period and base | Original source and locator |
|---|---|---|---|
| F09 | 38% fully combined their accounts, 36% had joint and separate accounts, and 26% kept all accounts separate. Together, 62% retained some separation. Definition: Account arrangement among committed live-in relationships. Qualification: 62% overlaps the 36% and 26% components; do not treat it as a fourth exclusive category. | Married, civil-partnered or living with a romantic partner; adult participants United States 2025-12-02 to 2025-12-08 Overall report n=1,208. Item/subgroup bases are not provided alongside these estimates. Overall report size is not the valid base for every item. | Bankrate / YouGov Published 2026-02-09 Less than 40% of couples completely combine finances. |
| F10 | Completely separate accounts were reported by 51% of Gen Z, 34% of millennials, 23% of Gen X and 15% of baby boomers. Definition: Publisher age bands: Gen Z 18–29; millennials 30–45; Gen X 46–61; boomers 62–80. Qualification: Cross-sectional age/generation labels published in 2026; not individual change or a causal generation effect. | Married, civil-partnered or living with a romantic partner; adult participants United States 2025-12-02 to 2025-12-08 Overall report n=1,208. Item/subgroup bases are not provided alongside these estimates. Overall report size is not the valid base for every item. | Bankrate / YouGov Published 2026-02-09 Keeping completely separate accounts decreases with age. |
| F11 | Fully combined accounts were reported by 22% of Gen Z, 32% of millennials, 40% of Gen X and 45% of baby boomers. Definition: Same publisher generation bands as F10. Qualification: Other respondents used mixed arrangements; do not assume fully joint and fully separate exhaust the answers. | Married, civil-partnered or living with a romantic partner; adult participants United States 2025-12-02 to 2025-12-08 Overall report n=1,208. Item/subgroup bases are not provided alongside these estimates. Overall report size is not the valid base for every item. | Bankrate / YouGov Published 2026-02-09 Keeping completely separate accounts decreases with age; second paragraph. |
What do couples want from money conversations and financial support?
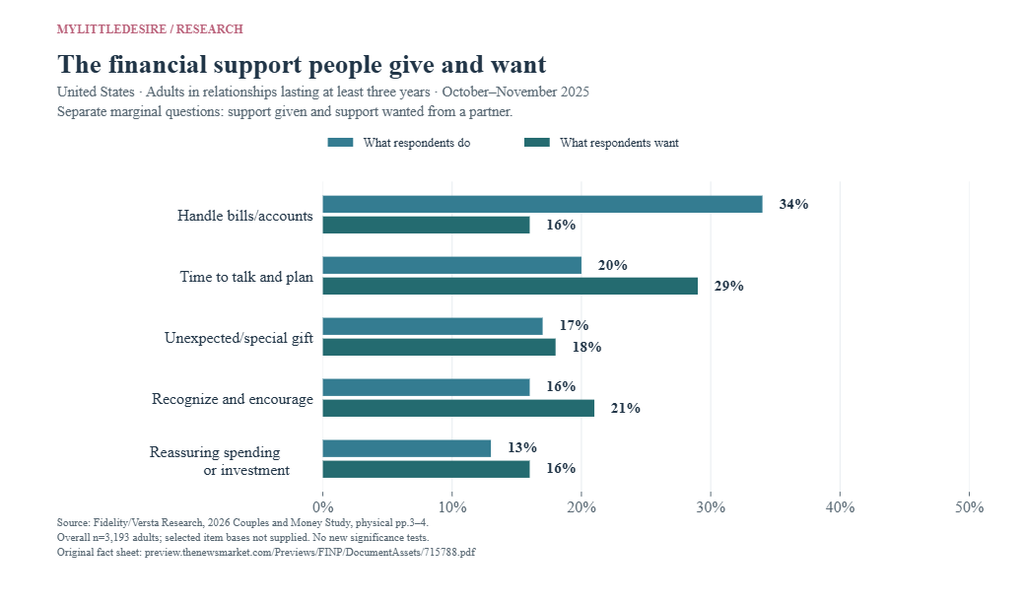
Fidelity’s study separates feeling able to talk from actually talking regularly. Its support questions also distinguish practical administration from time spent discussing and planning together. Our chart brings the support distributions together while preserving the difference between support given and support wanted.
| ID | Finding and qualification | Population, actual period and base | Original source and locator |
|---|---|---|---|
| F12 | 91% believed they could talk openly about money, while 29% regularly discussed day-to-day finances. Definition: Perceived openness and regular day-to-day discussion are separate questions. Qualification: A difference between marginal percentages does not identify the same individuals who feel open but do not talk regularly. | Married or partnered adults 18+ in their relationship for at least three years United States 2025-10-14 to 2025-11-02 Overall report n=3,193. Item/subgroup bases are not provided alongside these estimates. Overall report size is not the valid base for every item. | Fidelity Investments / Versta Research Published 2026-05-19 Fact sheet, physical p.3, Communication and conflict. |
| F13 | 50% wished they discussed day-to-day finances more; the figures were 64% for Gen Z and 63% for millennials. Definition: Desire for more discussion, not observed conversation frequency. Qualification: Young-adult subgroups are part of the overall sample; do not sum them or interpret this as dissatisfaction with the relationship as a whole. | Married or partnered adults 18+ in their relationship for at least three years United States 2025-10-14 to 2025-11-02 Overall report n=3,193. Item/subgroup bases are not provided alongside these estimates. Overall report size is not the valid base for every item. | Fidelity Investments / Versta Research Published 2026-05-19 Fact sheet physical p.4; newsroom paragraph before Younger Couples Embrace Financial Independence. |
| F14 | 49% avoided money conversations to prevent arguments. Definition: Avoidance for the specified conflict-related reason. Qualification: The fact sheet separately gives 44% for I worry it will start an argument on p.3 without a clear denominator. Do not conflate or calculate a trend between the two. | Married or partnered adults 18+ in their relationship for at least three years United States 2025-10-14 to 2025-11-02 Overall report n=3,193. Item/subgroup bases are not provided alongside these estimates. Overall report size is not the valid base for every item. | Fidelity Investments / Versta Research Published 2026-05-19 Fact sheet physical p.1, Key findings. |
| F15 | 68% did not know the full financial picture before living together; 18% took more than a year to understand it. Definition: Timing of knowing a partner’s full financial picture. Qualification: The later-understanding response is not an independent additional group to add to 68%. | Married or partnered adults 18+ in their relationship for at least three years United States 2025-10-14 to 2025-11-02 Overall report n=3,193. Item/subgroup bases are not provided alongside these estimates. Overall report size is not the valid base for every item. | Fidelity Investments / Versta Research Published 2026-05-19 Fact sheet physical p.1, Trust and transparency. |
| F16 | 58% reported unequal household financial contributions; 23% said the imbalance affected their relationship. Definition: Reported contribution inequality and relationship impact. Qualification: The sheet does not label 23% as a percentage of the 58%. Do not multiply, divide or reinterpret it as a conditional rate. | Married or partnered adults 18+ in their relationship for at least three years United States 2025-10-14 to 2025-11-02 Overall report n=3,193. Item/subgroup bases are not provided alongside these estimates. Overall report size is not the valid base for every item. | Fidelity Investments / Versta Research Published 2026-05-19 Fact sheet physical p.2, Unequal earnings and emotional load. |
| F17 | 66% said financial independence was important. Definition: Attitude toward financial independence. Qualification: Independence is not identical to separate accounts, undisclosed accounts or financial infidelity. | Married or partnered adults 18+ in their relationship for at least three years United States 2025-10-14 to 2025-11-02 Overall report n=3,193. Item/subgroup bases are not provided alongside these estimates. Overall report size is not the valid base for every item. | Fidelity Investments / Versta Research Published 2026-05-19 Fact sheet physical p.2, How couples manage their money. |
| F18 | 46% of women felt financially dependent, compared with 16% of men. Definition: Self-reported financial dependence by gender. Qualification: Separate respondent groups; not a comparison of matched partners and not a measure of financial abuse. | Married or partnered adults 18+ in their relationship for at least three years United States 2025-10-14 to 2025-11-02 Overall report n=3,193. Item/subgroup bases are not provided alongside these estimates. Overall report size is not the valid base for every item. | Fidelity Investments / Versta Research Published 2026-05-19 Fact sheet physical p.2, How couples manage their money. |
| F19 | Among those with less household financial responsibility, 60% worried about their ability to take over. Definition: Conditional worry among lower-responsibility partners. Qualification: This is not 60% of all surveyed adults; size of the conditional group is not published. | Adults with less responsibility for household finances, within Fidelity’s 3+ year relationship sample United States 2025-10-14 to 2025-11-02 Overall report n=3,193. Item/subgroup bases are not provided alongside these estimates. Overall report size is not the valid base for every item. | Fidelity Investments / Versta Research Published 2026-05-19 Fact sheet physical p.2, Unequal earnings and emotional load. |
| F20 | Confidence taking full responsibility for day-to-day finances was 88% among men and 72% among women. Definition: Self-rated confidence in day-to-day management. Qualification: Confidence is not a test of knowledge, actual skill or readiness after a specific life event. | Married or partnered adults 18+ in their relationship for at least three years United States 2025-10-14 to 2025-11-02 Overall report n=3,193. Item/subgroup bases are not provided alongside these estimates. Overall report size is not the valid base for every item. | Fidelity Investments / Versta Research Published 2026-05-19 Fact sheet physical p.3, Confidence to assume full financial responsibility. |
| F21 | Confidence taking responsibility for investments and long-term finances was 84% among men and 65% among women. Definition: Self-rated investment and long-term financial confidence. Qualification: Not measured investment performance or an inference that one gender should control financial decisions. | Married or partnered adults 18+ in their relationship for at least three years United States 2025-10-14 to 2025-11-02 Overall report n=3,193. Item/subgroup bases are not provided alongside these estimates. Overall report size is not the valid base for every item. | Fidelity Investments / Versta Research Published 2026-05-19 Fact sheet physical p.3, Confidence to assume full financial responsibility. |
| F22 | For support given versus wanted, bills/accounts were 34% versus 16%; planning time 20% versus 29%; gifts 17% versus 18%; encouragement 16% versus 21%; reassuring spending/investment 13% versus 16%. Definition: Five support categories; what respondents do and what they want from a spouse/partner. Qualification: These are separate marginal distributions, not matched deficits, individual dissatisfaction or proof partners neglect one another. All ten values are grouped as one finding. | Married or partnered adults 18+ in their relationship for at least three years United States 2025-10-14 to 2025-11-02 Overall report n=3,193. Item/subgroup bases are not provided alongside these estimates. Overall report size is not the valid base for every item. | Fidelity Investments / Versta Research Published 2026-05-19 Fact sheet physical p.4, How partners show support data table; chart on p.3. |
| F23 | 69% were not regularly discussing long-term finances, while 41% wished they were. Definition: Longer-term discussion frequency and desire for more. Qualification: Two questions can overlap. Not a share of avoidant couples who want to change, and not a causal result of talking. | Married or partnered adults 18+ in their relationship for at least three years United States 2025-10-14 to 2025-11-02 Overall report n=3,193. Item/subgroup bases are not provided alongside these estimates. Overall report size is not the valid base for every item. | Fidelity Investments / Versta Research Published 2026-05-19 Newsroom section Couples That Talk About Finances Can Feel More Prepared. |
| F24 | 52% selected planning for fun as the best way money could strengthen the relationship. Definition: Date nights, hobbies and vacations as a stated preference. Qualification: Preference question; not a tested effect of additional spending or evidence that more expensive dates improve relationships. | Married or partnered adults 18+ in their relationship for at least three years United States 2025-10-14 to 2025-11-02 Overall report n=3,193. Item/subgroup bases are not provided alongside these estimates. Overall report size is not the valid base for every item. | Fidelity Investments / Versta Research Published 2026-05-19 Fact sheet physical p.1 and p.3; newsroom Emotional Toll section. |
For deliberate concealment and financial secrecy, see financial infidelity statistics. This money-management resource focuses on everyday arrangements, communication and shared responsibilities.
How well do partners understand each other’s finances?
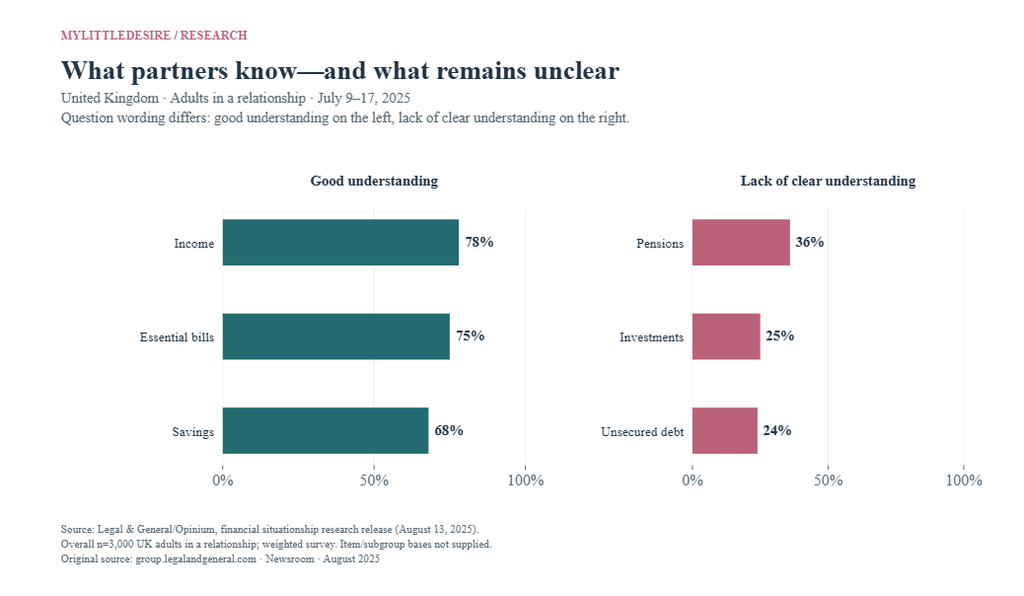
In Legal & General’s UK survey, understanding of current income and bills appeared alongside uncertainty about pensions, investments and debt. The chart preserves the wording of each response. A lack of clear understanding is not automatically the exact opposite of good understanding.
| ID | Finding and qualification | Population, actual period and base | Original source and locator |
|---|---|---|---|
| F25 | 86% believed they had a healthy approach to discussing money. Definition: Self-rated approach to money discussions. Qualification: Can coexist with avoidance or arguments; do not subtract the rates as exclusive relationship types. | UK adults in a relationship United Kingdom 2025-07-09 to 2025-07-17 Overall report n=3,000. Item/subgroup bases are not provided alongside these estimates. Overall report size is not the valid base for every item. | Legal & General / Opinium Published 2025-08-13 Release bullet summary and main paragraph on long-term finances. |
| F26 | 18% said they often argued about money and 17% avoided the conversation altogether. Definition: Often arguing and avoiding are separate reported behaviors. Qualification: The responses can overlap; no combined prevalence is available. | UK adults in a relationship United Kingdom 2025-07-09 to 2025-07-17 Overall report n=3,000. Item/subgroup bases are not provided alongside these estimates. Overall report size is not the valid base for every item. | Legal & General / Opinium Published 2025-08-13 Release bullet summary and main paragraph on long-term finances. |
| F27 | A good understanding of a partner’s finances was reported for income by 78%, essential monthly bills by 75%, and savings by 68%. Definition: Good-understanding responses for three short-term/current financial areas. Qualification: These are question-level marginal percentages, not the share knowing all three. The full response scale is not supplied. | UK adults in a relationship United Kingdom 2025-07-09 to 2025-07-17 Overall report n=3,000. Item/subgroup bases are not provided alongside these estimates. Overall report size is not the valid base for every item. | Legal & General / Opinium Published 2025-08-13 When it comes to long term finances, couples are left guessing; first paragraph. |
| F28 | A lack of clear understanding was reported for a partner’s pension savings by 36%, investments by 25%, and unsecured debt by 24%. Definition: Lack-of-clear-understanding responses, not the inverse of the good-understanding wording. Qualification: Do not compare these rates with F27 as though they were the same response polarity or calculate a national pension balance. | UK adults in a relationship United Kingdom 2025-07-09 to 2025-07-17 Overall report n=3,000. Item/subgroup bases are not provided alongside these estimates. Overall report size is not the valid base for every item. | Legal & General / Opinium Published 2025-08-13 When it comes to long term finances, couples are left guessing; first paragraph. |
| F29 | 18% had not discussed retirement; 13% had discussed it without how joint finances would work; 10% planned separately without discussing combined later-life finances. Definition: Three published descriptions of retirement conversation/planning. Qualification: The release does not provide the full response table or confirm exclusivity; do not sum the categories into a new 41% headline. | UK adults in a relationship United Kingdom 2025-07-09 to 2025-07-17 Overall report n=3,000. Item/subgroup bases are not provided alongside these estimates. Overall report size is not the valid base for every item. | Legal & General / Opinium Published 2025-08-13 Retirement seems to be a particular blind spot paragraph. |
What do Canadian surveys show about compatibility and teamwork?
Simplii’s January 2026 poll describes financial alignment, teamwork and regular discussion. The release discloses its full adult sample but not the partnered base for every item. Couple-labeled responses below retain that limitation, and the broader adult difficulty item is identified separately.
| ID | Finding and qualification | Population, actual period and base | Original source and locator |
|---|---|---|---|
| F30 | 96% considered financial alignment important, while 81% described themselves as financially compatible. Definition: Couple-labeled importance and perceived compatibility responses. Qualification: Partnered item base is not published; the 15-point marginal difference is not the prevalence of incompatible couples who value alignment. | Online adult sample 18+; release describes selected relationship questions as Canadian couples Canada 2026-01-22 to 2026-01-26 Overall report n=1,500. Item/subgroup bases are not provided alongside these estimates. Overall report size is not the valid base for every item. | Simplii Financial / Ipsos Published 2026-02-09 Original release PDF physical p.1, second paragraph. |
| F31 | 79% said they made a great team managing money. Definition: Couple-labeled perception of financial teamwork. Qualification: Self-report, not independently assessed management quality; partnered base not published. | Online adult sample 18+; release describes selected relationship questions as Canadian couples Canada 2026-01-22 to 2026-01-26 Overall report n=1,500. Item/subgroup bases are not provided alongside these estimates. Overall report size is not the valid base for every item. | Simplii Financial / Ipsos Published 2026-02-09 Original release PDF physical p.1, second paragraph. |
| F32 | 75% discussed money weekly or a few times a month. Definition: The two frequency bands expressly combined by the publisher. Qualification: Do not label the remainder as never talking; other frequencies may exist. Partnered item base not published. | Online adult sample 18+; release describes selected relationship questions as Canadian couples Canada 2026-01-22 to 2026-01-26 Overall report n=1,500. Item/subgroup bases are not provided alongside these estimates. Overall report size is not the valid base for every item. | Simplii Financial / Ipsos Published 2026-02-09 Original release PDF physical p.1, paragraph beginning And it’s not just compatibility. |
| F33 | 79% were satisfied with how often they discussed money. Definition: Satisfaction with conversation frequency. Qualification: Not a direct measure of how often they talk, the content of discussions or satisfaction with all finances. | Online adult sample 18+; release describes selected relationship questions as Canadian couples Canada 2026-01-22 to 2026-01-26 Overall report n=1,500. Item/subgroup bases are not provided alongside these estimates. Overall report size is not the valid base for every item. | Simplii Financial / Ipsos Published 2026-02-09 Original release PDF physical p.1, communication paragraph. |
| F34 | 44% said money conversations could be difficult for them. Definition: Adult self-reported difficulty discussing money. Qualification: Release calls this Canadians rather than explicitly giving a partnered-only base. Retained as an adult-context statistic; not proof that 44% of couples argue. | Canadian adult respondents; release does not label this item as exclusively partnered Canada 2026-01-22 to 2026-01-26 Overall report n=1,500. Item/subgroup bases are not provided alongside these estimates. Overall report size is not the valid base for every item. | Simplii Financial / Ipsos Published 2026-02-09 Original release PDF physical p.1, communication paragraph. |
| F35 | 56% reported that one partner took the primary role handling finances. Definition: Primary financial role held by one partner. Qualification: Does not by itself establish sole decision power, unequal access, incompetence of the other partner or unhealthy control. | Online adult sample 18+; release describes selected relationship questions as Canadian couples Canada 2026-01-22 to 2026-01-26 Overall report n=1,500. Item/subgroup bases are not provided alongside these estimates. Overall report size is not the valid base for every item. | Simplii Financial / Ipsos Published 2026-02-09 Original release PDF physical p.1, final paragraph. |
| F36 | 57% believed they managed personal finances better than their partner. Definition: Comparative self-assessment of personal financial management. Qualification: Not matched-pair agreement or measured skill; partnered item base not supplied. | Online adult sample 18+; release describes selected relationship questions as Canadian couples Canada 2026-01-22 to 2026-01-26 Overall report n=1,500. Item/subgroup bases are not provided alongside these estimates. Overall report size is not the valid base for every item. | Simplii Financial / Ipsos Published 2026-02-09 Original release PDF physical p.1, final paragraph. |
How do money stress and barriers to action affect cohabiting adults?
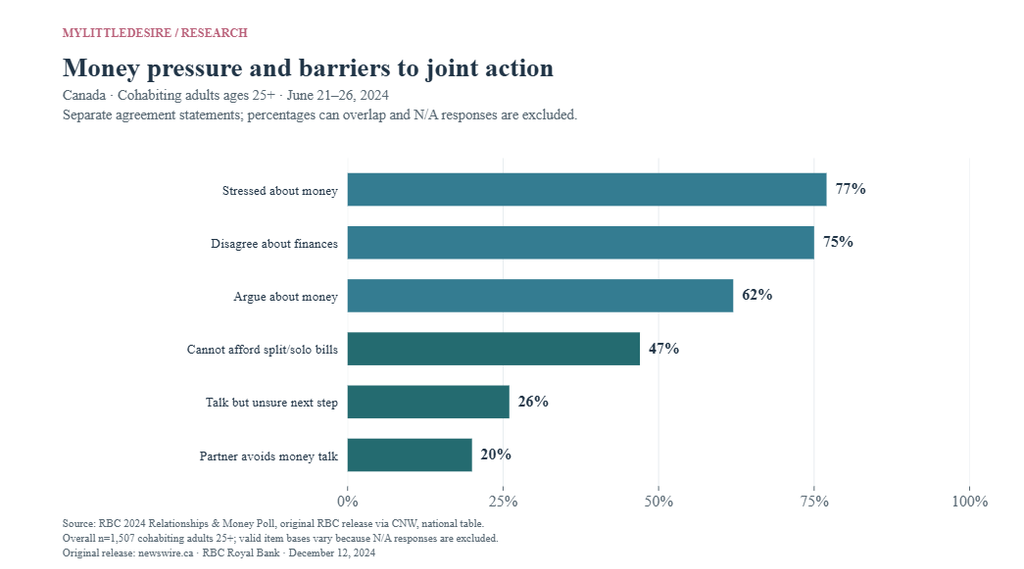
RBC’s 2024 poll asked cohabiting Canadians ages 25 and older about pressure, disagreement and action. Many respondents reported stress, while smaller shares described specific barriers to discussing or improving finances. These questions overlap and have varying valid bases because N/A responses were excluded.
| ID | Finding and qualification | Population, actual period and base | Original source and locator |
|---|---|---|---|
| F37 | 77% agreed they were stressed about money, 75% disagreed with their partner about finances, and 62% argued about money. Definition: Separate agree-response items; N/A excluded. Qualification: Do not label disagreement as an argument or infer which individuals reported both. Three item-level rates grouped in one finding. | Adults 25+ in a cohabiting relationship; Angus Reid Forum members Canada 2024-06-21 to 2024-06-26 Overall report n=1,507. Item/subgroup bases are not provided alongside these estimates. Overall report size is not the valid base for every item. | RBC Royal Bank / Angus Reid Forum Published 2024-12-12 Fast Facts national column, first financial-stress rows. |
| F38 | 55% said they needed to be in a relationship to pay for their lifestyle. Definition: Agreement with lifestyle-affordability statement; N/A excluded. Qualification: A stated financial constraint, not proof the relationship exists only for money. | Adults 25+ in a cohabiting relationship; Angus Reid Forum members Canada 2024-06-21 to 2024-06-26 Overall report n=1,507. Item/subgroup bases are not provided alongside these estimates. Overall report size is not the valid base for every item. | RBC Royal Bank / Angus Reid Forum Published 2024-12-12 Fast Facts national column, I need to be in a relationship row. |
| F39 | 47% said they could not afford to split up or pay bills without being in a relationship. Definition: Combined affordability statement used by the source; N/A excluded. Qualification: Do not split the two clauses into independently measured percentages or equate this with abuse. | Adults 25+ in a cohabiting relationship; Angus Reid Forum members Canada 2024-06-21 to 2024-06-26 Overall report n=1,507. Item/subgroup bases are not provided alongside these estimates. Overall report size is not the valid base for every item. | RBC Royal Bank / Angus Reid Forum Published 2024-12-12 Fast Facts national column, I couldn’t afford to split up row. |
| F40 | 47% believed they handled finances better than their partner. Definition: Self-assessment of relative financial skill; N/A excluded. Qualification: Not an objective competency test or evidence that both partners gave this answer. | Adults 25+ in a cohabiting relationship; Angus Reid Forum members Canada 2024-06-21 to 2024-06-26 Overall report n=1,507. Item/subgroup bases are not provided alongside these estimates. Overall report size is not the valid base for every item. | RBC Royal Bank / Angus Reid Forum Published 2024-12-12 Fast Facts national column, I believe I handle finances better row. |
| F41 | 27% were frustrated by a partner’s money habits; 15% said those habits negatively affected their feelings about the partner. Definition: Frustration and negative feelings are separate statements; N/A excluded. Qualification: The 15% is not a published conditional percentage of the frustrated 27%. | Adults 25+ in a cohabiting relationship; Angus Reid Forum members Canada 2024-06-21 to 2024-06-26 Overall report n=1,507. Item/subgroup bases are not provided alongside these estimates. Overall report size is not the valid base for every item. | RBC Royal Bank / Angus Reid Forum Published 2024-12-12 Fast Facts national column, financial-habits rows. |
| F42 | 26% said they discussed improving their finances but did not know what to do next. Definition: Agreement with a conversation-to-action barrier; N/A excluded. Qualification: Does not mean they took no action at any time or needed a particular commercial product. | Adults 25+ in a cohabiting relationship; Angus Reid Forum members Canada 2024-06-21 to 2024-06-26 Overall report n=1,507. Item/subgroup bases are not provided alongside these estimates. Overall report size is not the valid base for every item. | RBC Royal Bank / Angus Reid Forum Published 2024-12-12 Fast Facts national column, We talk about improving row. |
| F43 | 23% said talking about finances with their partner had never been more stressful. Definition: Retrospective subjective statement; N/A excluded. Qualification: Not a repeated survey time trend or a quantitative measure of increased stress. | Adults 25+ in a cohabiting relationship; Angus Reid Forum members Canada 2024-06-21 to 2024-06-26 Overall report n=1,507. Item/subgroup bases are not provided alongside these estimates. Overall report size is not the valid base for every item. | RBC Royal Bank / Angus Reid Forum Published 2024-12-12 Fast Facts national column, It has never been more stressful row. |
| F44 | 20% said their partner simply avoided discussing finances. Definition: Respondent’s report of partner avoidance; N/A excluded. Qualification: Not the partner’s own admission or an estimate among all Canadian adults. | Adults 25+ in a cohabiting relationship; Angus Reid Forum members Canada 2024-06-21 to 2024-06-26 Overall report n=1,507. Item/subgroup bases are not provided alongside these estimates. Overall report size is not the valid base for every item. | RBC Royal Bank / Angus Reid Forum Published 2024-12-12 Fast Facts national column, My partner simply avoids row. |
Which financial qualities do adults want in a partner?
TD’s 2026 survey adds adult expectations about transparency, spending and shared goals. These are preferences and self-reported priorities. They should not be quoted as the prevalence of lying, excessive spending or actual prenuptial agreements among existing couples.
| ID | Finding and qualification | Population, actual period and base | Original source and locator |
|---|---|---|---|
| F45 | Financial transparency mattered in partner choice to 52%; spending habits and similar goals to 51% each; debt levels to 41%. Definition: Adult partner-selection attitudes. Qualification: Includes attitudes/hypothetical preferences; do not present as observed behaviors of existing couples or sum the responses. | Canadian adults, including relationship attitudes and hypothetical partner preferences Canada 2026-01-09 to 2026-01-13 Overall report n=1,502. Item/subgroup bases are not provided alongside these estimates. Overall report size is not the valid base for every item. | TD Bank Group / Leger Published 2026-02-03 We Don’t Talk About Money Anymore; opening paragraph. |
| F46 | Economic conditions led 25% to prioritize earlier financial transparency, 22% a similar financial outlook, 18% good money habits and 16% secure finances in a partner. Definition: Self-reported changes in priorities linked by respondents to economic conditions. Qualification: Not experimentally established economic effects; adult attitude items can overlap. | Canadian adults, including relationship attitudes and hypothetical partner preferences Canada 2026-01-09 to 2026-01-13 Overall report n=1,502. Item/subgroup bases are not provided alongside these estimates. Overall report size is not the valid base for every item. | TD Bank Group / Leger Published 2026-02-03 Opening economic-climate paragraph and following bullet list. |
| F47 | Financial dealbreakers included lying for 53%, bad spending for 43%, never offering to pay for 41%, risky investments for 28%, and refusing mutual-goal saving for 25%. Definition: Stated partner preferences, not measured prevalence of deception or bad spending. Qualification: Multiple answers may overlap; do not report 53% as having experienced financial infidelity. | Canadian adults, including relationship attitudes and hypothetical partner preferences Canada 2026-01-09 to 2026-01-13 Overall report n=1,502. Item/subgroup bases are not provided alongside these estimates. Overall report size is not the valid base for every item. | TD Bank Group / Leger Published 2026-02-03 We Don’t Talk About Money Anymore; dealbreaker list. |
| F48 | 51% of Gen Z would want a partner to sign a prenup for marriage/common-law union, versus 28% of adult respondents overall. Definition: Hypothetical preference for an agreement, not actual uptake. Qualification: Gen Z is a subset of the national adult sample. This is not evidence that 51% have a prenup or of an enforceable legal position. | Canadian adults, including relationship attitudes and hypothetical partner preferences Canada 2026-01-09 to 2026-01-13 Overall report n=1,502. Item/subgroup bases are not provided alongside these estimates. Overall report size is not the valid base for every item. | TD Bank Group / Leger Published 2026-02-03 Tell Me Lies section; final paragraph. |
How did Australian account arrangements change in the HILDA study?
The original Huang, Perales and Western paper examines 2002–2014 data, using linked records from both members of different-sex couples. It distinguishes five account arrangements. These historical findings remain useful for definitions and long-term context, with their original dates attached.
| ID | Finding and qualification | Population, actual period and base | Original source and locator |
|---|---|---|---|
| F49 | Across the pooled 2002–2014 observations, about 79% had at least one joint bank account. Definition: Pooled couple-wave prevalence; any partner reporting joint ownership suffices. Qualification: Not a 2014-only or contemporary Australian estimate. Rounded approximation retained. | Selected co-resident different-sex couples; both partners have bank accounts and linked survey records Australia HILDA waves 2, 6, 10, 14: 2002, 2006, 2010, 2014 Overall report n=7,054. Item/subgroup bases are not provided alongside these estimates. Overall report size is not the valid base for every item. | Yangtao Huang, Francisco Perales and Mark Western / PLOS ONE Published 2019-04-17 Section 5.1, paragraph beginning Results for the dichotomous outcome variable. |
| F50 | Pooled arrangements were 31% joint-only, 23% joint plus separate accounts for both, 21% separate-only, 17% joint plus a separate account for the woman, and 8% joint plus one for the man. Definition: Five account-ownership categories for selected different-sex couples. Qualification: Rounded pooled observations, not all current couples or a five-category financial-power test. Categories grouped as one finding. | Selected co-resident different-sex couples; both partners have bank accounts and linked survey records Australia HILDA waves 2, 6, 10, 14: 2002, 2006, 2010, 2014 Overall report n=7,054. Item/subgroup bases are not provided alongside these estimates. Overall report size is not the valid base for every item. | Yangtao Huang, Francisco Perales and Mark Western / PLOS ONE Published 2019-04-17 Section 5.1, five-category outcome paragraph; Figure 1. |
| F51 | Joint-only ownership declined from 33% in 2002 to 29% in 2014. Definition: Same five-category measure across HILDA waves. Qualification: Original paper reports p<0.001 for these descriptive time differences; we conduct no new significance test. | Selected co-resident different-sex couples; both partners have bank accounts and linked survey records Australia HILDA 2002 versus 2014 Overall report n=7,054. Item/subgroup bases are not provided alongside these estimates. Overall report size is not the valid base for every item. | Yangtao Huang, Francisco Perales and Mark Western / PLOS ONE Published 2019-04-17 Section 5.1, over-time variation paragraph; Figure 1. |
| F52 | Joint accounts plus separate accounts for both partners increased from 22% in 2002 to 26% in 2014. Definition: Both partners retain separate accounts and a shared account. Qualification: Other mixed arrangements have only one partner holding a separate account. Do not relabel this as all mixed accounts. | Selected co-resident different-sex couples; both partners have bank accounts and linked survey records Australia HILDA 2002 versus 2014 Overall report n=7,054. Item/subgroup bases are not provided alongside these estimates. Overall report size is not the valid base for every item. | Yangtao Huang, Francisco Perales and Mark Western / PLOS ONE Published 2019-04-17 Section 5.1, over-time variation paragraph; Figure 1. |
| F53 | Separate-only ownership increased from 19% in 2002 to 22% in 2014. Definition: Separate accounts for both partners and no joint account. Qualification: Historical selected-couple evidence, not a forecast of 2027 arrangements. | Selected co-resident different-sex couples; both partners have bank accounts and linked survey records Australia HILDA 2002 versus 2014 Overall report n=7,054. Item/subgroup bases are not provided alongside these estimates. Overall report size is not the valid base for every item. | Yangtao Huang, Francisco Perales and Mark Western / PLOS ONE Published 2019-04-17 Section 5.1, over-time variation paragraph; Figure 1. |
What does a newer Australian survey add?
Finder’s January 2025 survey adds a contemporary partnered sample. Its answer “share finances equally” is broader than an explicit statement that all accounts are jointly held. We retain that wording and the published rounding rather than force it into a joint-only international comparison.
| ID | Finding and qualification | Population, actual period and base | Original source and locator |
|---|---|---|---|
| F54 | 59% selected sharing finances equally, 25% some shared finances plus own accounts, 12% separate and happy, and 5% separate but preferring to combine. Definition: Exact meaning of the source’s four response options, paraphrased. Qualification: Rounded total is 101%. Equal sharing is not expressly defined as all accounts joint; retain this distinction instead of using it in an international joint-only league table. | Respondents with a partner Australia January 2025 Overall report n=559. Item/subgroup bases are not provided alongside these estimates. Overall report size is not the valid base for every item. | Finder / Qualtrics Published 2025-03-10 Do you combine finances with your partner? response table. |
| F55 | Sharing finances equally was reported by 77% of baby boomers, 61% of Gen X, 58% of Gen Y and 31% of Gen Z. Definition: Publisher generation labels; birth-year cutoffs not supplied in this release. Qualification: Subgroup bases unavailable; not proof of a causal age effect or a directly comparable joint-account rate. | Respondents with a partner Australia January 2025 Overall report n=559. Item/subgroup bases are not provided alongside these estimates. Overall report size is not the valid base for every item. | Finder / Qualtrics Published 2025-03-10 Paragraph beginning Baby boomers; before response table. |
Do similar earnings imply equal contributions at home?
Pew’s government-data analysis shows a long-term increase in roughly equal-earning marriages. Its separate time-use analysis also shows that similar earnings can coexist with differences in leisure, caregiving and housework. Earnings, bill contributions, unpaid work and financial decision power each require their own measure.
| ID | Finding and qualification | Population, actual period and base | Original source and locator |
|---|---|---|---|
| F56 | Marriages with roughly equal earnings rose from 11% in 1972 to 29% in 2022. Definition: Each spouse earns 40%–60% of the couple’s combined earnings. Qualification: Not exactly equal income, equal bill contributions or equal financial decision power. | Opposite-sex marriages with spouses ages 25–64; earnings and time-use eligibility varies United States CPS ASEC earnings 1972 versus 2022 Item/subgroup bases are not provided alongside these estimates. Overall report size is not the valid base for every item. | Pew Research Center Published 2023-04-13 Original PDF printed p.7 (physical p.8), The earnings landscape. |
| F57 | Wife sole/primary breadwinner marriages rose from 5% in 1972 to 16% in 2022. Definition: Wife earns more than 60% of combined earnings or is the sole earner. Qualification: Includes two breadwinner categories; not every marriage in which the wife earns slightly more. | Opposite-sex marriages with spouses ages 25–64; earnings and time-use eligibility varies United States CPS ASEC earnings 1972 versus 2022 Item/subgroup bases are not provided alongside these estimates. Overall report size is not the valid base for every item. | Pew Research Center Published 2023-04-13 Original PDF printed p.7 (physical p.8). |
| F58 | Husband-only breadwinner marriages fell from 49% in 1972 to 23% in 2022. Definition: Husband has positive earnings and wife has none. Qualification: Not the broader primary-or-sole husband category, and not absence of unpaid household contributions. | Opposite-sex marriages with spouses ages 25–64; earnings and time-use eligibility varies United States CPS ASEC earnings 1972 versus 2022 Item/subgroup bases are not provided alongside these estimates. Overall report size is not the valid base for every item. | Pew Research Center Published 2023-04-13 Original PDF printed pp.6–7 (physical pp.7–8). |
| F59 | In approximately equal-earning marriages, husbands spent about 3.5 more weekly hours on leisure; wives about 2 more on caregiving and 2.5 more on housework. Definition: Approximate average weekly time differences, as summarized by Pew. Qualification: Historical 2016–2021 time-use data, not 2022 or 2027 behavior. Group averages are not every couple’s division of labor. | Opposite-sex marriages with spouses ages 25–64; earnings and time-use eligibility varies United States ATUS 2016–2021 pooled Item/subgroup bases are not provided alongside these estimates. Overall report size is not the valid base for every item. | Pew Research Center Published 2023-04-13 Original PDF printed p.6 (physical p.7), key findings; pooled ATUS analysis. |
| F60 | Wives were sole/primary breadwinners in 25% of marriages where they had more education than their husband, versus 11% where they had less. Definition: Comparative educational attainment and breadwinner status. Qualification: Unadjusted association among eligible opposite-sex marriages; does not establish that education caused control of money. | Opposite-sex marriages with spouses ages 25–64; earnings and time-use eligibility varies United States CPS ASEC earnings 2022 Item/subgroup bases are not provided alongside these estimates. Overall report size is not the valid base for every item. | Pew Research Center Published 2023-04-13 Original PDF printed p.9 (physical p.10); wife’s relative education paragraph. |
Which comparisons can journalists reuse?
The following calculations subtract published percentages. MyLittleDesire contributes the arithmetic, organization and chart presentation. Some contrasts are already apparent in the original reports; they are not new scientific discoveries or original survey fieldwork. Differences between separate questions describe marginal responses and do not reveal individual overlap.
| Comparison | Calculation | Original source | Interpretation limit |
|---|---|---|---|
| C01 · No-joint ownership: 2023 minus 1996 | 23% − 15% = +8.0 percentage points | US Census Bureau F01 / F01 | Original SIPP target groups and account eligibility apply. Historical changes and subgroup contrasts are descriptive; they do not establish causes. Conditional joint-holder results are not rates for all couples. |
| C02 · All-joint ownership: 2023 minus 1996 | 40% − 53% = -13.0 percentage points | US Census Bureau F02 / F02 | Original SIPP target groups and account eligibility apply. Historical changes and subgroup contrasts are descriptive; they do not establish causes. Conditional joint-holder results are not rates for all couples. |
| C03 · All-joint ownership: wife married 20–24 minus 30–34 | 47% − 29% = +18.0 percentage points | US Census Bureau F03 / F03 | Original SIPP target groups and account eligibility apply. Historical changes and subgroup contrasts are descriptive; they do not establish causes. Conditional joint-holder results are not rates for all couples. |
| C04 · Joint ownership: married 9–13 minus 4–8 years | 79% − 68% = +11.0 percentage points | US Census Bureau F04 / F04 | Original SIPP target groups and account eligibility apply. Historical changes and subgroup contrasts are descriptive; they do not establish causes. Conditional joint-holder results are not rates for all couples. |
| C05 · Joint ownership: with minor children minus without | 75% − 64% = +11.0 percentage points | US Census Bureau F05 / F05 | Original SIPP target groups and account eligibility apply. Historical changes and subgroup contrasts are descriptive; they do not establish causes. Conditional joint-holder results are not rates for all couples. |
| C06 · Joint ownership: never divorced minus remarried | 79% − 73% = +6.0 percentage points | US Census Bureau F06 / F06 | Original SIPP target groups and account eligibility apply. Historical changes and subgroup contrasts are descriptive; they do not establish causes. Conditional joint-holder results are not rates for all couples. |
| C07 · Joint holders also having solo accounts: 2023 minus 1996 | 49% − 37% = +12.0 percentage points | US Census Bureau F08 / F08 | Original SIPP target groups and account eligibility apply. Historical changes and subgroup contrasts are descriptive; they do not establish causes. Conditional joint-holder results are not rates for all couples. |
| C08 · Separate accounts: Gen Z minus boomers | 51% − 15% = +36.0 percentage points | Bankrate / YouGov F10 / F10 | Same survey, different generation groups; subgroup bases and confidence intervals not supplied. Not a longitudinal age effect. |
| C09 · Joint-only accounts: boomers minus Gen Z | 45% − 22% = +23.0 percentage points | Bankrate / YouGov F11 / F11 | Same survey, different generation groups. Joint-only and separate-only are not complementary categories. |
| C10 · Perceived openness minus regular day-to-day discussion | 91% − 29% = +62.0 percentage points | Fidelity Investments / Versta Research F12 / F12 | Separate marginal questions in the same eligible sample. The gap is not the percentage of individuals who are open but fail to talk regularly. |
| C11 · Financial dependence: women minus men | 46% − 16% = +30.0 percentage points | Fidelity Investments / Versta Research F18 / F18 | Separate respondents, not matched partners. No new statistical significance test; not a financial-abuse rate. |
| C12 · Day-to-day confidence: men minus women | 88% − 72% = +16.0 percentage points | Fidelity Investments / Versta Research F20 / F20 | Self-rated confidence; not a measure of tested competency or entitlement to control money. |
| C13 · Investment/long-term confidence: men minus women | 84% − 65% = +19.0 percentage points | Fidelity Investments / Versta Research F21 / F21 | Self-rated confidence; difference between this gap and the day-to-day gap is not a tested interaction. |
| C14 · Bill/account support: given minus wanted | 34% − 16% = +18.0 percentage points | Fidelity Investments / Versta Research F22 / F22 | Separate marginal answer distributions, not matched satisfaction deficits or proof that bill handling is unwanted. |
| C15 · Planning-time support: wanted minus given | 29% − 20% = +9.0 percentage points | Fidelity Investments / Versta Research F22 / F22 | Separate marginal answer distributions. This is a preference-versus-provision contrast, not a percentage of neglected partners. |
| C16 · Lack of clear knowledge: pensions minus unsecured debt | 36% − 24% = +12.0 percentage points | Legal & General / Opinium F28 / F28 | Separate items with the same response polarity; overlap unknown. The gap does not identify people who know debts but not pensions. |
| C17 · Alignment important minus feeling compatible | 96% − 81% = +15.0 percentage points | Simplii Financial / Ipsos F30 / F30 | Separate couple-labeled marginal questions; partnered analytic base is unpublished. Not an individual incompatibility rate. |
| C18 · Money stress minus money arguments | 77% − 62% = +15.0 percentage points | RBC Royal Bank / Angus Reid Forum F37 / F37 | Separate agree-response items with N/A excluded; valid item bases may differ. Not a fraction of stressed couples who do not argue. |
| C19 · Australian joint-only accounts: 2014 minus 2002 | 29% − 33% = -4.0 percentage points | Yangtao Huang, Francisco Perales and Mark Western / PLOS ONE F51 / F51 | Historical HILDA waves and selected different-sex couples. Preserve 2002–2014, not a current forecast. |
| C20 · Roughly equal earnings: 2022 minus 1972 | 29% − 11% = +18.0 percentage points | Pew Research Center F56 / F56 | CPS target opposite-sex marriages ages 25–64. Each spouse earns 40%–60%; not a trend in equal financial power. |
How should the studies be compared?
The strongest comparisons preserve the same question and eligible population. Differences between publishers can reflect wording, age, relationship duration, sampling and actual fieldwork rather than a change in couples’ behavior.
| Study | Eligible population | Actual data period | Use in this resource |
|---|---|---|---|
| US Census Bureau | Householder married couples owning assets at financial institutions; specified opposite-sex and unmarried subgroups | SIPP 1996 and 2023; subgroup comparisons 2023 | These are eligible account-owning householder couples, not every married couple. Selected item bases, standard errors and figure-specific eligibility are not all reproduced in the story. The 9%/17% prose description of mixed accounts is ambiguous without the full figure categories and is not used. No-joint and all-joint categories are not a complete partition. |
| Bankrate / YouGov | Married, civil-partnered or living with a romantic partner; adult participants | 2025-12-02 to 2025-12-08 | 1,208 is the eligible partnered base, not every generation’s item base. Subgroup bases and design-adjusted intervals are not supplied beside the selected values. Age/generation comparisons are cross-sectional, not evidence that individuals change accounts as they age. Direct download returned a site-unavailable page; original article and methodology were read through public web extraction. |
| Fidelity Investments / Versta Research | Married or partnered adults 18+ in their relationship for at least three years | 2025-10-14 to 2025-11-02 | Respondents are adults, not 3,193 matched couples. Recruitment/probability status and selected subgroup/item bases are not fully described in the fact sheet. Sponsor’s ±2% statement assumes no sample bias; it is not a verified design-based error bound. Support given and support wanted are separate marginal answers; they do not identify dissatisfied individuals. Generational definition includes birth years 1997–2012, but the actual survey admitted only adults. |
| Legal & General / Opinium | UK adults in a relationship | 2025-07-09 to 2025-07-17 | Panel recruitment/probability status, question order, exact subgroup bases and item intervals are not disclosed in the release. Healthy communication, arguments and avoidance can overlap. Understanding and lack-of-understanding questions have different wording; do not invert one automatically. The sponsor’s financial-situationship label is not a clinical or universal relationship-quality measure. |
| Simplii Financial / Ipsos | Online adult sample 18+; release describes selected relationship questions as Canadian couples | 2026-01-22 to 2026-01-26 | The release does not publish the size/eligibility of its partnered subsample or question-level valid bases. We retain its explicitly couple-labeled wording rather than label the estimates as all adults. The panel credibility interval is not a probability-sample margin of error. Money conversations weekly or a few times monthly does not include every possible regular frequency. |
| RBC Royal Bank / Angus Reid Forum | Adults 25+ in a cohabiting relationship; Angus Reid Forum members | 2024-06-21 to 2024-06-26 | National table excludes N/A responses, so valid item denominators vary and are not supplied. A quoted hypothetical ±2.5-point probability-sample margin of error is not the actual uncertainty of this panel. Individual responses do not independently confirm both partners agree; categories across questions overlap. |
| TD Bank Group / Leger | Canadian adults, including relationship attitudes and hypothetical partner preferences | 2026-01-09 to 2026-01-13 | Adult attitudes are not all reports about an existing relationship. Exact item and generational valid bases are not published. The release’s hypothetical probability-sample ±2.5% is not a panel sampling-error estimate. Budget and money-talk prevalence are withheld here because partnered question bases are insufficiently clear. |
| Yangtao Huang, Francisco Perales and Mark Western / PLOS ONE | Selected co-resident different-sex couples; both partners have bank accounts and linked survey records | HILDA waves 2, 6, 10, 14: 2002, 2006, 2010, 2014 | Pooled descriptive percentages are not a 2027 snapshot and are not 15,379 independent couples. Sample excludes same-sex couples and selected inconsistent/missing records. Some means are rounded. A 2026 AIFS synthesis gives different pooled figures; this resource uses the original 2019 paper. Associations are not causal effects. |
| Finder / Qualtrics | Respondents with a partner | January 2025 | Recruitment, weights, exact field dates and subgroup bases are not fully disclosed. The tracker’s broader historical response count is not this release’s sample. Published response labels mix equal sharing with account structure. Rounded categories total 101%; do not force them to sum to 100 or rename equal sharing as joint-only accounts. |
| Pew Research Center | Opposite-sex marriages with spouses ages 25–64; earnings and time-use eligibility varies | CPS earnings 1972 and 2022; ATUS time use 2016–2021 pooled | Not all ages, all couples or all marriage types. Egalitarian means each spouse earns 40%–60% of combined earnings, not exactly half and not proof of equal domestic work or decision power. Earnings exclude other concepts of total household wealth/income. Time-use evidence is pooled historical data, not collected in 2023. |
Three comparisons that need particular care
- US accounts: Census householder account owners, Bankrate live-in partners and Fidelity relationships lasting three years or more have different eligibility. Their percentages cannot form a clean recent-year trend.
- Canada: Simplii’s couple-labeled teamwork findings and RBC’s cohabiting-adult stress findings ask different questions in different years. A positive teamwork response can coexist with stress. The reports do not establish a national contradiction.
- Australia: Finder’s equal-sharing response is not defined as all-joint account ownership. The original HILDA paper is historical and distinguishes five arrangements. Its percentages are not a 2027 snapshot.
How was this resource researched?
MyLittleDesire reviewed original statistical-agency analysis, the original peer-reviewed HILDA paper and original survey publications from the commissioning organizations. For each selected finding, we recorded its source URL, publication date, actual period, eligible population, available sample information, definition, locator and caveat. We checked the original report rather than relying on another statistics roundup.
We grouped related categories and paired estimates into findings instead of treating every answer option as an independent discovery. The 60 findings contain 138 numeric inputs. Repeated historical observations are not new respondents. A source publication is not necessarily an independent underlying dataset: the Census and Pew analyses draw on government survey systems, and commissioned panels can have undisclosed participant overlap.
The 20 calculations use subtraction with results rounded to one decimal percentage point. The charts reproduce selected published aggregates with original-source attribution. They do not combine incompatible country samples into a league table, infer unreported respondent overlap or add causal interpretation. No new hypothesis tests, confidence intervals or participant-level analysis were conducted.
Limitations that matter when quoting
- Much of the newer communication evidence comes from commercially commissioned surveys. Sponsor interests, self-report, panel recruitment, nonresponse and social desirability may affect the results.
- Weighting and demographic quotas do not turn a nonprobability panel into a probability sample. Hypothetical probability-sample margins of error are not actual panel precision guarantees.
- Some releases do not disclose partnered sample sizes, valid item bases, full questionnaires or subgroup uncertainty. These limits remain next to the findings. No missing values are invented.
- Relationship eligibility differs, and several older analyses exclude same-sex couples. These findings should not be generalized to all relationship forms.
- Historical account and earnings comparisons are useful context, with original dates attached. They are not measurements of current 2027 behavior.
- We withheld ambiguous TD budget/money-talk rates, the LV= release’s decision-sharing estimate pending methods, ambiguous Census mixed-category shorthand and unaudited UCL effect multipliers. A retrieved source is not enough to establish every interpretation.
- Separate finances can be consensual. These statistics do not diagnose deception, financial abuse or a specific couple’s relationship quality.
Questions publishers ask
What percentage of couples combine all their finances?
Bankrate reported 38% fully joint, 36% mixed and 26% completely separate among its committed live-in relationship group, surveyed December 2–8, 2025. Keep the eligibility and date with the percentage. Bankrate / YouGov.
How common are joint accounts among married couples?
In the Census Bureau’s eligible account-owning householder married-couple population, 77% had at least one joint account in 2023. That includes couples who also held individual accounts. US Census Bureau.
Do separate accounts mean a couple has poor trust?
The selected account-ownership measures do not establish trust, consent or financial deception. Account structure and relationship quality require separate evidence.
What is the difference between being able to talk and talking regularly?
Fidelity’s 2025 fieldwork found 91% felt able to talk openly, while 29% regularly discussed day-to-day finances. These are separate marginal questions; their 62-point difference does not identify an individual subgroup. Fidelity Investments / Versta Research.
Which financial support was more wanted than reported as given?
In Fidelity’s published support table, planning time was wanted by 29% and reported as given by 20%, a descriptive 9-point contrast. No individual dissatisfaction rate can be inferred. Fidelity Investments / Versta Research.
Are the Canadian compatibility and stress findings contradictory?
The studies ask different questions of different samples in different years. Teamwork and stress can coexist, and neither report supplies a joint respondent-level comparison.
How many couples are stressed about money?
RBC reported 77% agreement among surveyed cohabiting Canadians ages 25+ in June 2024, excluding N/A answers. This is not a worldwide or 2027 couple prevalence. RBC Royal Bank / Angus Reid Forum.
Does equal earning mean equal unpaid work?
Pew defined roughly equal earners as each spouse contributing 40%–60% of combined earnings. Its historical time-use analysis still found differences in leisure, caregiving and housework. Pew Research Center.
Are the Australian HILDA figures recent?
The original 2019 paper analyzed 2002, 2006, 2010 and 2014 waves. A later summary does not turn that fieldwork into a new 2026 or 2027 survey. Yangtao Huang, Francisco Perales and Mark Western / PLOS ONE.
Did MyLittleDesire conduct these surveys?
No. MyLittleDesire assembled and checked original publications and added descriptive comparisons and charts. Cite the underlying organization when discussing its survey result.
Complete original sources
- [S01] US Census Bureau. Almost a Quarter of Married Couples Didn’t Have Joint Accounts in 2023, Up From 15% in 1996. Published 2025-09-24.
Actual period: SIPP 1996 and 2023; subgroup comparisons 2023.
Population: Householder married couples owning assets at financial institutions; specified opposite-sex and unmarried subgroups. Selected analytic n not supplied in the cited summary.
Method: Original Census analysis of the nationally representative longitudinal Survey of Income and Program Participation. A householder owns/rents the unit and is named on its deed/lease.
Limitations: These are eligible account-owning householder couples, not every married couple. Selected item bases, standard errors and figure-specific eligibility are not all reproduced in the story. The 9%/17% prose description of mixed accounts is ambiguous without the full figure categories and is not used. No-joint and all-joint categories are not a complete partition.
Supporting documents: Original supporting document 1
Checked 2026-10-30. - [S02] Bankrate / YouGov. Survey: Most couples keep at least some of their money separate. Published 2026-02-09.
Actual period: 2025-12-02 to 2025-12-08.
Population: Married, civil-partnered or living with a romantic partner; adult participants. Overall report n=1,208.
Method: YouGov nonprobability online panel. Total sample 2,564 adults, of whom 1,208 met the committed live-in relationship definition. Demographic quotas and weighting.
Limitations: 1,208 is the eligible partnered base, not every generation’s item base. Subgroup bases and design-adjusted intervals are not supplied beside the selected values. Age/generation comparisons are cross-sectional, not evidence that individuals change accounts as they age. Direct download returned a site-unavailable page; original article and methodology were read through public web extraction.
Supporting documents: Original supporting document 1
Checked 2026-10-30. - [S03] Fidelity Investments / Versta Research. 2026 Couples and Money Study. Published 2026-05-19.
Actual period: 2025-10-14 to 2025-11-02.
Population: Married or partnered adults 18+ in their relationship for at least three years. Overall report n=3,193.
Method: National survey with screening, sampling and weighting aligned to Census age, gender, race/ethnicity, income and education distributions for the target population.
Limitations: Respondents are adults, not 3,193 matched couples. Recruitment/probability status and selected subgroup/item bases are not fully described in the fact sheet. Sponsor’s ±2% statement assumes no sample bias; it is not a verified design-based error bound. Support given and support wanted are separate marginal answers; they do not identify dissatisfied individuals. Generational definition includes birth years 1997–2012, but the actual survey admitted only adults.
Supporting documents: Original supporting document 1
Checked 2026-10-30. - [S04] Legal & General / Opinium. One in four couples are in a financial situationship – sharing their lives, but not their bank balances. Published 2025-08-13.
Actual period: 2025-07-09 to 2025-07-17.
Population: UK adults in a relationship. Overall report n=3,000.
Method: Original commissioned Opinium survey; publisher says weighted to be nationally representative of the target group.
Limitations: Panel recruitment/probability status, question order, exact subgroup bases and item intervals are not disclosed in the release. Healthy communication, arguments and avoidance can overlap. Understanding and lack-of-understanding questions have different wording; do not invert one automatically. The sponsor’s financial-situationship label is not a clinical or universal relationship-quality measure.
Checked 2026-10-30. - [S05] Simplii Financial / Ipsos. Talk Money to Me: Financial compatibility is the new love language. Published 2026-02-09.
Actual period: 2026-01-22 to 2026-01-26.
Population: Online adult sample 18+; release describes selected relationship questions as Canadian couples. Overall report n=1,500.
Method: Original Ipsos online-panel poll commissioned by Simplii. The release reports an Ipsos credibility interval of ±3.1 points, wider for subsets.
Limitations: The release does not publish the size/eligibility of its partnered subsample or question-level valid bases. We retain its explicitly couple-labeled wording rather than label the estimates as all adults. The panel credibility interval is not a probability-sample margin of error. Money conversations weekly or a few times monthly does not include every possible regular frequency.
Checked 2026-10-30. - [S06] RBC Royal Bank / Angus Reid Forum. RBC 2024 Relationships & Money Poll. Published 2024-12-12.
Actual period: 2024-06-21 to 2024-06-26.
Population: Adults 25+ in a cohabiting relationship; Angus Reid Forum members. Overall report n=1,507.
Method: RBC-commissioned national online-panel survey; sample frame balanced by gender and region against Census data. Original release published by RBC through CNW.
Limitations: National table excludes N/A responses, so valid item denominators vary and are not supplied. A quoted hypothetical ±2.5-point probability-sample margin of error is not the actual uncertainty of this panel. Individual responses do not independently confirm both partners agree; categories across questions overlap.
Checked 2026-10-30. - [S07] TD Bank Group / Leger. Love Does Cost a Thing: 1 in 3 Canadians Going on Fewer Dates Due to Economic Conditions, TD Survey Finds. Published 2026-02-03.
Actual period: 2026-01-09 to 2026-01-13.
Population: Canadian adults, including relationship attitudes and hypothetical partner preferences. Overall report n=1,502.
Method: Leger Opinion online panel, weighted by age, gender, region and Quebec language against Census data.
Limitations: Adult attitudes are not all reports about an existing relationship. Exact item and generational valid bases are not published. The release’s hypothetical probability-sample ±2.5% is not a panel sampling-error estimate. Budget and money-talk prevalence are withheld here because partnered question bases are insufficiently clear.
Checked 2026-10-30. - [S08] Yangtao Huang, Francisco Perales and Mark Western / PLOS ONE. To pool or not to pool? Trends and predictors of banking arrangements within Australian couples. Published 2019-04-17.
Actual period: HILDA waves 2, 6, 10, 14: 2002, 2006, 2010, 2014.
Population: Selected co-resident different-sex couples; both partners have bank accounts and linked survey records. Overall report n=7,054.
Method: Original panel analysis: 15,379 couple-wave observations from 7,054 couples. Matched partner reports; at least one partner reporting a joint account is sufficient in the main definition. Random-effects logit/multinomial analyses.
Limitations: Pooled descriptive percentages are not a 2027 snapshot and are not 15,379 independent couples. Sample excludes same-sex couples and selected inconsistent/missing records. Some means are rounded. A 2026 AIFS synthesis gives different pooled figures; this resource uses the original 2019 paper. Associations are not causal effects.
Supporting documents: Original supporting document 1
Checked 2026-10-30. - [S09] Finder / Qualtrics. I love you, but: 2 in 5 Aussie couples don’t fully combine their finances. Published 2025-03-10.
Actual period: January 2025.
Population: Respondents with a partner. Overall report n=559.
Method: Original Finder Consumer Sentiment Tracker, operated by Qualtrics. Release gives a partnered analytic sample of 559.
Limitations: Recruitment, weights, exact field dates and subgroup bases are not fully disclosed. The tracker’s broader historical response count is not this release’s sample. Published response labels mix equal sharing with account structure. Rounded categories total 101%; do not force them to sum to 100 or rename equal sharing as joint-only accounts.
Checked 2026-10-30. - [S10] Pew Research Center. In a Growing Share of U.S. Marriages, Husbands and Wives Earn About the Same. Published 2023-04-13.
Actual period: CPS earnings 1972 and 2022; ATUS time use 2016–2021 pooled.
Population: Opposite-sex marriages with spouses ages 25–64; earnings and time-use eligibility varies. Selected analytic n not supplied in the cited summary.
Method: Original Pew analysis of CPS ASEC and pooled American Time Use Survey microdata (IPUMS). Earnings categories distinguish sole, primary and approximately equal earners.
Limitations: Not all ages, all couples or all marriage types. Egalitarian means each spouse earns 40%–60% of combined earnings, not exactly half and not proof of equal domestic work or decision power. Earnings exclude other concepts of total household wealth/income. Time-use evidence is pooled historical data, not collected in 2023.
Supporting documents: Original supporting document 1; Original supporting document 2
Checked 2026-10-30.
How to cite this resource
MyLittleDesire. Couples’ Money Management Statistics 2027: Accounts, Conversations and Shared Financial Roles. https://mylittledesire.com/couples-money-management-statistics/.