Sibling relationships can offer companionship, emotional support and a long shared history. They can also involve competition, distance and strained contact. A useful statistic makes clear which relationship, question and population it describes.
55 grouped findings from 11 original-source reports and analyses, four MyLittleDesire chart designs and 20 reproducible descriptive calculations. Related response categories stay grouped. The 164 recorded numeric inputs are not 164 independent findings or respondents.
What are the key sibling relationship findings?
54%
38% / 24%
US sibling-holders felt extremely or very close to at least one sibling in June 2025. Pew Research Center / SSRS [S01].
Were highly likely to seek sibling support / frequently received requests. These are different measures. Pew Research Center / SSRS [S01].
44% / 31%
51%
Women / men highly likely to turn to a sibling for support in that survey. Pew Research Center / SSRS [S01].
Were very or completely satisfied with current sibling ties in a US survey fielded in late 2021. Survey Center on American Life / American Enterprise Institute / NORC [S02].
48% / 30%
47%
Recalled very-close childhood ties without / with perceived parental favoritism; association only. Survey Center on American Life / American Enterprise Institute / NORC [S02].
People with living siblings who felt particularly close to at least one, in June 2026 GB research. YouGov GB [S03].
17% / 7%
46% / 29%
GB adults reporting temporary / permanent sibling cutoff in April 2021. Categories can overlap. YouGov GB [S04].
Sibling-holders recalling childhood / adult rivalry in February 2023. Not an individual resolution rate. YouGov US [S06].
50.4% / 26.5%
19 of 26
Calculated at-least-weekly contact for same-age / 10+-year-gap Australian sibling ties in 2008. Melbourne Institute / HILDA research team [S07].
South Australian consultation participants wanting more contact; a small volunteer sample. CREATE Foundation South Australia [S08].
37%
26% / 64%
Canadian children with separated/divorced parents who had a sibling in another home in 2019. Statistics Canada [S10].
Initial separation with one / five siblings in care in the selected England linkage cohort. Children’s Commissioner for England [S11].
Which sibling measures can be compared?
First match the population, question, time period and unit. At least one close sibling is different from a rating of one specific sibling, and neither describes every relationship in a family.
| Measure | What it captures | Keep this boundary |
|---|---|---|
| Closeness | A feeling about at least one sibling or a nominated tie | Check whether no-sibling and missing answers are excluded. |
| Support | Likelihood of seeking help or frequency of receiving requests | Hypothetical likelihood is not reported frequency or care hours. |
| Childhood recollection | An adult’s current account of an earlier relationship | Recall and current satisfaction are different outcomes. |
| Cutoff or estrangement | Deliberate non-contact or a defined contact/closeness threshold | Living elsewhere or having no living sibling does not mean estrangement. |
| Contact and proximity | A tie’s contact category or distance | A person can contribute multiple ties to a household study. |
| Care placement | Estimated separation within a defined care cohort | Children and sibling groups have different denominators. |
| Means and correlations | Scale averages and associations in selected cohorts | Do not convert rating points or r into percentages. |
How close do US adults feel to their siblings?
In June 2025, 54% of adults who answered the question and reported a sibling felt extremely or very close to at least one. The all-adult topline was lower because its base also included people without siblings.
| ID | Finding and qualification | Population, actual period and base | Original source and locator |
|---|---|---|---|
| F01 | Among adults answering the sibling-closeness question and reporting a sibling, 54% were extremely or very close to at least one; the all-adult topline was 49%. At least one sibling; not every sibling tie. | Noninstitutionalized adults 18+; principal estimates exclude no-sibling and missing responses as specified 2025-06-16 to 2025-06-29 Overall 6,871; closeness sibling-holder n=6,326; seeking support n=6,334; receiving requests n=6,335. Demographic valid bases differ. | Original source [S01] Article first chart; revised topline physical p.3, FAMCLSE_c.; revised topline FAMCLSE_c p.3, SUPPFAM_c pp.7–8, or SUPPFAMOFT_c p.12 as applicable. |
| F02 | The closeness responses included 24% extremely and 30% very close. Categories of the same question, not independent findings. | Noninstitutionalized adults 18+; principal estimates exclude no-sibling and missing responses as specified 2025-06-16 to 2025-06-29 Overall 6,871; closeness sibling-holder n=6,326; seeking support n=6,334; receiving requests n=6,335. Demographic valid bases differ. | Original source [S01] First chart; revised topline FAMCLSE_c p.3, SUPPFAM_c pp.7–8, or SUPPFAMOFT_c p.12 as applicable. |
| F03 | Closeness was 57% among women and 52% among men. Rounded group estimates; no new significance test. | Noninstitutionalized adults 18+; principal estimates exclude no-sibling and missing responses as specified 2025-06-16 to 2025-06-29 Overall 6,871; closeness sibling-holder n=6,326; seeking support n=6,334; receiving requests n=6,335. Demographic valid bases differ. | Original source [S01] Demographic bullets; revised topline FAMCLSE_c p.3, SUPPFAM_c pp.7–8, or SUPPFAMOFT_c p.12 as applicable. |
| F04 | Age-group closeness was 59% at 18–29, 50% at 30–64 and 62% at 65+. Cross-sectional groups, not a life-course trajectory. | Noninstitutionalized adults 18+; principal estimates exclude no-sibling and missing responses as specified 2025-06-16 to 2025-06-29 Overall 6,871; closeness sibling-holder n=6,326; seeking support n=6,334; receiving requests n=6,335. Demographic valid bases differ. | Original source [S01] Demographic bullets; revised topline FAMCLSE_c p.3, SUPPFAM_c pp.7–8, or SUPPFAMOFT_c p.12 as applicable. |
| F05 | Closeness estimates were 64% Black, 63% Hispanic, 56% Asian and 50% White. Source racial/ethnic definitions apply; Asian estimates cover English speakers. | Noninstitutionalized adults 18+; principal estimates exclude no-sibling and missing responses as specified 2025-06-16 to 2025-06-29 Overall 6,871; closeness sibling-holder n=6,326; seeking support n=6,334; receiving requests n=6,335. Demographic valid bases differ. | Original source [S01] Demographic bullets; revised topline FAMCLSE_c p.3, SUPPFAM_c pp.7–8, or SUPPFAMOFT_c p.12 as applicable. |
Having at least one close sibling does not mean every sibling tie is close. The age groups compare different people at one point in time; they do not show how any individual relationship changes with age.
How often do siblings provide emotional support?
The Pew survey found 38% highly likely to seek sibling support, while 24% reported frequent support requests from a sibling. Likelihood and frequency answer different questions.
| ID | Finding and qualification | Population, actual period and base | Original source and locator |
|---|---|---|---|
| F06 | 38% would be extremely/very likely to seek sibling emotional support; 24% said a sibling sought theirs extremely/very often. Hypothetical likelihood versus reported frequency; not matched reciprocal behavior. | Noninstitutionalized adults 18+; principal estimates exclude no-sibling and missing responses as specified 2025-06-16 to 2025-06-29 Overall 6,871; closeness sibling-holder n=6,326; seeking support n=6,334; receiving requests n=6,335. Demographic valid bases differ. | Original source [S01] Second chart: total; revised topline FAMCLSE_c p.3, SUPPFAM_c pp.7–8, or SUPPFAMOFT_c p.12 as applicable. |
| F07 | Seeking support: women 44%, men 31%. Sibling-holders; likelihood measure. | Noninstitutionalized adults 18+; principal estimates exclude no-sibling and missing responses as specified 2025-06-16 to 2025-06-29 Overall 6,871; closeness sibling-holder n=6,326; seeking support n=6,334; receiving requests n=6,335. Demographic valid bases differ. | Original source [S01] Second chart: gender; revised topline FAMCLSE_c p.3, SUPPFAM_c pp.7–8, or SUPPFAMOFT_c p.12 as applicable. |
| F08 | Frequent support requests from siblings: women 31%, men 16%. Respondent reports; does not measure care hours. | Noninstitutionalized adults 18+; principal estimates exclude no-sibling and missing responses as specified 2025-06-16 to 2025-06-29 Overall 6,871; closeness sibling-holder n=6,326; seeking support n=6,334; receiving requests n=6,335. Demographic valid bases differ. | Original source [S01] Second chart: gender; revised topline FAMCLSE_c p.3, SUPPFAM_c pp.7–8, or SUPPFAMOFT_c p.12 as applicable. |
| F09 | Seeking support by race/ethnicity: Black 46%, Hispanic 45%, White 35%, Asian 34%. Source definitions; Asian English-speaker coverage. | Noninstitutionalized adults 18+; principal estimates exclude no-sibling and missing responses as specified 2025-06-16 to 2025-06-29 Overall 6,871; closeness sibling-holder n=6,326; seeking support n=6,334; receiving requests n=6,335. Demographic valid bases differ. | Original source [S01] Second chart: race; revised topline FAMCLSE_c p.3, SUPPFAM_c pp.7–8, or SUPPFAMOFT_c p.12 as applicable. |
| F10 | Frequent requests: Black 38%, Hispanic 32%, Asian 22%, White 18%. Not a ranking of relationship quality. | Noninstitutionalized adults 18+; principal estimates exclude no-sibling and missing responses as specified 2025-06-16 to 2025-06-29 Overall 6,871; closeness sibling-holder n=6,326; seeking support n=6,334; receiving requests n=6,335. Demographic valid bases differ. | Original source [S01] Second chart: race; revised topline FAMCLSE_c p.3, SUPPFAM_c pp.7–8, or SUPPFAMOFT_c p.12 as applicable. |
| F11 | Seeking support by age: 39%, 38%, 35%, 39% for 18–29, 30–49, 50–64 and 65+. Age bands differ from the closeness comparison. | Noninstitutionalized adults 18+; principal estimates exclude no-sibling and missing responses as specified 2025-06-16 to 2025-06-29 Overall 6,871; closeness sibling-holder n=6,326; seeking support n=6,334; receiving requests n=6,335. Demographic valid bases differ. | Original source [S01] Second chart: age; revised topline FAMCLSE_c p.3, SUPPFAM_c pp.7–8, or SUPPFAMOFT_c p.12 as applicable. |
| F12 | Frequent requests by age: 31%, 26%, 20%, 17% for those same four groups. Different people observed once; not an aging effect. | Noninstitutionalized adults 18+; principal estimates exclude no-sibling and missing responses as specified 2025-06-16 to 2025-06-29 Overall 6,871; closeness sibling-holder n=6,326; seeking support n=6,334; receiving requests n=6,335. Demographic valid bases differ. | Original source [S01] Second chart: age; revised topline FAMCLSE_c p.3, SUPPFAM_c pp.7–8, or SUPPFAMOFT_c p.12 as applicable. |
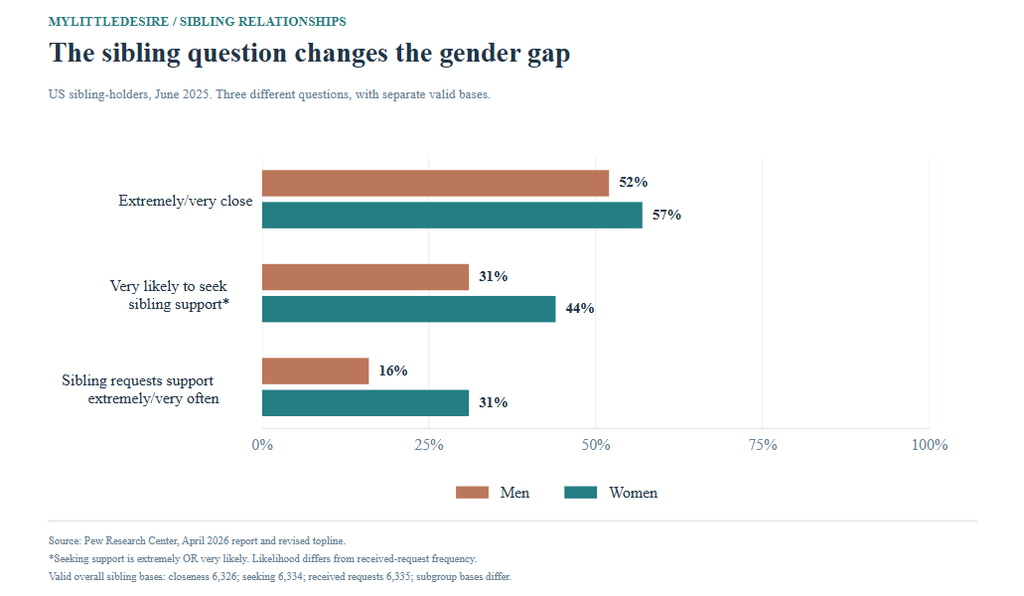
Women–men differences are five points for closeness, 13 for seeking support and 15 for receiving frequent requests (C01–C03). The latter two questions use different scales and slightly different valid bases. Their contrast does not measure a reciprocity deficit or identify unmet need.
Compare the distinct role of non-family ties in our friendship statistics resource.
How do childhood ties relate to adult sibling satisfaction?
A late-2021 US survey found substantial recalled childhood closeness, while 51% were highly satisfied with their current sibling relationships. Closeness and satisfaction are distinct outcomes.
| ID | Finding and qualification | Population, actual period and base | Original source and locator |
|---|---|---|---|
| F13 | Recalled childhood ties: 41% very close, 37% somewhat close, 22% not too/not at all close. Retrospective childhood reports, not current closeness. | US adults 18+; sibling-related items restricted to people who grew up with siblings or relevant subgroups 2021-11-23 to 2021-12-14 Overall 5,030; exact sibling/subgroup bases not printed beside retained estimates | Original source [S02] Sibling Relationships |
| F14 | Very-close childhood ties: middle children 48%, eldest 40%, youngest 35%. Birth order is associated, not randomly assigned. | US adults 18+; sibling-related items restricted to people who grew up with siblings or relevant subgroups 2021-11-23 to 2021-12-14 Overall 5,030; exact sibling/subgroup bases not printed beside retained estimates | Original source [S02] Sibling Relationships |
| F15 | Men recalling divorced parents: 29% very close to siblings; married parents: 41%. Family circumstances may confound the contrast. | US adults 18+; sibling-related items restricted to people who grew up with siblings or relevant subgroups 2021-11-23 to 2021-12-14 Overall 5,030; exact sibling/subgroup bases not printed beside retained estimates | Original source [S02] Sibling Relationships |
| F16 | Current sibling satisfaction: 51% very/completely, 30% somewhat, 18% unsatisfied. Rounding; satisfaction differs from closeness. | US adults 18+; sibling-related items restricted to people who grew up with siblings or relevant subgroups 2021-11-23 to 2021-12-14 Overall 5,030; exact sibling/subgroup bases not printed beside retained estimates | Original source [S02] Sibling Relationships |
| F17 | High adult satisfaction was 69% after very-close childhood ties versus 46% after somewhat-close ties. Retrospective association, not a causal prediction. | US adults 18+; sibling-related items restricted to people who grew up with siblings or relevant subgroups 2021-11-23 to 2021-12-14 Overall 5,030; exact sibling/subgroup bases not printed beside retained estimates | Original source [S02] Sibling Relationships |
The 69% versus 46% current-satisfaction comparison is conditional on recalled very-close versus somewhat-close childhood ties (C06). It is not a measured 23-point improvement, a prediction for a particular child or proof that birth order determines future relationships.
How is perceived parental favoritism associated with sibling ties?
Respondents who perceived no parental favorite reported closer childhood ties and higher current sibling satisfaction than those who perceived favoritism. The survey measures perceptions and associations.
| ID | Finding and qualification | Population, actual period and base | Original source and locator |
|---|---|---|---|
| F18 | 40% perceived a parental favorite and 60% did not. Perceived favoritism, not independently observed parenting. | US adults 18+; sibling-related items restricted to people who grew up with siblings or relevant subgroups 2021-11-23 to 2021-12-14 Overall 5,030; exact sibling/subgroup bases not printed beside retained estimates | Original source [S02] Parental Favoritism |
| F19 | Perceived favoritism: women 45%, men 35%. Different respondents; reporting may differ. | US adults 18+; sibling-related items restricted to people who grew up with siblings or relevant subgroups 2021-11-23 to 2021-12-14 Overall 5,030; exact sibling/subgroup bases not printed beside retained estimates | Original source [S02] Parental Favoritism |
| F20 | Perceived favoritism: divorced-parent childhoods 51%, married-parent childhoods 38%. Association only. | US adults 18+; sibling-related items restricted to people who grew up with siblings or relevant subgroups 2021-11-23 to 2021-12-14 Overall 5,030; exact sibling/subgroup bases not printed beside retained estimates | Original source [S02] Parental Favoritism |
| F21 | Very-close childhood sibling ties: no perceived favorite 48%, perceived favorite 30%. Retrospective and potentially confounded. | US adults 18+; sibling-related items restricted to people who grew up with siblings or relevant subgroups 2021-11-23 to 2021-12-14 Overall 5,030; exact sibling/subgroup bases not printed beside retained estimates | Original source [S02] Negative Consequences of Favoritism |
| F22 | High current sibling satisfaction: no perceived favorite 58%, perceived favorite 42%. Not proof that favoritism caused the difference. | US adults 18+; sibling-related items restricted to people who grew up with siblings or relevant subgroups 2021-11-23 to 2021-12-14 Overall 5,030; exact sibling/subgroup bases not printed beside retained estimates | Original source [S02] Negative Consequences of Favoritism |
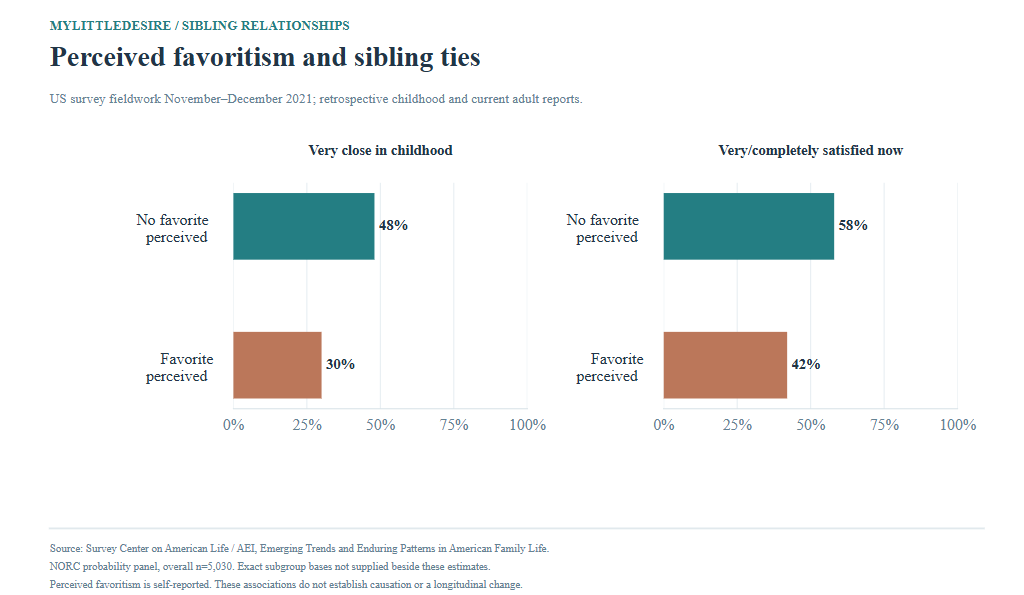
The descriptive gaps are 18 points for childhood very-close ties and 16 points for current high satisfaction (C04–C05). These are different questions; subtracting the gaps would not show that an effect fades over time. The source already discusses these contrasts.
What do British surveys reveal about sibling ties?
YouGov’s June 2026 report found 47% of living-sibling holders particularly close to a sibling and 18% with a bad sibling relationship. A person may have different relationships with different siblings.
| ID | Finding and qualification | Population, actual period and base | Original source and locator |
|---|---|---|---|
| F23 | The article reported 47% particularly close to at least one sibling among people with living siblings; the all-respondent table reported 40%. Living-relative base; wording differs from Pew. | GB adult survey; distinguish all respondents from holders of living siblings 2026-06-02 to 2026-06-03 Initial n=1,939; later all-respondent items unweighted n=1,929 / weighted base 1,928. Exact sibling-holder denominator behind article percentages not printed in inspected rows. | Original source [S03] Article Which family members; original PDF physical p.4, sibling row. |
| F24 | A bad relationship with at least one sibling was reported by 18% of living-sibling holders in the article, versus 15% on the all-respondent PDF base. May overlap with having a close relationship with another sibling. | GB adult survey; distinguish all respondents from holders of living siblings 2026-06-02 to 2026-06-03 Initial n=1,939; later all-respondent items unweighted n=1,929 / weighted base 1,928. Exact sibling-holder denominator behind article percentages not printed in inspected rows. | Original source [S03] Article bad relationships; original PDF physical p.4. |
| F27 | In the initial living-relative question, 45% had more than one living sibling, 39% had one, 16% had none and 1% did not know. Rounded categories total 101%. No living sibling does not mean grew up an only child. | GB adult survey; distinguish all respondents from holders of living siblings 2026-06-02 to 2026-06-03 1,939 unweighted / weighted overall | Original source [S03] Original results physical p.1, Brothers and sisters. |
| F28 | Seven percent reported living with a sibling; this was 41% among ages 18–24 and 1% among ages 55+. Co-residence is not emotional closeness. Question includes significant periods of the year. | GB adult survey; distinguish all respondents from holders of living siblings 2026-06-02 to 2026-06-03 Overall unweighted 1,929; age subgroup bases 189 and 842 | Original source [S03] Original results physical p.2, current family co-residence. |
The full tables report 40% close and 15% with a bad relationship on the wider respondent base. Preserve the base beside each number. Living-sibling availability differs from childhood sibship, and co-residence does not establish emotional closeness. The questions do not support a directly comparable US–GB closeness ranking.
How common is stopping contact with a sibling?
In a separate April 2021 GB survey, 17% of adults reported deliberately stopping sibling contact temporarily and 7% permanently. These are lifetime self-reports on an all-adult base.
| ID | Finding and qualification | Population, actual period and base | Original source and locator |
|---|---|---|---|
| F25 | 17% reported temporarily cutting sibling contact and 7% permanently. Historical self-reports; categories must not be added without checking overlap. | GB adults; all-adult base, not restricted to sibling-holders 2021-04-19 to 2021-04-20 1,693 overall; unweighted age bases 144 / 737 / 412 / 400 | Original source [S04] Original one-page table, temporary and permanent sibling rows; physical p.1. |
| F26 | Temporary sibling cutoff by age was 9% at 18–24, 19% at 25–49, 19% at 50–64 and 14% at 65+. Unequal lifetime exposure; not a generational cause. | GB adults; all-adult base, not restricted to sibling-holders 2021-04-19 to 2021-04-20 1,693 overall; unweighted age bases 144 / 737 / 412 / 400 | Original source [S04] Original one-page table, temporary sibling row, age columns. |
Temporary and permanent answers can overlap across episodes or siblings. Their ten-point marginal difference (C09) is not a reconciliation rate. A person’s description of a cutoff as permanent cannot establish what happens later. See our broader family estrangement resource for other definitions.
Related: family estrangement statistics.
How do adults feel about their childhood sibling situation?
YouGov’s October 2023 survey found that preferred sibling counts often matched people’s actual childhood counts. Some only children enjoyed their position, while others disliked it.
| ID | Finding and qualification | Population, actual period and base | Original source and locator |
|---|---|---|---|
| F29 | Among people who grew up with one sibling, 40% preferred one, 28% preferred two and 18% preferred none. Selected responses, not the complete distribution; childhood desires recalled now. | US adult citizens; item bases depend on childhood sibling number and birth order 2023-10-06 to 2023-10-27 2,000 overall; subgroup effective sample sizes not independently verified | Original source [S05] Article preference paragraph; original Q17/crosstabs. |
| F30 | Among people who grew up with two siblings, 55% preferred two; among those with three, 59% preferred three. Separate populations; not the percentage of all adults satisfied with their siblings. | US adult citizens; item bases depend on childhood sibling number and birth order 2023-10-06 to 2023-10-27 2,000 overall; subgroup effective sample sizes not independently verified | Original source [S05] Article preference paragraph; original Q17/crosstabs. |
| F31 | Only-child feelings included 21% who loved it, 18% who liked it, 16% who disliked it and 7% who hated it. Selected categories; neutral/uncertain responses are not removed to rescale the distribution. | US adult citizens; item bases depend on childhood sibling number and birth order 2023-10-06 to 2023-10-27 2,000 overall; subgroup effective sample sizes not independently verified | Original source [S05] Article only-child paragraph; original Q18/crosstabs. |
| F32 | The survey classified 12% as only children, 30% as oldest siblings, 32% as middle children and 26% as youngest siblings. These survey categories do not establish that birth order causes personality or relationship quality. | US adult citizens; item bases depend on childhood sibling number and birth order 2023-10-06 to 2023-10-27 2,000 overall; subgroup effective sample sizes not independently verified | Original source [S05] Original topline physical p.3, Q15. |
Preferences are not relationship-quality measures. A belief that birth order shaped personality does not establish a measured personality effect. The publication date in November is separate from October interviewing.
Do sibling rivalries continue into adulthood?
A February 2023 US survey found lower reported adult rivalry than recalled childhood rivalry among sibling-holders. It also measured opinions about rivalry and parental comparisons.
| ID | Finding and qualification | Population, actual period and base | Original source and locator |
|---|---|---|---|
| F33 | Forty-six percent of sibling-holders recalled childhood rivalry and 29% reported rivalry in adulthood. No joint transition table was analyzed; do not claim a percentage of childhood rivals reconciled. | US adult citizens; reported rivalries restricted to people who say they have siblings; attitudes asked of all respondents 2023-02-03 to 2023-02-05 1,000 overall; exact valid subgroup bases in original cross-tabs, not inferred from overall N | Original source [S06] Original topline physical p.2, Q10–11. |
| F34 | Childhood rivalry was reported by 50% of middle, 44% of oldest and 46% of youngest siblings. Rounded subgroup estimates; not proof of a universal middle-child effect. | US adult citizens; reported rivalries restricted to people who say they have siblings; attitudes asked of all respondents 2023-02-03 to 2023-02-05 1,000 overall; exact valid subgroup bases in original cross-tabs, not inferred from overall N | Original source [S06] Article main paragraph / original Q10 birth-order cross-tabs. |
| F35 | On long-term effects of childhood rivalry, 21% expected help, 25% harm, 33% neither and 21% were unsure. All-adult beliefs about rivalry, not observed longitudinal effects. | All US adult citizen respondents 2023-02-03 to 2023-02-05 1,000 overall; exact valid subgroup bases in original cross-tabs, not inferred from overall N | Original source [S06] Original topline physical p.1, Q4. |
| F36 | Sixty-eight percent called parental comparisons of siblings’ athletic abilities unfair; 68% also called academic comparisons unfair. Separate questions with equal marginals; not proof the same people gave both answers. | All US adult citizen respondents 2023-02-03 to 2023-02-05 1,000 overall; exact valid subgroup bases in original cross-tabs, not inferred from overall N | Original source [S06] Original topline physical p.1, Q2–3. |
The 17-point marginal difference (C08) does not identify the proportion whose childhood rivalry ended. Attitudes that comparison is unfair are different from observed parenting behavior, and ordinary competition should not be conflated with aggression or abuse.
How do Australian sibling contact and proximity vary?
HILDA’s 2008 module shows contact patterns by respondent gender, sibling gender, age gap and sibling type. Its descriptive unit is each non-resident sibling tie, rather than each Australian person.
| ID | Finding and qualification | Population, actual period and base | Original source and locator |
|---|---|---|---|
| F37 | Daily contact was reported for 3.4% of men’s and 6.0% of women’s sibling ties; the once-per-week category was 22.5% and 27.7%, respectively. The once-weekly row excludes daily contact; it is not an at-least-weekly total. | People with living siblings outside their household; descriptive unit is the non-resident sibling tie, not the respondent HILDA Wave 8, 2008 Exact chapter-specific tie and person counts not printed beside descriptive tables; national household panel, ages 15+ interview population | Original source [S07] Printed p.173 / physical p.182, Table 32.1. |
| F38 | Women’s sibling ties had daily contact of 8.4% with sisters versus 3.5% with brothers, and once-weekly contact of 32.8% versus 22.4%. Reports from one side of a tie, not confirmed reciprocal exchanges. | People with living siblings outside their household; descriptive unit is the non-resident sibling tie, not the respondent HILDA Wave 8, 2008 Exact chapter-specific tie and person counts not printed beside descriptive tables; national household panel, ages 15+ interview population | Original source [S07] Printed p.173 / physical p.182, Table 32.1. |
| F39 | Daily contact across age gaps of 0, >0–<3, 3–<6, 6–<10 and 10+ years was 9.8%, 5.2%, 4.8%, 4.8% and 4.0%; once-weekly contact was 40.6%, 26.7%, 26.3%, 25.4% and 22.5%. These mutually exclusive contact categories can be added within the same age-gap column; no new significance test. | People with living siblings outside their household; descriptive unit is the non-resident sibling tie, not the respondent HILDA Wave 8, 2008 Exact chapter-specific tie and person counts not printed beside descriptive tables; national household panel, ages 15+ interview population | Original source [S07] Printed p.173 / physical p.182, Table 32.2. |
| F40 | Same-age sibling ties were within 20 km in 28.8% of cases and overseas in 11.2%; at gaps of 10+ years, these were 21.5% and 22.3%. Proximity is not warmth or satisfaction. Do not equate age-gap association with an age-gap effect. | People with living siblings outside their household; descriptive unit is the non-resident sibling tie, not the respondent HILDA Wave 8, 2008 Exact chapter-specific tie and person counts not printed beside descriptive tables; national household panel, ages 15+ interview population | Original source [S07] Printed p.173 / physical p.182, Table 32.2 distance rows. |
| F41 | Never-contact estimates were 6.0% for full sibling ties, 23.0% for half, 12.2% for adopted and 24.3% for step ties. Unadjusted categories; do not attribute differences to genetics. Rare starred daily-contact cells are not used. | People with living siblings outside their household; descriptive unit is the non-resident sibling tie, not the respondent HILDA Wave 8, 2008 Exact chapter-specific tie and person counts not printed beside descriptive tables; national household panel, ages 15+ interview population | Original source [S07] Printed p.174 / physical p.183, Table 32.3. |
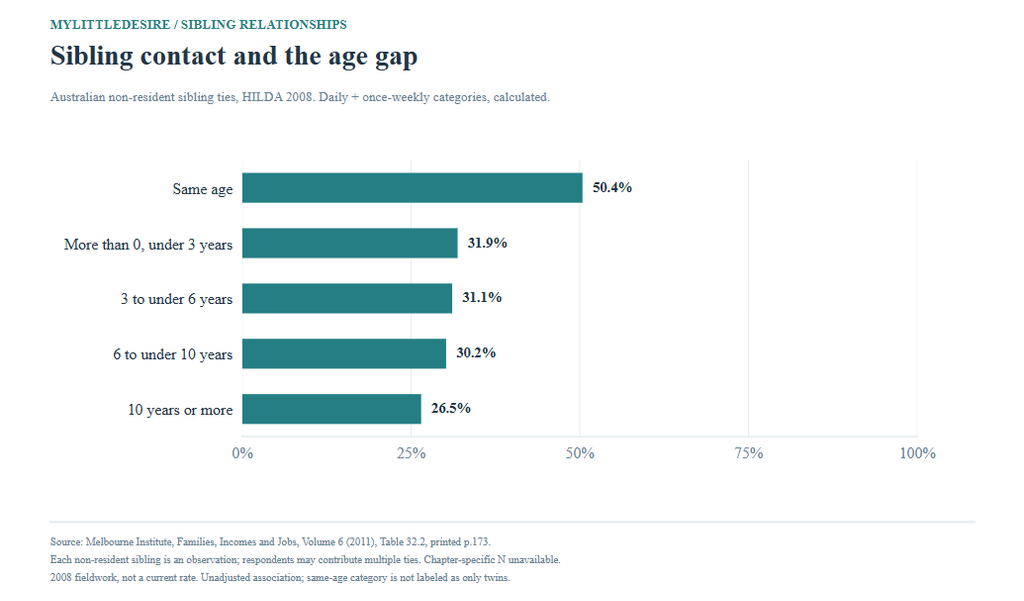
Daily and once-weekly categories can be added within each age-gap column (C10–C14). The calculated shares range from 50.4% for same-age ties to 26.5% at gaps of ten years or more. These historical, unadjusted estimates do not prove an age-gap effect. Never-contact differences by sibling type also do not establish a genetic explanation (C15).
What do young people in care say about sibling contact?
A South Australian consultation with 26 volunteering care-experienced young people documented the importance of sibling contact and a common desire for more time together. It does not estimate population prevalence.
| ID | Finding and qualification | Population, actual period and base | Original source and locator |
|---|---|---|---|
| F42 | Eighteen of 26 participants (69% rounded) lived with no siblings; six lived with one and two lived with two. All participants had at least one sibling elsewhere; this is a selected consultation, not a population separation rate. | Volunteering clubCREATE members aged 12–18 with care experience and one or more siblings Exact interview dates not reported in checked methods; report March 2023; contact questions reference previous year 26 participants overall; contact-happiness item n=25; other bases labeled | Original source [S08] Physical pp.11–12, Sibling Connections / Figure 1. |
| F43 | Sixteen of 26 (62% rounded) gave time with non-resident siblings the maximum importance score. Maximum was 6 on a 1–6 importance scale; not an overall relationship-quality score. | Volunteering clubCREATE members aged 12–18 with care experience and one or more siblings Exact interview dates not reported in checked methods; report March 2023; contact questions reference previous year 26 participants overall; contact-happiness item n=25; other bases labeled | Original source [S08] Physical pp.21–22, Figure 8 and accompanying text. |
| F44 | Twelve of 25 participants rated contact happiness 1–3 and 13 rated it 4–6: 48% versus 52%. The report grouped 1–3 as unhappy and 4–6 as happy; preserve these thresholds. | Volunteering clubCREATE members aged 12–18 with care experience and one or more siblings Exact interview dates not reported in checked methods; report March 2023; contact questions reference previous year 26 participants overall; contact-happiness item n=25; other bases labeled | Original source [S08] Physical pp.23–24, Timing and Frequency / Figure 9. |
| F45 | Nineteen of 26 (73% rounded) wanted more sibling contact; six wanted the same and one wanted less. No individual cross-tab with happiness was inspected; do not identify which participants wanted more. | Volunteering clubCREATE members aged 12–18 with care experience and one or more siblings Exact interview dates not reported in checked methods; report March 2023; contact questions reference previous year 26 participants overall; contact-happiness item n=25; other bases labeled | Original source [S08] Physical p.24, desired connection / Figure 10. |
Nineteen participants wanted more contact, reproducing the source’s rounded 73% (C19). Contact happiness used 25 valid responses and a different question. No individual cross-tab was analyzed, so the marginals cannot show which satisfied participants wanted more contact or which wanted less.
What do selected older adults report about sibling ties?
A 2015 US family-cohort study found modest mean warmth and relatively low conflict in participants’ nominated sibling ties. Participants rated the living sibling closest in age.
| ID | Finding and qualification | Population, actual period and base | Original source and locator |
|---|---|---|---|
| F46 | Mean sibling warmth was 2.75 and conflict 1.32 on their separate 1–5 scales. Different constructs; these are not percentages. Keep the modest mid-scale warmth level visible. | White older adults in the Later Adulthood Study, rating the living sibling closest in age, not necessarily closest emotionally 2015 608 respondents; mean age 64.6; 329 men and 279 women; includes couples from the same households | Original source [S09] Original manuscript Table 1 and Sibling Relationship Quality results. |
| F47 | Mean parental-favoritism discrepancy was 0.59 on a 0–2 scale. Zero means neither sibling favored; 1 sometimes and 2 usually favors one sibling. Not 59% experiencing favoritism. | White older adults in the Later Adulthood Study, rating the living sibling closest in age, not necessarily closest emotionally 2015 608 respondents; mean age 64.6; 329 men and 279 women; includes couples from the same households | Original source [S09] Original manuscript Table 1 / Measures. |
| F48 | Mean warmth was 3.26 for sister–sister ties, 2.46 for brother–brother, 2.66 for older-sister/younger-brother and 2.64 for older-brother/younger-sister ties. Unadjusted descriptive means; source inferential degrees of freedom were not used for a new significance claim. | White older adults in the Later Adulthood Study, rating the living sibling closest in age, not necessarily closest emotionally 2015 608 respondents; mean age 64.6; 329 men and 279 women; includes couples from the same households | Original source [S09] Original manuscript Sibling Relationship Quality results paragraph. |
| F49 | Contact and warmth were correlated at r=0.54; contact and conflict had r=0.03, which was not marked significant in the source table. The published null stays visible; greater contact is not proven to reduce conflict. | White older adults in the Later Adulthood Study, rating the living sibling closest in age, not necessarily closest emotionally 2015 608 respondents; mean age 64.6; 329 men and 279 women; includes couples from the same households | Original source [S09] Original manuscript Table 2, contact row. |
The sister–sister versus brother–brother warmth difference is 0.80 points on a five-point scale (C16), a descriptive contrast in a selected white Midwestern cohort. Contact was associated with warmth, while its near-zero correlation with conflict was not marked significant. More contact is not proven to reduce conflict.
For the broader demands of helping relatives, see our family caregiving and relationship statistics.
How can parental separation change sibling households?
Among Canadian children aged 1–17 who had experienced parental separation or divorce, 37% had a sibling living elsewhere in 2019. Some lived with half- or stepsiblings.
| ID | Finding and qualification | Population, actual period and base | Original source and locator |
|---|---|---|---|
| F50 | Among children aged 1–17 who had experienced parental separation/divorce, 37% had a sibling in a different home. Do not describe this as 37% of all Canadian children, or as an estrangement rate. | Children aged 1–17 who had experienced parental separation or divorce 2019 Canadian Health Survey on Children and Youth Exact valid sibling-item sample size not supplied in the original infographic; do not use the population estimate as sample N | Original source [S10] Original infographic Did you know? / among children with separation list. |
| F51 | Within that separated/divorced-parent group, 17% lived with a half-sibling and 5% with a stepsibling. Not mutually exclusive; do not sum as unique children without a joint table. | Children aged 1–17 who had experienced parental separation or divorce 2019 Canadian Health Survey on Children and Youth Exact valid sibling-item sample size not supplied in the original infographic; do not use the population estimate as sample N | Original source [S10] Original infographic among children with separation list. |
Living in different homes does not measure lack of contact or estrangement. The half- and stepsibling categories can overlap. This Canadian statistic cannot be compared as a national rate with England’s care-placement measure, even though both contain the same rounded percentage.
How often are siblings separated in initial care placements?
The Children’s Commissioner’s linked-cohort analysis estimated initial sibling separation among qualifying children in England. It linked Spring 2016 school data to care episodes extending through March 2022.
| ID | Finding and qualification | Population, actual period and base | Original source and locator |
|---|---|---|---|
| F52 | An estimated 37% (about 20,000 children) of the qualifying linked cohort were separated from at least one sibling in their initial placement. This does not estimate today’s separation prevalence among all children in England. | Linked cohort with at least one sibling in state school and also in care; not all children currently in care Spring 2016 school census linked to care episodes 1992-03-31 through 2022-03-31; initial placements analyzed Approximately 55,000 qualifying children; subgroup sample counts not printed beside every plotted percentage | Original source [S11] Physical pp.15–16, methods and results. |
| F53 | Estimated initial separation was 26% for children with one sibling in care, 43% with two, 57% with three and 64% with five. Sibling count excludes the focal child; one sibling means a two-child sibling group. These are descriptive cohort estimates. | Linked cohort with at least one sibling in state school and also in care; not all children currently in care Spring 2016 school census linked to care episodes 1992-03-31 through 2022-03-31; initial placements analyzed Approximately 55,000 qualifying children; subgroup sample counts not printed beside every plotted percentage | Original source [S11] Physical p.16, Figure 1 and results. |
| F54 | Separation estimates were 93% in semi-independent accommodation, 78% in children’s homes and 30% in relative/friend foster placements. Raw group shares are not an adjusted causal effect of placement. The source separately notes age-controlled associations. | Linked cohort with at least one sibling in state school and also in care; not all children currently in care Spring 2016 school census linked to care episodes 1992-03-31 through 2022-03-31; initial placements analyzed Approximately 55,000 qualifying children; subgroup sample counts not printed beside every plotted percentage | Original source [S11] Physical pp.17–18, Figure 3 and results. |
| F55 | Among split sibling groups, 59% remained within one local authority, 39% were split across two and 2% across three or four. The base is separated sibling groups, not all children or all sibling groups. | Linked cohort with at least one sibling in state school and also in care; not all children currently in care Spring 2016 school census linked to care episodes 1992-03-31 through 2022-03-31; initial placements analyzed Approximately 55,000 qualifying children; subgroup sample counts not printed beside every plotted percentage | Original source [S11] Physical p.16, initial-placement results. |
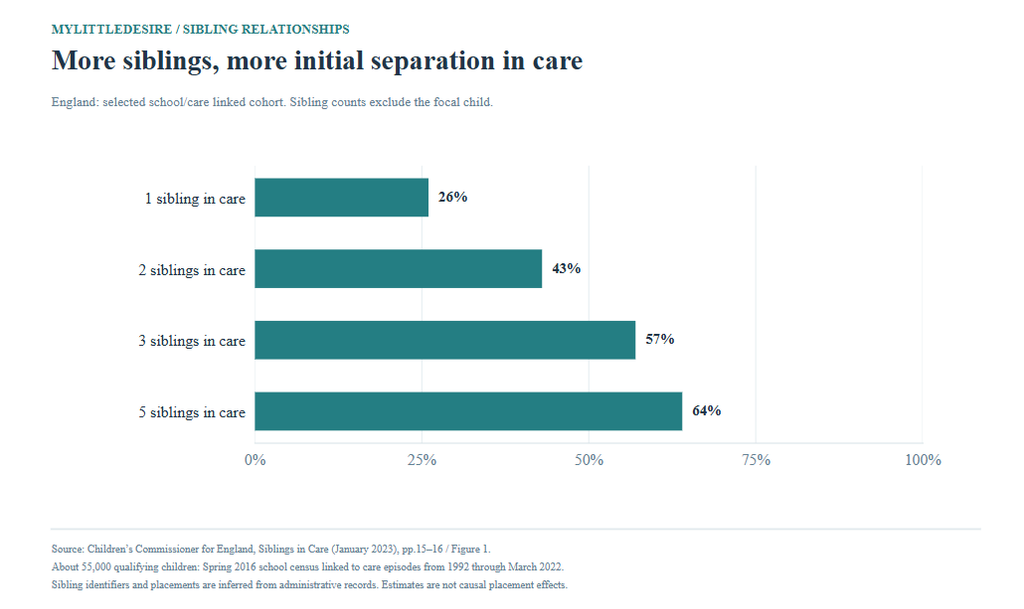
The one-versus-five-sibling comparison is a 38-point difference and a descriptive ratio of approximately 2.46 (C17–C18). One sibling in care means a two-child sibling group including the focal child. Among separated sibling groups, 41% were split across multiple authorities (C20). These are different denominators and are not current prevalence among all children in care.
What descriptive comparisons does MyLittleDesire provide?
The contribution is convenient source comparison, transparent arithmetic and chart design. Several contrasts were already visible or discussed in the originals. These calculations are not original fieldwork, new causal estimates or novel scientific discoveries.
| ID | Comparison | Result | Named-input formula and boundary | Original research |
|---|---|---|---|---|
| C01 | Pew closeness: women minus men | 5.0 percentage points | f03_1-f03_2 Unadjusted descriptive difference of rounded estimates; no new causal or significance claim. | Pew Research Center / SSRS [S01] |
| C02 | Pew seeking support: women minus men | 13.0 percentage points | f07_1-f07_2 Unadjusted descriptive difference of rounded estimates; no new causal or significance claim. | Pew Research Center / SSRS [S01] |
| C03 | Pew received frequent requests: women minus men | 15.0 percentage points | f08_1-f08_2 Unadjusted descriptive difference of rounded estimates; no new causal or significance claim. | Pew Research Center / SSRS [S01] |
| C04 | SCAL childhood closeness: no favorite minus favorite | 18.0 percentage points | f21_1-f21_2 Unadjusted descriptive difference of rounded estimates; no new causal or significance claim. | Survey Center on American Life / American Enterprise Institute / NORC [S02] |
| C05 | SCAL adult satisfaction: no favorite minus favorite | 16.0 percentage points | f22_1-f22_2 Unadjusted descriptive difference of rounded estimates; no new causal or significance claim. | Survey Center on American Life / American Enterprise Institute / NORC [S02] |
| C06 | SCAL adult satisfaction by recalled childhood closeness | 23.0 percentage points | f17_1-f17_2 Unadjusted descriptive difference of rounded estimates; no new causal or significance claim. | Survey Center on American Life / American Enterprise Institute / NORC [S02] |
| C07 | SCAL childhood closeness: middle minus youngest | 13.0 percentage points | f14_1-f14_3 Unadjusted descriptive difference of rounded estimates; no new causal or significance claim. | Survey Center on American Life / American Enterprise Institute / NORC [S02] |
| C08 | YouGov childhood minus adult rivalry | 17.0 percentage points | riv_child-riv_adult Marginals do not identify individuals whose rivalry resolved. | YouGov US [S06] |
| C09 | GB temporary minus permanent cutoff | 10.0 percentage points | f25_1-f25_2 Separate questions can overlap; not a reconciliation rate. | YouGov GB [S04] |
| C10 | HILDA at-least-weekly contact: Same age | 50.4 % | hil_gap0_d+hil_gap0_w Adds mutually exclusive daily and once-weekly categories within one age-gap column; historical sibling-tie denominator. | Melbourne Institute / HILDA research team [S07] |
| C11 | HILDA at-least-weekly contact: Gap >0–<3 | 31.9 % | hil_gap3_d+hil_gap3_w Adds mutually exclusive daily and once-weekly categories within one age-gap column; historical sibling-tie denominator. | Melbourne Institute / HILDA research team [S07] |
| C12 | HILDA at-least-weekly contact: Gap 3–<6 | 31.1 % | hil_gap6_d+hil_gap6_w Adds mutually exclusive daily and once-weekly categories within one age-gap column; historical sibling-tie denominator. | Melbourne Institute / HILDA research team [S07] |
| C13 | HILDA at-least-weekly contact: Gap 6–<10 | 30.2 % | hil_gap10_d+hil_gap10_w Adds mutually exclusive daily and once-weekly categories within one age-gap column; historical sibling-tie denominator. | Melbourne Institute / HILDA research team [S07] |
| C14 | HILDA at-least-weekly contact: Gap 10+ | 26.5 % | hil_gapplus_d+hil_gapplus_w Adds mutually exclusive daily and once-weekly categories within one age-gap column; historical sibling-tie denominator. | Melbourne Institute / HILDA research team [S07] |
| C15 | HILDA step minus full ties: never contact | 18.3 percentage points | hil_step_never-hil_full_never Unadjusted ties; no genetic explanation established. | Melbourne Institute / HILDA research team [S07] |
| C16 | Older cohort warmth: sister–sister minus brother–brother | 0.80 rating points, 1–5 | older_ss-older_bb Selected cohort and one nominated sibling per respondent; no causal gender effect. | Stocker, Gilligan, Klopack, Conger, Lanthier, Neppl, O’Neal and Wickrama [S09] |
| C17 | England initial separation: five minus one sibling in care | 38.0 percentage points | eng_sib5-eng_sib1 Selected linked cohort; sibling count excludes focal child. | Children’s Commissioner for England [S11] |
| C18 | England initial separation: five / one sibling in care | 2.46× | eng_sib5/eng_sib1 Descriptive ratio of rounded shares, not adjusted causal risk. | Children’s Commissioner for England [S11] |
| C19 | CREATE participants wanting more contact | 73.1 % | create_more_n/create_total*100 Count-based reproduction of the report’s rounded 73%; not a novel finding or population estimate. | CREATE Foundation South Australia [S08] |
| C20 | England separated groups across multiple authorities | 41.0 % | eng_la2+eng_la3 Mutually exclusive group categories; not percentages of children. | Children’s Commissioner for England [S11] |
What should readers check before quoting?
Are 54% in the US and 47% in Britain directly comparable?
No. Survey wording, field dates, eligible relatives and sampling differ. A seven-point national relationship-quality gap is not established.
Can a person have both a close and a strained sibling relationship?
Yes, when different siblings or different aspects of a relationship are involved. Marginal answers do not establish the joint overlap.
Does living apart mean siblings are estranged?
No. Co-residence, frequency of contact, emotional closeness and deliberate cutoff are separate measures.
Does birth order cause the patterns in these tables?
The retained surveys and descriptive tables do not establish that. Retrospective beliefs, family structure and selection can influence the associations.
Do these statistics mean contact should always be increased?
No. The research describes different experiences and contexts. It does not establish what is appropriate for an individual relationship.
Are the care findings national estimates for all children?
No. The South Australian findings come from a small volunteer consultation. The England estimates concern a specific linked school/care cohort and initial placements.
How were the statistics selected and checked?
We selected original survey reports, statistical-agency releases, an original household-panel analysis, an author manuscript and original care reports. Sources were reviewed on October 27, 2026. The selection is targeted rather than an exhaustive systematic review. Publication years differ from collection years, and missing field dates are disclosed.
The source database records a stable finding ID, values and units, direct URL, publication and data periods, geography, population, available sample size, method, exact page/table/section locator, definitions and caveats. Related categories stay grouped to avoid inflating the finding count. Four YouGov reports contribute 14 of the 55 grouped findings; source reports are not independent organizations or replications.
Original reporting was checked, rather than independently reproducing the fieldwork. The older-adult manuscript was read through the documented public NCBI BioC service when normal host access challenged retrieval. Raw microdata, narrative coding, adjusted models and causal effects were not independently rerun. Unresolved source inconsistencies are separated from the retained numeric core.
Each calculation uses named inputs within one source. Percentage points, percentages, ratios and scale points retain their units. Decimal rounding avoids floating-point display artifacts. HILDA’s at-least-weekly sums add mutually exclusive daily and once-weekly categories; calculations do not pool countries, dates or incompatible questions. Missing confidence intervals were not invented.
What are the main limitations?
- Probability panels, opt-in polls, volunteer consultations, selected family cohorts and administrative linkage have different coverage.
- Some item/subgroup bases and exact field dates remain unavailable. Overall sample size is not a subgroup denominator.
- Self-reports, childhood recall and perceived favoritism can be influenced by memory and current circumstances.
- Historical Australian contact estimates are useful dated context, not a current national baseline.
- Care-experienced youth and linked school/care cohorts are not representative of every sibling relationship.
- Association does not establish causation. No pooled global rate, longitudinal reconciliation rate or universal relationship advice is claimed.
Complete original-source bibliography
- S01 · Pew Research Center / SSRS. About half of Americans with siblings are close to at least one of them. Published: 2026-04-07; revised questions/topline 2026-04-10. Actual period: 2025-06-16 to 2025-06-29. Sample: Overall 6,871; closeness sibling-holder n=6,326; seeking support n=6,334; receiving requests n=6,335. Demographic valid bases differ.. Method: ATP Wave 174 probability-panel sample plus SSRS Opinion Panel Black-adult oversample; 3,657 ATP and 3,214 additional SSRS respondents; weighted; primarily online plus live telephone; full-sample margin ±2.1 points. Limits: Self-reports. At least one sibling differs from all siblings. Closeness, hypothetical support likelihood and received-request frequency are separate measures with slightly different valid bases. Asian estimates represent English speakers. Supporting original material: Original tables, paper or methods, Original tables, paper or methods.
- S02 · Survey Center on American Life / American Enterprise Institute / NORC. Emerging Trends and Enduring Patterns in American Family Life. Published: 2022-02-09. Actual period: 2021-11-23 to 2021-12-14. Sample: Overall 5,030; exact sibling/subgroup bases not printed beside retained estimates. Method: NORC AmeriSpeak probability panel, online/telephone, weighted; Mormon/Jewish oversamples; overall margin ±1.87 points and design effect 1.83. Limits: Retrospective childhood reports and current satisfaction differ. Perceived favoritism is not observed treatment. Associations are not causal; overall margin does not establish subgroup precision.
- S03 · YouGov GB. Section one: how close are British families? / Big Surveys: Family. Published: 2026-07-09. Actual period: 2026-06-02 to 2026-06-03. Sample: Initial n=1,939; later all-respondent items unweighted n=1,929 / weighted base 1,928. Exact sibling-holder denominator behind article percentages not printed in inspected rows.. Method: Original article plus full results PDF; weighted GB survey; detailed sample recruitment/weight targets not separately audited in this task. Limits: Closeness and strained ties may coexist across different siblings. Article percentages for living-relative holders differ from all-respondent PDF rows; do not derive precise holder rates by dividing rounded cells. Supporting original material: Original tables, paper or methods.
- S04 · YouGov GB. It’s not just Harry and William: 17% of Britons have stopped speaking to their sibling. Published: 2021-06-10. Actual period: 2021-04-19 to 2021-04-20. Sample: 1,693 overall; unweighted age bases 144 / 737 / 412 / 400. Method: Original one-page weighted results; lifetime temporary and permanent cutoff are separate select-all questions; exact opt-in recruitment details not supplied in table. Limits: Temporary/permanent answers may overlap. A reported permanent cutoff is a respondent’s description at interview, not proof it never ends. All-adult denominator differs from sibling-holder surveys. Supporting original material: Original tables, paper or methods.
- S05 · YouGov US. Most only children wish they had at least one sibling. Published: 2023-11-09. Actual period: 2023-10-06 to 2023-10-27. Sample: 2,000 overall; subgroup effective sample sizes not independently verified. Method: Original weighted opt-in poll and 36-page results; overall reported margin ±2.8 points. Limits: Preferences and beliefs about birth order are self-reports, not evidence birth order causes personality. Overall sample does not establish subgroup precision. Supporting original material: Original tables, paper or methods.
- S06 · YouGov US. For Americans with siblings, rivalries often are present in childhood but many fade in adulthood. Published: 2023-02-10. Actual period: 2023-02-03 to 2023-02-05. Sample: 1,000 overall; exact valid subgroup bases in original cross-tabs, not inferred from overall N. Method: Opt-in online panel with sample matching to ACS and demographic/political weights. Original PDF overall margin ±3.3%; article rounds this to approximately 3%.. Limits: Questions use present-tense siblings; deceased siblings may be omitted. Childhood and adult rivalry are separate marginal reports; a 17-point gap is not a measured resolution rate. Supporting original material: Original tables, paper or methods.
- S07 · Melbourne Institute / HILDA research team. Families, Incomes and Jobs, Volume 6: A Statistical Report on Waves 1 to 8; chapter 32. Published: 2011. Actual period: HILDA Wave 8, 2008. Sample: Exact chapter-specific tie and person counts not printed beside descriptive tables; national household panel, ages 15+ interview population. Method: Weighted HILDA household-panel analysis. Chapter 32 treats each non-resident sibling as an observation; living-elsewhere eligibility. Rare cells marked * unreliable are excluded here.. Limits: Historical 2008 estimates, not current rates. Sibling ties and people have different denominators; one respondent may contribute several ties. Descriptive differences are unadjusted; co-residence/age and family context can confound them. Supporting original material: Original tables, paper or methods.
- S08 · CREATE Foundation South Australia. Sibling Connection in SA. Published: 2023-03. Actual period: Exact interview dates not reported in checked methods; report March 2023; contact questions reference previous year. Sample: 26 participants overall; contact-happiness item n=25; other bases labeled. Method: Small opt-in mixed-method consultation; online/phone/in-person assisted and unassisted responses; thematic comments can exceed participant count. Limits: Not representative of all Australian youth or all children in care. Counts and denominators matter. No inference that separation is always harmful or contact is always appropriate.
- S09 · Stocker, Gilligan, Klopack, Conger, Lanthier, Neppl, O’Neal and Wickrama. Sibling Relationships in Older Adulthood: Links with Loneliness and Well-being. Published: Online 2019-08-15; journal issue 2020, 34(2):175–185. Actual period: 2015. Sample: 608 respondents; mean age 64.6; 329 men and 279 women; includes couples from the same households. Method: Home interviews/questionnaires in a longitudinal family cohort; current report uses cross-sectional self-report associations. ASRQ-VSF and zero-order correlations checked in author manuscript via documented public NCBI BioC text/tables.. Limits: Not a nationally representative older-adult sample. Warmth/conflict are 1–5 means; favoritism discrepancy 0–2. Correlation is not causation. Some source contact-score and sample/df descriptions need reconciliation and are withheld. Supporting original material: Original tables, paper or methods, Original tables, paper or methods.
- S10 · Statistics Canada. How many children in Canada have experienced the separation or divorce of their parents? Results from the 2019 Canadian Health Survey on Children and Youth. Published: 2022-03-23. Actual period: 2019 Canadian Health Survey on Children and Youth. Sample: Exact valid sibling-item sample size not supplied in the original infographic; do not use the population estimate as sample N. Method: Original statistical-agency survey analysis/infographic; original question-population labels and data source checked; full survey microdata and variance estimates not reanalyzed. Limits: A sibling elsewhere does not establish loss of contact, estrangement or poor relationship quality. Half-/step-sibling categories can overlap. These are 2019 results, not 2027.
- S11 · Children’s Commissioner for England. Siblings in Care. Published: 2023-01. Actual period: Spring 2016 school census linked to care episodes 1992-03-31 through 2022-03-31; initial placements analyzed. Sample: Approximately 55,000 qualifying children; subgroup sample counts not printed beside every plotted percentage. Method: Original administrative linkage; sibling identifier based on home address/surname; placement similarity inferred from available type, distance, URN, authority and provider data. Limits: Estimates depend on linkage/sibling/placement identification. Initial-placement separation is not current estrangement. Siblings outside state school/care are outside the cohort. Unadjusted group rates do not establish placement-type effects.
Text-retrieval support: NCBI BioC documentation. Underlying original manuscript DOI: 10.1037/fam0000586.
How to cite this resource
Consult and cite the original researcher for a survey finding. Credit MyLittleDesire for this synthesis, chart design or a clearly labeled calculation, retaining the underlying study and actual field period. MyLittleDesire did not conduct the source surveys.
MyLittleDesire. Sibling Relationship Statistics 2027: Closeness, Support and Family Ties. 2027 editorial edition. https://mylittledesire.com/sibling-relationship-statistics/. Add your actual access date when required.