Teen friendship can mean having close friends, feeling able to confide in them, spending time together or receiving help when it matters. This resource brings those measures together while keeping their meanings, age groups and study periods visible.
This page contains 60 grouped findings from 10 original-source reports, supported by 136 numeric inputs, 20 descriptive calculations and four charts. A separate intervention review provides context. Reports are not independent-study counts: the two 2025 Pew reports share respondents, the CDC collections overlap, and the WHO and Canadian HBSC reports share some data.
What are the key teen friendship and peer-support findings?
2%
89%
Had no close friends, excluding family.
Had a friend for emotional support, among those with a close friend.
16%
48%
Of boys with close friends lacked a supportive friend; 5% of girls did.
Would feel highly comfortable talking to a friend about mental health.
74%
47%
Felt more connected to their friends’ lives through social media.
Of teen players had made a friend online through a shared video game.
58.5%
93.1%
Always or usually received needed social and emotional support.
Was the parent-reported estimate for needed teen support.
49%
73%
Met CDC’s measure of being able to rely on or open up to friends a lot.
Of cisgender girls in grades 9–10 reported almost-constant online friend contact.
33%
88%
Of young men met the higher peer-communication threshold.
Said time with peers in person helped them feel connected.
Which friendship and support measures are different?
A teen can have friends, spend time with them online and still feel unable to discuss a particular concern. These studies ask different questions, so their percentages should retain their original labels.
| Measure | What it captures | Important limit |
|---|---|---|
| Close-friend count | How many close friends someone reports, often excluding family. | Not a support-quality score. |
| Available emotional-support friend | Whether someone has a friend they could turn to. | Pew’s item excludes teens without close friends. |
| Comfort discussing mental health | How comfortable someone says they would feel. | Does not establish actual disclosure or help received. |
| Social and emotional support received | Whether needed support is received frequently. | CDC’s overall measure is not peer-only support. |
| CDC peer-support indicator | A lot of reliance on friends for a serious problem or openness about worries. | Amount of support, despite the publisher’s frequency-style summary label. |
| HBSC high peer support | WHO’s four-item peer scale, mean at least 5.5 of 7. | Canada’s national chapter uses its published high-support classification; its cutpoint is not specified there. |
| Online contact frequency | How frequently teens communicate online with close friends. | Does not identify the quality or helpfulness of that contact. |
| Peer trust and communication | Separate dimensions of the quality of peer relationships. | Even with the same response scale, the dimensions are not interchangeable. |
For the broader adult research, see our friendship statistics resource. This teen-focused page concentrates on adolescent friendship networks and support measures.
How many close friends do teens have?
Most U.S. teens in Pew’s 2024 survey had several close friends. Having friends and having someone for emotional support were separate questions; the latter excluded teens without a close friend.
| ID | Finding and qualification | Population, actual period and base | Original source and locator |
|---|---|---|---|
| F01 | Pew’s 2024 survey, published in 2025, found 2% of teens had no close friends, 6% had one, 18% two, 24% three, 16% four and 34% five or more. Definition: Close friends exclude family members; five-plus is the article’s combined category. Qualification: One grouped distribution, not six independent studies; rounded figures. | Ages 13–17 living with parents; friendship-support items conditional on having a close friend United States 2024-09-18 to 2024-10-10 Overall report n=1,391. Published input bases: 1,391. Overall report size is not the valid base for every item. | Pew Research Center Published 2025-03-13 Topline physical p.3 MANYFRI; article Number and gender of friends. Study methods and limitations |
| F02 | Among teens with a close friend, 49% had only same-gender close friends, 48% had a mixed-gender circle and 2% had no same-gender close friends. Definition: Conditional on at least one close friend. Qualification: These categories can total 99% because of rounding and nonresponse. | Ages 13–17 living with parents; friendship-support items conditional on having a close friend United States 2024-09-18 to 2024-10-10 Overall report n=1,391. Published input bases: 1,358. Overall report size is not the valid base for every item. | Pew Research Center Published 2025-03-13 Topline physical p.4 GENFRI1/2/3_COMBO. Study methods and limitations |
| F03 | Among teens with at least one close friend, 89% said they had a friend for emotional support; 11% did not. Definition: Available emotional-support friend; not how often support is received. Qualification: The base excludes teens without close friends. | Ages 13–17 living with parents; friendship-support items conditional on having a close friend United States 2024-09-18 to 2024-10-10 Overall report n=1,391. Published input bases: 1,358. Overall report size is not the valid base for every item. | Pew Research Center Published 2025-03-13 Topline physical p.4 TEENFRI1/TEENFRI2_COMBO. Study methods and limitations |
| F04 | Among teens with close friends, 16% of boys and 5% of girls said they lacked a friend they could turn to for emotional support. Definition: Absence of a supportive friend among those with close friends. Qualification: The contradictory boys’ affirmative figure (84% vs 85%) is withheld; subgroup item counts unavailable. | Ages 13–17 living with parents; friendship-support items conditional on having a close friend United States 2024-09-18 to 2024-10-10 Overall report n=1,391. Item/subgroup bases are not provided alongside these estimates. Overall report size is not the valid base for every item. | Pew Research Center Published 2025-03-13 Topline physical p.4 combined No row; article Emotional support networks. Study methods and limitations |
How comfortable are teens talking to friends, and what happens online?
In the same 2024 U.S. survey, 48% said they would feel very or extremely comfortable discussing their mental health with a friend. Social-media experiences included both connection and exclusion; the measures below describe different experiences and can overlap.
| ID | Finding and qualification | Population, actual period and base | Original source and locator |
|---|---|---|---|
| F05 | Teens reporting high comfort discussing mental health included 52% for a parent, 48% for a friend, 31% for a therapist, 26% for another family member and 12% for a teacher. Definition: Extremely or very comfortable; hypothetical comfort, not actual disclosure. Qualification: All teens; people could feel comfortable with more than one category. | Ages 13–17 living with parents United States 2024-09-18 to 2024-10-10; selected comparison with 2022 survey Overall report n=1,391. Published input bases: 1,391. Overall report size is not the valid base for every item. | Pew Research Center Published 2025-04-22 Article Teens’ comfort level discussing their mental health; topline TTALKMH. Study methods and limitations |
| F06 | Girls were more likely than boys to feel highly comfortable discussing mental health with a friend: 58% versus 38%. Definition: Extremely or very comfortable talking to a friend. Qualification: Not the conditional friend-availability measure in S01. | Ages 13–17 living with parents United States 2024-09-18 to 2024-10-10; selected comparison with 2022 survey Overall report n=1,391. Published input bases: 669, 698. Overall report size is not the valid base for every item. | Pew Research Center Published 2025-04-22 Article Teens’ comfort level discussing their mental health, gender comparison. Study methods and limitations |
| F07 | Social media were described as helping friendships by 30% of teens, hurting them by 7%, and having neither effect by 43%. Definition: Self-perceived impact on friendships. Qualification: All-teen base includes nonusers; the displayed categories are not an exhaustive distribution. | Ages 13–17 living with parents United States 2024-09-18 to 2024-10-10; selected comparison with 2022 survey Overall report n=1,391. Item/subgroup bases are not provided alongside these estimates. Overall report size is not the valid base for every item. | Pew Research Center Published 2025-04-22 Article Social media’s impact on well-being; topline SMEFFECT friendships item. Study methods and limitations |
| F08 | 74% of teens said social media made them feel more connected to events in their friends’ lives. Definition: Feeling more connected to friends’ lives. Qualification: Connection is not equivalent to receiving adequate emotional support. | Ages 13–17 living with parents United States 2024-09-18 to 2024-10-10; selected comparison with 2022 survey Overall report n=1,391. Item/subgroup bases are not provided alongside these estimates. Overall report size is not the valid base for every item. | Pew Research Center Published 2025-04-22 Article The positives and negatives of social media; topline SOC2POS. Study methods and limitations |
| F09 | 52% said social media made them feel they had support through tough times in 2024, compared with 67% in Pew’s 2022 survey. Definition: Publisher-reported comparison of two cross-sectional surveys. Qualification: Different respondents and periods; no individual decline or causal platform effect established. | Ages 13–17 living with parents United States 2024-09-18 to 2024-10-10; selected comparison with 2022 survey Overall report n=1,391. Item/subgroup bases are not provided alongside these estimates. Overall report size is not the valid base for every item. | Pew Research Center Published 2025-04-22 Article Fewer teens now credit social media as a support system; topline SOC2POS support item. Study methods and limitations |
| F10 | 31% reported feeling excluded by friends on social media; the figures were 36% for girls and 26% for boys. Definition: Perceived exclusion arising from social-media content. Qualification: Not a clinical diagnosis or a general rate of bullying. | Ages 13–17 living with parents United States 2024-09-18 to 2024-10-10; selected comparison with 2022 survey Overall report n=1,391. Item/subgroup bases are not provided alongside these estimates. Overall report size is not the valid base for every item. | Pew Research Center Published 2025-04-22 Article The positives and negatives of social media; gender comparison. Study methods and limitations |
| F11 | 39% felt overwhelmed by social-media drama, including 45% of girls and 34% of boys. Definition: Perceived drama-related overwhelm. Qualification: Can coexist with supportive online experiences. | Ages 13–17 living with parents United States 2024-09-18 to 2024-10-10; selected comparison with 2022 survey Overall report n=1,391. Item/subgroup bases are not provided alongside these estimates. Overall report size is not the valid base for every item. | Pew Research Center Published 2025-04-22 Article The positives and negatives of social media; gender comparison. Study methods and limitations |
| F12 | Social media made 57% of girls and 45% of boys feel they had support through difficult times. Definition: Same support item as the 2024 overall estimate. Qualification: Perceived support from social media is not exclusively from friends. | Ages 13–17 living with parents United States 2024-09-18 to 2024-10-10; selected comparison with 2022 survey Overall report n=1,391. Item/subgroup bases are not provided alongside these estimates. Overall report size is not the valid base for every item. | Pew Research Center Published 2025-04-22 Article The positives and negatives of social media; gender comparison. Study methods and limitations |
How do video games fit into teen friendships?
Among video-game players, 47% had made a friend online through a shared game. Pew reported the all-teen equivalent as 40%. Keep the player denominator when discussing the other player-only findings.
| ID | Finding and qualification | Population, actual period and base | Original source and locator |
|---|---|---|---|
| F13 | 89% of teen video-game players said they played with other people, in person or online. Definition: Ever plays games with others; player base n=1,245. Qualification: Co-play is not necessarily friendship or emotional support. | Ages 13–17 living with parents; most findings among 1,245 teen video-game players United States 2023-09-26 to 2023-10-23 Overall report n=1,453. Published input bases: 1,245. Overall report size is not the valid base for every item. | Pew Research Center Published 2024-05-09 Topline physical p.3 VGOTHERS. Study methods and limitations |
| F14 | 47% of teen players had made a friend online through a shared video game; Pew reported the equivalent as 40% of all teens. Definition: Ever made a friend online because of a shared game. Qualification: Two denominators for the same behavior; never present the two rates as different phenomena. | Ages 13–17 living with parents; most findings among 1,245 teen video-game players United States 2023-09-26 to 2023-10-23 Overall report n=1,453. Published input bases: 1,245, 1,453. Overall report size is not the valid base for every item. | Pew Research Center Published 2024-05-09 Topline physical p.3 VGFRIEND; article Video games as a way to spend time with others. Study methods and limitations |
| F15 | 55% of boys who played video games and 35% of girls who played said gaming had helped their friendships. Definition: Perceived help to friendships among players of each gender. Qualification: Not a causal comparison of gaming with not gaming. | Ages 13–17 living with parents; most findings among 1,245 teen video-game players United States 2023-09-26 to 2023-10-23 Overall report n=1,453. Item/subgroup bases are not provided alongside these estimates. Overall report size is not the valid base for every item. | Pew Research Center Published 2024-05-09 Article Video games and their impact on teens; gender comparison. Study methods and limitations |
| F16 | 41% of teen players said gaming had helped how well they worked with other people. Definition: Self-reported help with working with others. Qualification: Not an objectively tested collaboration skill. | Ages 13–17 living with parents; most findings among 1,245 teen video-game players United States 2023-09-26 to 2023-10-23 Overall report n=1,453. Published input bases: 1,245. Overall report size is not the valid base for every item. | Pew Research Center Published 2024-05-09 Topline physical p.4 VGEFFECT item d; 10% a lot and 31% a little. Study methods and limitations |
| F17 | Spending time with others was a major reason to play for 32% of teen players and a minor reason for another 40%. Definition: Reasons for playing video games. Qualification: Motivation does not show friendship quality or frequency. | Ages 13–17 living with parents; most findings among 1,245 teen video-game players United States 2023-09-26 to 2023-10-23 Overall report n=1,453. Published input bases: 1,245. Overall report size is not the valid base for every item. | Pew Research Center Published 2024-05-09 Topline physical p.3 VGREA item b. Study methods and limitations |
How much support do teens feel they receive, and do parents see it differently?
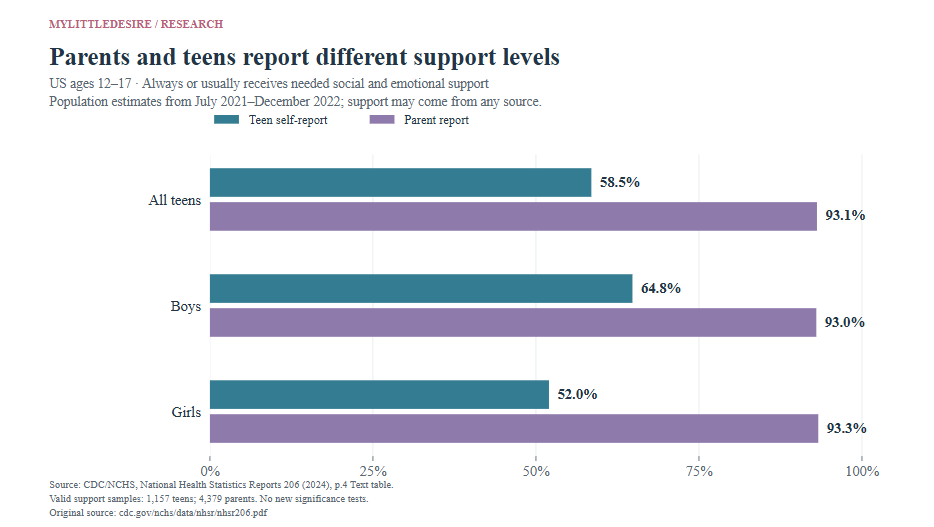
CDC’s July 2021–December 2022 study found 58.5% of teens always or usually received needed social and emotional support. Parents’ estimate was 93.1%. These are separately weighted population estimates with different eligible sample sizes, so their difference is not a count of individual parent–child disagreements.
| ID | Finding and qualification | Population, actual period and base | Original source and locator |
|---|---|---|---|
| F18 | 58.5% of U.S. teens said they always or usually received needed social and emotional support: 27.5% always and 31.0% usually. Definition: Support from any source, ages 12–17. Qualification: Do not relabel this as peer-only support. Published uncertainty: Teens: always/usually supported: SE 1.76. | Ages 12–17 in the civilian noninstitutionalized population United States 2021-07 to 2022-12 Overall report n=1,176. Published input bases: 1,157. Overall report size is not the valid base for every item. | CDC / National Center for Health Statistics Published 2024-07-16 Physical p.3 Results; physical p.4 Text table overall. Study methods and limitations |
| F19 | Parents reported adequate support more often: 93.1% overall, 93.0% for boys and 93.3% for girls. Definition: Parent report that teen always or usually receives needed support. Qualification: Parent estimates use a larger eligible NHIS sample, not only paired teen respondents. Published uncertainty: Parents: always/usually supported: SE 0.45; Parents of boys: SE 0.64; Parents of girls: SE 0.62. | Ages 12–17 in the civilian noninstitutionalized population United States 2021-07 to 2022-12 Overall report n=1,176. Published input bases: 4,379. Overall report size is not the valid base for every item. | CDC / National Center for Health Statistics Published 2024-07-16 Physical p.4 Text table, Total and Sex rows. Study methods and limitations |
| F20 | 64.8% of boys and 52.0% of girls reported always or usually receiving needed support. Definition: Teen self-report, support from any source. Qualification: This construct differs from comfort talking to a friend. Published uncertainty: Boys: always/usually supported: SE 2.49; Girls: always/usually supported: SE 2.59. | Ages 12–17 in the civilian noninstitutionalized population United States 2021-07 to 2022-12 Overall report n=1,176. Item/subgroup bases are not provided alongside these estimates. Overall report size is not the valid base for every item. | CDC / National Center for Health Statistics Published 2024-07-16 Physical p.3 Figure 1 discussion; physical p.4 Text table. Study methods and limitations |
| F21 | The support estimate was 61.0% for ages 12–14 and 56.0% for ages 15–17; the report did not find this age difference statistically significant. Definition: Teen self-report of always/usually receiving support. Qualification: Observed age-group difference is not an established decline as children age. Published uncertainty: Ages 12–14: support: SE 2.64; Ages 15–17: support: SE 2.57. | Ages 12–17 in the civilian noninstitutionalized population United States 2021-07 to 2022-12 Overall report n=1,176. Item/subgroup bases are not provided alongside these estimates. Overall report size is not the valid base for every item. | CDC / National Center for Health Statistics Published 2024-07-16 Physical p.3 Figure 1 discussion; physical p.4 Text table. Study methods and limitations |
| F22 | Reported support was 66.3% among non-Hispanic White teens, 60.8% among non-Hispanic Asian teens, 49.6% among Hispanic teens and 42.3% among non-Hispanic Black teens. Definition: Always or usually receives needed support. Qualification: Unadjusted group estimates; do not infer inherent group characteristics or make all-pairs significance claims. Published uncertainty: Non-Hispanic White teens: SE 2.27; Non-Hispanic Asian teens: SE 5.74; Hispanic teens: SE 3.86; Non-Hispanic Black teens: SE 5.97. | Ages 12–17 in the civilian noninstitutionalized population United States 2021-07 to 2022-12 Overall report n=1,176. Item/subgroup bases are not provided alongside these estimates. Overall report size is not the valid base for every item. | CDC / National Center for Health Statistics Published 2024-07-16 Physical p.3 Figure 1 discussion; physical p.4 Text table. |
| F23 | 43.9% of sexual or gender minority teens reported adequate support, compared with 63.5% of teens outside that combined category. Definition: Sexual or gender minority combines the report’s identity classifications. Qualification: The combined category does not describe every subgroup’s experience. Published uncertainty: Sexual or gender minority teens: SE 3.43; Teens outside combined minority category: SE 2.15. | Ages 12–17 in the civilian noninstitutionalized population United States 2021-07 to 2022-12 Overall report n=1,176. Item/subgroup bases are not provided alongside these estimates. Overall report size is not the valid base for every item. | CDC / National Center for Health Statistics Published 2024-07-16 Physical p.3 Figure 1 discussion; physical p.4 Text table; Technical Notes. |
| F24 | Support estimates were 49.8% below 200% of the federal poverty level, 63.0% at 200% to under 400%, and 63.5% at 400% or higher. Definition: Family income relative to the federal poverty level, not dollar-income bands. Qualification: Observational association, not an effect of changing household income. Published uncertainty: Below 200% FPL: SE 3.61; 200% to under 400% FPL: SE 3.22; 400% FPL or higher: SE 2.64. | Ages 12–17 in the civilian noninstitutionalized population United States 2021-07 to 2022-12 Overall report n=1,176. Item/subgroup bases are not provided alongside these estimates. Overall report size is not the valid base for every item. | CDC / National Center for Health Statistics Published 2024-07-16 Physical p.4 Figure 2 discussion and Text table. |
| F25 | Anxiety symptoms were reported by 12.9% of teens with frequent support versus 33.1% with less frequent support; depression symptoms were 8.0% versus 31.1%. Definition: Frequent support = always/usually; lower support = sometimes/rarely/never. GAD-2 and PHQ-2 symptom screens, not diagnoses. Qualification: Cross-sectional associations cannot establish which factor caused the other. | Ages 12–17 in the civilian noninstitutionalized population United States 2021-07 to 2022-12 Overall report n=1,176. Item/subgroup bases are not provided alongside these estimates. Overall report size is not the valid base for every item. | CDC / National Center for Health Statistics Published 2024-07-16 Physical p.4 Health and well-being outcomes; Figure 4 physical p.5. |
| F26 | Poor sleep quality was reported by 36.9% of teens with frequent support and 67.1% of teens with less frequent support. Definition: Report-defined poor sleep quality, not a clinical sleep-disorder diagnosis. Qualification: Association does not show that peer support would produce this sleep difference. | Ages 12–17 in the civilian noninstitutionalized population United States 2021-07 to 2022-12 Overall report n=1,176. Item/subgroup bases are not provided alongside these estimates. Overall report size is not the valid base for every item. | CDC / National Center for Health Statistics Published 2024-07-16 Physical p.4 Health and well-being outcomes; Figure 4 physical p.5. |
What do friends, parents and other adults contribute to support networks?
CDC’s completed 2021–2023 collection distinguishes support from friends, support from parents and a positive adult connection outside the home. Its peer and parent indicators refer to being able to rely on or open up to someone “a lot,” rather than the frequency of support received.
| ID | Finding and qualification | Population, actual period and base | Original source and locator |
|---|---|---|---|
| F27 | 49% met CDC’s peer-support indicator: reporting that they could rely on friends or open up to friends a lot. Definition: An answer of A lot to either FRIENDSHELP or FRIENDSOPEN. This measures the amount of support, despite the summary’s frequency-style label. Qualification: Rounded publisher summary; valid item base unavailable; not directly comparable to Pew friend availability. | Ages 12–17 United States 2021-07 to 2023-12 Item/subgroup bases are not provided alongside these estimates. Overall report size is not the valid base for every item. | CDC Published 2026-08-20 Childhood experiences section; NHIS–Teen questionnaire physical p.11; query-tool Peer support measure note. |
| F28 | 66% met the corresponding parent-support indicator: a lot of reliance on parents or guardians, or openness with them. Definition: An answer of A lot to either PARENTSHELP or PARENTSOPEN. Qualification: Context for complementary support sources; parent support is not peer support. | Ages 12–17 United States 2021-07 to 2023-12 Item/subgroup bases are not provided alongside these estimates. Overall report size is not the valid base for every item. | CDC Published 2026-08-20 Childhood experiences section; query-tool Parent support measure note. |
| F29 | 79% reported a positive adult connection outside the parents and adults living in their home. Definition: At least one adult in school, neighbourhood or community who makes a positive and meaningful difference; parents and household adults excluded. Qualification: Different question and threshold from peer support; no individual overlap estimated. | Ages 12–17 United States 2021-07 to 2023-12 Item/subgroup bases are not provided alongside these estimates. Overall report size is not the valid base for every item. | CDC Published 2026-08-20 Childhood experiences section; NHIS–Teen questionnaire COMSUPPORT physical p.11. |
These support sources can coexist. Their percentages should not be added to estimate a total supported population. The survey’s community-adult question specifically excludes parents and adults who live in the teen’s home.
How do Canada, England, Scotland and Wales compare at age 15?
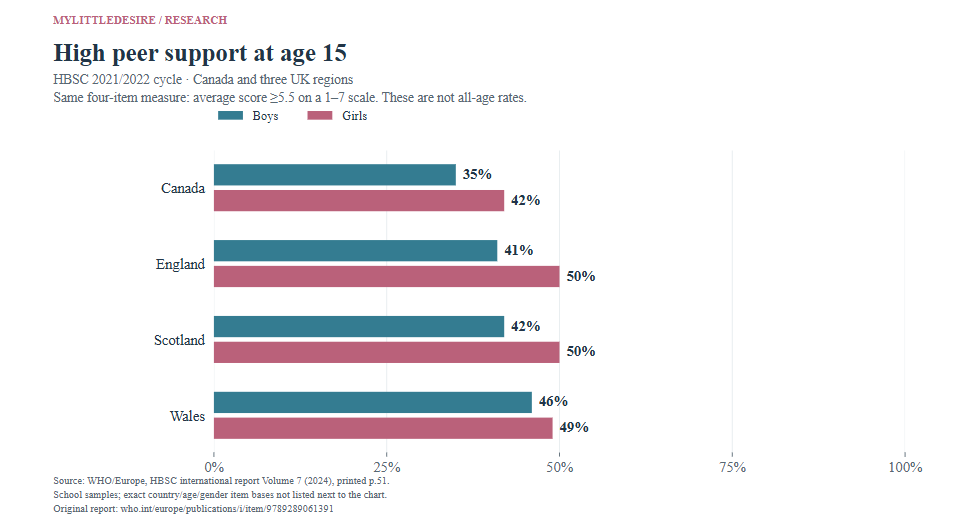
The WHO/HBSC report uses the same four-item high-peer-support measure for these four places. Restricting the comparison to 15-year-olds avoids combining different age groups. England, Scotland and Wales remain separate; no UK-wide estimate is calculated.
| ID | Finding and qualification | Population, actual period and base | Original source and locator |
|---|---|---|---|
| F30 | Across the HBSC study’s participating countries and regions, 58% reported high peer support: 55% of boys and 62% of girls. Definition: Ages 11, 13 and 15; peer scale mean ≥5.5 of 7. Qualification: HBSC averages, not worldwide or US prevalence. | School pupils aged 11, 13 and 15; country comparison restricted to age 15 44 countries and regions in Europe, central Asia and Canada 2021/2022 survey cycle; country fieldwork varies and includes extended collection Overall report n=279,117. Item/subgroup bases are not provided alongside these estimates. Overall report size is not the valid base for every item. | WHO Regional Office for Europe / HBSC Published 2024-11-13 PDF physical p.17, printed p.8 Peer support. |
| F31 | 21% did not report high support from either family or peers in the HBSC analysis. Definition: Neither source reaches the report’s high-support classification. Qualification: Does not mean no support whatsoever. Do not generalize beyond participating school populations. | School pupils aged 11, 13 and 15; country comparison restricted to age 15 44 countries and regions in Europe, central Asia and Canada 2021/2022 survey cycle; country fieldwork varies and includes extended collection Overall report n=279,117. Item/subgroup bases are not provided alongside these estimates. Overall report size is not the valid base for every item. | WHO Regional Office for Europe / HBSC Published 2024-11-13 PDF physical p.8 Key findings; family/peer cross-cutting analysis. |
| F32 | At age 15 in Canada, 35% of boys and 42% of girls reported high peer support. Definition: Same four-item peer scale, average ≥5.5 of 7, same HBSC survey cycle. Qualification: Rounded chart estimates; no new significance test. UK regions are separate. Country/age/gender item bases not supplied next to chart. | School pupils aged 11, 13 and 15; country comparison restricted to age 15 44 countries and regions in Europe, central Asia and Canada 2021/2022 survey cycle; country fieldwork varies and includes extended collection Overall report n=279,117. Item/subgroup bases are not provided alongside these estimates. Overall report size is not the valid base for every item. | WHO Regional Office for Europe / HBSC Published 2024-11-13 PDF physical p.60, printed p.51: age-15 peer-support chart, Canada row. |
| F33 | At age 15 in England, 41% of boys and 50% of girls reported high peer support. Definition: Same four-item peer scale, average ≥5.5 of 7, same HBSC survey cycle. Qualification: Rounded chart estimates; no new significance test. UK regions are separate. Country/age/gender item bases not supplied next to chart. | School pupils aged 11, 13 and 15; country comparison restricted to age 15 44 countries and regions in Europe, central Asia and Canada 2021/2022 survey cycle; country fieldwork varies and includes extended collection Overall report n=279,117. Item/subgroup bases are not provided alongside these estimates. Overall report size is not the valid base for every item. | WHO Regional Office for Europe / HBSC Published 2024-11-13 PDF physical p.60, printed p.51: age-15 peer-support chart, England row. |
| F34 | At age 15 in Scotland, 42% of boys and 50% of girls reported high peer support. Definition: Same four-item peer scale, average ≥5.5 of 7, same HBSC survey cycle. Qualification: Rounded chart estimates; no new significance test. UK regions are separate. Country/age/gender item bases not supplied next to chart. | School pupils aged 11, 13 and 15; country comparison restricted to age 15 44 countries and regions in Europe, central Asia and Canada 2021/2022 survey cycle; country fieldwork varies and includes extended collection Overall report n=279,117. Item/subgroup bases are not provided alongside these estimates. Overall report size is not the valid base for every item. | WHO Regional Office for Europe / HBSC Published 2024-11-13 PDF physical p.60, printed p.51: age-15 peer-support chart, Scotland row. |
| F35 | At age 15 in Wales, 46% of boys and 49% of girls reported high peer support. Definition: Same four-item peer scale, average ≥5.5 of 7, same HBSC survey cycle. Qualification: Rounded chart estimates; no new significance test. UK regions are separate. Country/age/gender item bases not supplied next to chart. | School pupils aged 11, 13 and 15; country comparison restricted to age 15 44 countries and regions in Europe, central Asia and Canada 2021/2022 survey cycle; country fieldwork varies and includes extended collection Overall report n=279,117. Item/subgroup bases are not provided alongside these estimates. Overall report size is not the valid base for every item. | WHO Regional Office for Europe / HBSC Published 2024-11-13 PDF physical p.60, printed p.51: age-15 peer-support chart, Wales row. |
| Country or region | Boys | Girls | Girls minus boys |
|---|---|---|---|
| Canada | 35% | 42% | 7 percentage points |
| England | 41% | 50% | 9 percentage points |
| Scotland | 42% | 50% | 8 percentage points |
| Wales | 46% | 49% | 3 percentage points |
Source: WHO Regional Office for Europe / HBSC, original chart printed p.51. MyLittleDesire calculated the differences from the rounded published estimates. The chart does not supply uncertainty for these particular comparisons, so the differences are descriptive.
Does frequent online contact tell us how supportive friendships are?
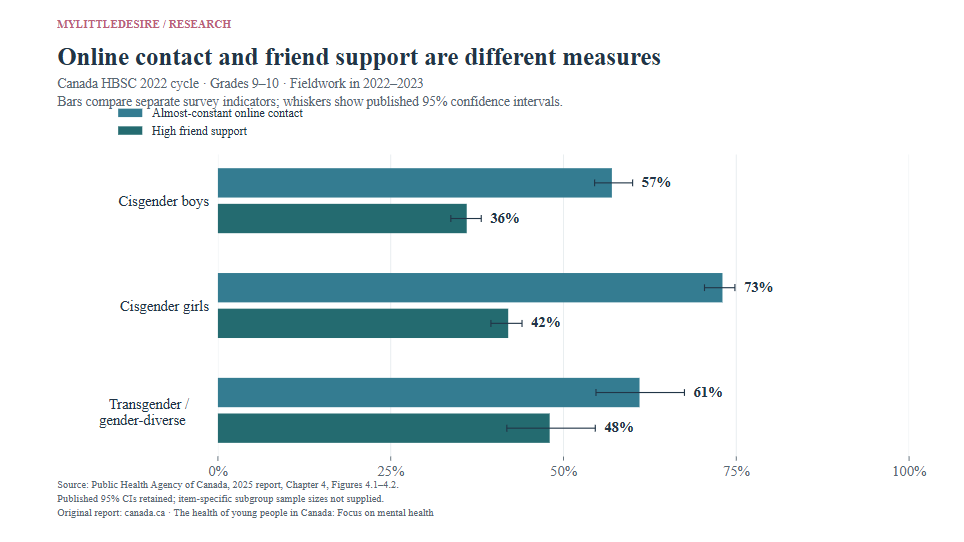
Canadian HBSC findings illustrate why these indicators need separate labels. In grades 9–10, 73% of cisgender girls reported almost-constant online contact with close friends, while 42% met the report’s high-friend-support classification. These separate percentages do not identify the overlap between individual respondents.
| ID | Finding and qualification | Population, actual period and base | Original source and locator |
|---|---|---|---|
| F36 | High friend support, grades 6–8: 37% for cisgender boys, 45% for cisgender girls, 34% for transgender and gender-diverse youth. Definition: Published high-friend-support classification on a four-item composite. Qualification: Published 95% confidence intervals retained. Item-specific counts are not supplied. Grade contrasts are cross-sectional, not within-person changes. Published uncertainty: Cisgender boys: 35.0 to 39.3 (95% confidence interval); Cisgender girls: 42.5 to 46.8 (95% confidence interval); Transgender and gender-diverse youth: 27.5 to 40.3 (95% confidence interval). | School students in grades 6–10 Canada: nine provinces and two territories; New Brunswick and Nunavut absent 2022 cycle; fieldwork in 2022 and 2023 Overall report n=26,360. Item/subgroup bases are not provided alongside these estimates. Overall report size is not the valid base for every item. | Public Health Agency of Canada / Canadian HBSC research team Published 2025-06-23 Chapter 4 Figure 4.1 text-description table. |
| F37 | High friend support, grades 9–10: 36% for cisgender boys, 42% for cisgender girls, 48% for transgender and gender-diverse youth. Definition: Published high-friend-support classification on a four-item composite. Qualification: Published 95% confidence intervals retained. Item-specific counts are not supplied. Grade contrasts are cross-sectional, not within-person changes. Published uncertainty: Cisgender boys: 33.7 to 38.1 (95% confidence interval); Cisgender girls: 39.5 to 44.0 (95% confidence interval); Transgender and gender-diverse youth: 41.8 to 54.6 (95% confidence interval). | School students in grades 6–10 Canada: nine provinces and two territories; New Brunswick and Nunavut absent 2022 cycle; fieldwork in 2022 and 2023 Overall report n=26,360. Item/subgroup bases are not provided alongside these estimates. Overall report size is not the valid base for every item. | Public Health Agency of Canada / Canadian HBSC research team Published 2025-06-23 Chapter 4 Figure 4.1 text-description table. |
| F38 | Almost-constant online contact with close friends, grades 6–8: 42% for cisgender boys, 54% for cisgender girls, 45% for transgender and gender-diverse youth. Definition: Online contact almost all the time throughout the day. Qualification: Published 95% confidence intervals retained. Item-specific counts are not supplied. Grade contrasts are cross-sectional, not within-person changes. Published uncertainty: Cisgender boys: 39.8 to 44.3 (95% confidence interval); Cisgender girls: 51.4 to 56.2 (95% confidence interval); Transgender and gender-diverse youth: 38.4 to 50.9 (95% confidence interval). | School students in grades 6–10 Canada: nine provinces and two territories; New Brunswick and Nunavut absent 2022 cycle; fieldwork in 2022 and 2023 Overall report n=26,360. Item/subgroup bases are not provided alongside these estimates. Overall report size is not the valid base for every item. | Public Health Agency of Canada / Canadian HBSC research team Published 2025-06-23 Chapter 4 Figure 4.2 text-description table. |
| F39 | Almost-constant online contact with close friends, grades 9–10: 57% for cisgender boys, 73% for cisgender girls, 61% for transgender and gender-diverse youth. Definition: Online contact almost all the time throughout the day. Qualification: Published 95% confidence intervals retained. Item-specific counts are not supplied. Grade contrasts are cross-sectional, not within-person changes. Published uncertainty: Cisgender boys: 54.5 to 60.0 (95% confidence interval); Cisgender girls: 70.4 to 74.8 (95% confidence interval); Transgender and gender-diverse youth: 54.7 to 67.5 (95% confidence interval). | School students in grades 6–10 Canada: nine provinces and two territories; New Brunswick and Nunavut absent 2022 cycle; fieldwork in 2022 and 2023 Overall report n=26,360. Item/subgroup bases are not provided alongside these estimates. Overall report size is not the valid base for every item. | Public Health Agency of Canada / Canadian HBSC research team Published 2025-06-23 Chapter 4 Figure 4.2 text-description table. |
| F40 | Easy to discuss troubling things with a best friend, grades 6–8: 76% for cisgender boys, 79% for cisgender girls, 69% for transgender and gender-diverse youth. Definition: Easy or very easy to talk to a best friend about things that bother the respondent. Qualification: Published 95% confidence intervals retained. Item-specific counts are not supplied. Grade contrasts are cross-sectional, not within-person changes. Published uncertainty: Cisgender boys: 73.8 to 77.7 (95% confidence interval); Cisgender girls: 77.5 to 81.3 (95% confidence interval); Transgender and gender-diverse youth: 63.1 to 74.6 (95% confidence interval). | School students in grades 6–10 Canada: nine provinces and two territories; New Brunswick and Nunavut absent 2022 cycle; fieldwork in 2022 and 2023 Overall report n=26,360. Item/subgroup bases are not provided alongside these estimates. Overall report size is not the valid base for every item. | Public Health Agency of Canada / Canadian HBSC research team Published 2025-06-23 Chapter 4 Figure 4.3 text-description table. |
| F41 | Easy to discuss troubling things with a best friend, grades 9–10: 75% for cisgender boys, 81% for cisgender girls, 70% for transgender and gender-diverse youth. Definition: Easy or very easy to talk to a best friend about things that bother the respondent. Qualification: Published 95% confidence intervals retained. Item-specific counts are not supplied. Grade contrasts are cross-sectional, not within-person changes. Published uncertainty: Cisgender boys: 73.0 to 77.2 (95% confidence interval); Cisgender girls: 78.5 to 82.5 (95% confidence interval); Transgender and gender-diverse youth: 63.5 to 76.7 (95% confidence interval). | School students in grades 6–10 Canada: nine provinces and two territories; New Brunswick and Nunavut absent 2022 cycle; fieldwork in 2022 and 2023 Overall report n=26,360. Item/subgroup bases are not provided alongside these estimates. Overall report size is not the valid base for every item. | Public Health Agency of Canada / Canadian HBSC research team Published 2025-06-23 Chapter 4 Figure 4.3 text-description table. |
| F42 | Friend support correlated with life satisfaction (0.20), well-being (0.21), loneliness (−0.20) and health complaints (−0.12). Definition: Published correlation coefficients; not percentages. Qualification: No causal effect, adjusted model or treatment benefit follows from these correlations. | School students in grades 6–10 Canada: nine provinces and two territories; New Brunswick and Nunavut absent 2022 cycle; fieldwork in 2022 and 2023 Overall report n=26,360. Item/subgroup bases are not provided alongside these estimates. Overall report size is not the valid base for every item. | Public Health Agency of Canada / Canadian HBSC research team Published 2025-06-23 Chapter 4 Table 4.5 Overall row. |
For cisgender girls, the online-contact estimate was 19 points higher in grades 9–10 than in grades 6–8, while the high-support estimate was 3 points lower. This contrast concerns separate grade groups and separate constructs; it does not establish that more online contact reduces support. The high-support confidence intervals overlap.
What is the difference between trusting friends and communicating with them?
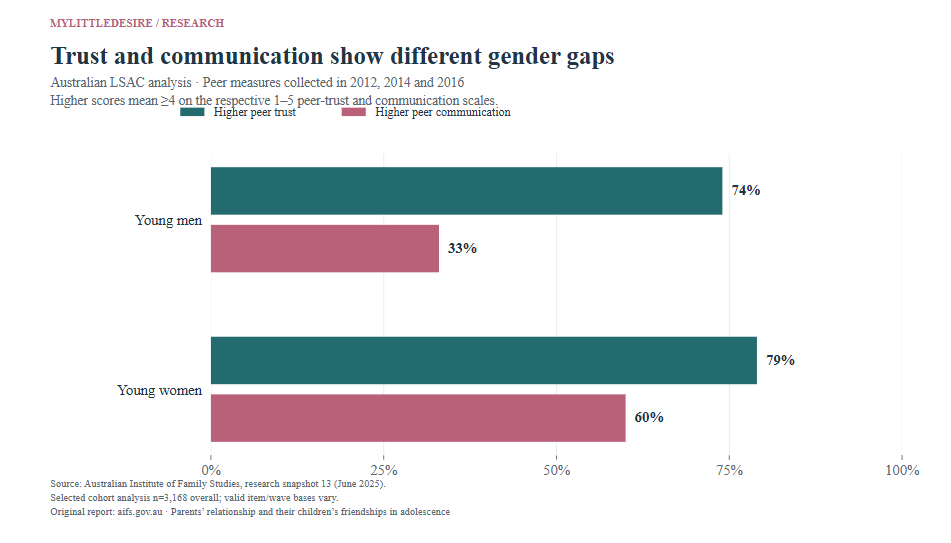
An Australian longitudinal analysis found a 5-percentage-point gender gap in higher peer trust and a 27-point gap in higher peer communication. MyLittleDesire places the two dimensions together for easier reference. The underlying peer measures were collected in 2012–2016; publication in 2025 does not make them new fieldwork.
| ID | Finding and qualification | Population, actual period and base | Original source and locator |
|---|---|---|---|
| F43 | About 9 in 10 had at least one good friend at ages 12–13 and 14–15, compared with about 8 in 10 at ages 16–17 in the LSAC analysis. Definition: Publisher’s approximate proportions, not exact 90.0% and 80.0% estimates. Qualification: Valid samples change across waves; do not interpret as an exact ten-point individual decline. | Selected LSAC K-cohort young people aged 12–13, 14–15 and 16–17 Australia Peer measures in 2012, 2014 and 2016; parental measures in 2004, 2006 and 2008 Overall report n=3,168. Item/subgroup bases are not provided alongside these estimates. Overall report size is not the valid base for every item. | Australian Institute of Family Studies Published 2025-06 Snapshot section Adolescent peer relationships. |
| F44 | Across adolescence in the LSAC analysis, 79% of young women and 74% of young men met the higher peer-trust threshold. Definition: Mean peer-trust score ≥4 on a 1–5 scale. Qualification: Selected cohort analysis using 2012–2016 peer measures, not a 2025 population estimate. | Selected LSAC K-cohort young people aged 12–13, 14–15 and 16–17 Australia Peer measures in 2012, 2014 and 2016; parental measures in 2004, 2006 and 2008 Overall report n=3,168. Item/subgroup bases are not provided alongside these estimates. Overall report size is not the valid base for every item. | Australian Institute of Family Studies Published 2025-06 Snapshot Adolescent peer relationships; trust paragraph. |
| F45 | 60% of young women and 33% of young men met the higher peer-communication threshold. Definition: Mean peer-communication score ≥4 on a 1–5 scale. Qualification: Communication and trust measure different dimensions of friendships. | Selected LSAC K-cohort young people aged 12–13, 14–15 and 16–17 Australia Peer measures in 2012, 2014 and 2016; parental measures in 2004, 2006 and 2008 Overall report n=3,168. Item/subgroup bases are not provided alongside these estimates. Overall report size is not the valid base for every item. | Australian Institute of Family Studies Published 2025-06 Snapshot Adolescent peer relationships; communication paragraph. |
| F46 | Mean peer-trust scores were 4.4 at ages 12–13, 4.3 at 14–15 and 4.1 at 16–17. Definition: Mean on the original 1–5 scale. Qualification: Wave-specific descriptive means; not an individual change estimate. Published uncertainty: Peer trust ages 12–13: SD 0.7; Peer trust ages 14–15: SD 0.7; Peer trust ages 16–17: SD 0.9. | Selected LSAC K-cohort young people aged 12–13, 14–15 and 16–17 Australia Peer measures in 2012, 2014 and 2016; parental measures in 2004, 2006 and 2008 Overall report n=3,168. Published input bases: 2,331, 2,633, 2,944. Overall report size is not the valid base for every item. | Australian Institute of Family Studies Published 2025-06 Supplementary Table S3, physical p.3. |
| F47 | Mean peer-communication scores were 3.9 at ages 12–13, 3.8 at 14–15 and 3.7 at 16–17. Definition: Mean on the original 1–5 scale. Qualification: Wave-specific descriptive means with changing valid counts. Published uncertainty: Peer communication ages 12–13: SD 1.0; Peer communication ages 14–15: SD 0.9; Peer communication ages 16–17: SD 1.0. | Selected LSAC K-cohort young people aged 12–13, 14–15 and 16–17 Australia Peer measures in 2012, 2014 and 2016; parental measures in 2004, 2006 and 2008 Overall report n=3,168. Published input bases: 2,329, 2,631, 2,944. Overall report size is not the valid base for every item. | Australian Institute of Family Studies Published 2025-06 Supplementary Table S3, physical p.3. |
| F48 | Early parental relationship happiness was positively associated with later peer trust: adjusted coefficient 0.063, with a 95% confidence interval of 0.028 to 0.098. Definition: Adjusted linear mixed-model coefficient; parental happiness and peer trust use different scales. Qualification: Not a 6.3% increase, a causal effect or a percentage-point change. Published uncertainty: Parental happiness association with peer trust: 0.028 to 0.098 (95% confidence interval). | Selected LSAC K-cohort young people aged 12–13, 14–15 and 16–17 Australia Peer measures in 2012, 2014 and 2016; parental measures in 2004, 2006 and 2008 Overall report n=3,168. Item/subgroup bases are not provided alongside these estimates. Overall report size is not the valid base for every item. | Australian Institute of Family Studies Published 2025-06 Snapshot relationship happiness results; supplementary Table S4 physical p.4. |
Trust and openness offer different editorial questions. A small trust gap alongside a larger communication gap does not establish that one group has fewer friendships or needs less support. The study does not test those explanations.
Family relationships are a separate source of connection. Our sibling relationship statistics cover that family context in more detail.
How do teens help friends after difficult online experiences?
The following Australian findings come from September 2020, during the pandemic. They describe reported helpful behaviors and information needs in that historical survey, with a weighted nonprobability sample. They should not be quoted as current 2027 prevalence.
| ID | Finding and qualification | Population, actual period and base | Original source and locator |
|---|---|---|---|
| F49 | In the September 2020 Australian survey, 71% said they had supported or listened to a friend after a bad online experience. Definition: Self-reported positive behavior; all 627 teen respondents. Qualification: Historical weighted nonprobability survey; actions can overlap. | Ages 12–17 Australia 2020-09-17 to 2020-09-28; negative experiences in prior six months Overall report n=627. Published input bases: 627. Overall report size is not the valid base for every item. | Australian eSafety Commissioner / Omnipoll Published 2021-02 PDF printed p.18, physical p.19, Table 6 Q8. |
| F50 | In the September 2020 Australian survey, 67% said they had stood up for a friend or someone being bullied or treated nastily online. Definition: Self-reported positive behavior; all 627 teen respondents. Qualification: Historical weighted nonprobability survey; actions can overlap. | Ages 12–17 Australia 2020-09-17 to 2020-09-28; negative experiences in prior six months Overall report n=627. Published input bases: 627. Overall report size is not the valid base for every item. | Australian eSafety Commissioner / Omnipoll Published 2021-02 PDF printed p.18, physical p.19, Table 6 Q8. |
| F51 | In the September 2020 Australian survey, 61% said they had encouraged a friend to report a negative online experience. Definition: Self-reported positive behavior; all 627 teen respondents. Qualification: Historical weighted nonprobability survey; actions can overlap. | Ages 12–17 Australia 2020-09-17 to 2020-09-28; negative experiences in prior six months Overall report n=627. Published input bases: 627. Overall report size is not the valid base for every item. | Australian eSafety Commissioner / Omnipoll Published 2021-02 PDF printed p.18, physical p.19, Table 6 Q8. |
| F52 | 46% wanted access to information about supporting a friend who was in trouble. Definition: Information wanted, not training received or competence measured. Qualification: Historical September 2020 survey, not 2027 demand. | Ages 12–17 Australia 2020-09-17 to 2020-09-28; negative experiences in prior six months Overall report n=627. Published input bases: 627. Overall report size is not the valid base for every item. | Australian eSafety Commissioner / Omnipoll Published 2021-02 PDF printed p.15, physical p.16, Figure 6 and Table 4 Q6. |
| F53 | Among teens with a negative online experience, 43% had spoken to family or friends about it. Definition: Conditional on a negative online experience in the prior six months. Qualification: Family and friends are combined; cannot isolate peer-only help. | Ages 12–17 Australia 2020-09-17 to 2020-09-28; negative experiences in prior six months Overall report n=627. Published input bases: 276. Overall report size is not the valid base for every item. | Australian eSafety Commissioner / Omnipoll Published 2021-02 PDF printed p.13, physical p.14, Figure 4 Q4. |
| F54 | 88% of teens with a negative online experience had supported or listened to a friend after a bad experience, versus 59% of those without a negative experience. Definition: Positive behavior compared by respondents’ own experience group. Qualification: Association does not show that harm causes helpful behavior. | Ages 12–17 Australia 2020-09-17 to 2020-09-28; negative experiences in prior six months Overall report n=627. Published input bases: 276, 351. Overall report size is not the valid base for every item. | Australian eSafety Commissioner / Omnipoll Published 2021-02 PDF printed p.17, physical p.18, Figure 7 Q8. |
What does the 2026 Child Mind Institute study add?
The 2026 study directly asked 1,000 U.S. teens ages 14–17 about connectedness across several parts of their lives. Its in-person peer findings broaden the resource beyond older polls. The publisher describes a representative sample, but the public methods do not disclose enough detail for us to independently assess recruitment and weighting.
| ID | Finding and qualification | Population, actual period and base | Original source and locator |
|---|---|---|---|
| F55 | 88% said spending time with peers in person helped them feel connected in the 2026 Child Mind Institute survey. Definition: Self-reported in-person peer connectedness. Qualification: US ages 14–17; publisher’s representativeness claim not independently established from disclosed methods. | Ages 14–17 United States 2026-01-26 to 2026-03-13 Overall report n=1,000. Item/subgroup bases are not provided alongside these estimates. Overall report size is not the valid base for every item. | Child Mind Institute / Ipsos Published 2026-10-07 PDF physical p.13, printed p.11, finding 9. |
| F56 | More than 85% reported at least one peer they could talk to about important issues. Definition: At least one peer for important conversations. Qualification: The source gives an inequality, not an exact 85% estimate. | Ages 14–17 United States 2026-01-26 to 2026-03-13 Overall report n=1,000. Item/subgroup bases are not provided alongside these estimates. Overall report size is not the valid base for every item. | Child Mind Institute / Ipsos Published 2026-10-07 PDF physical p.13, printed p.11, finding 9. |
| F57 | Mean connectedness scores were 4.33 for family, 4.22 for peers, 4.09 for self, 3.98 for school and 3.77 for digital spaces. Definition: Each domain averages eight items on a 1–5 scale. Qualification: Means are not percentages. Domains have different content; no new significance testing. | Ages 14–17 United States 2026-01-26 to 2026-03-13 Overall report n=1,000. Item/subgroup bases are not provided alongside these estimates. Overall report size is not the valid base for every item. | Child Mind Institute / Ipsos Published 2026-10-07 PDF physical p.10, printed p.8, finding 4. |
| F58 | 80% said being connected was very or extremely important to them. Definition: Importance of connectedness, not measured adequacy of support. Qualification: Not interchangeable with having a close friend. | Ages 14–17 United States 2026-01-26 to 2026-03-13 Overall report n=1,000. Item/subgroup bases are not provided alongside these estimates. Overall report size is not the valid base for every item. | Child Mind Institute / Ipsos Published 2026-10-07 PDF physical p.8, printed p.6, finding 2; report webpage Key Stats. |
| F59 | Among teens classified as having low family connectedness, loneliness was reported for 51% with strong peer connectedness and 78% without it. Definition: Conditional comparison within the low-family-connectedness group. Qualification: Thresholds, subgroup counts, uncertainty and adjustment details are not provided. Descriptive association; not a causal prevention estimate. | Ages 14–17 United States 2026-01-26 to 2026-03-13 Overall report n=1,000. Item/subgroup bases are not provided alongside these estimates. Overall report size is not the valid base for every item. | Child Mind Institute / Ipsos Published 2026-10-07 PDF physical p.12, printed p.10, finding 7. |
| F60 | 29% reported using AI as a source of connection or support. Definition: Any reported AI use for connection/support; not exclusively an AI friend or romantic companion. Qualification: Context only. AI interaction is not counted as human peer support, and no treatment benefit is inferred. | Ages 14–17 United States 2026-01-26 to 2026-03-13 Overall report n=1,000. Item/subgroup bases are not provided alongside these estimates. Overall report size is not the valid base for every item. | Child Mind Institute / Ipsos Published 2026-10-07 Report webpage Key Stats; PDF digital connectedness findings. |
The conditional loneliness comparison is included to explain how sources of connection can be considered together. For prevalence estimates and measurement differences, use the separate loneliness statistics resource. This page does not reproduce a full loneliness-prevalence inventory.
What calculations can publishers trace and reuse?
The calculations below make selected published aggregates easier to compare. MyLittleDesire performed the arithmetic and presentation. Some underlying differences were already discussed by the original researchers; these are not new scientific discoveries, adjusted analyses or original survey results.
| ID | Comparison | Arithmetic | Result | Interpretation limit |
|---|---|---|---|---|
| C01 | Gap in lacking an emotional-support friend: boys minus girls | 16 − 5 | 11.0 percentage points | Descriptive difference of published rounded estimates; no new significance test. |
| C02 | Gap in high comfort discussing mental health with a friend: girls minus boys | 58 − 38 | 20.0 percentage points | Descriptive difference of published rounded estimates; no new significance test. |
| C03 | Social-media friendship response gap: helped minus hurt | 30 − 7 | 23.0 percentage points | Descriptive difference of published rounded estimates; no new significance test. |
| C04 | Change in perceived social-media support: 2024 minus 2022 | 52 − 67 | -15.0 percentage points | Two cross-sectional samples; publisher already discusses the decline. Not an individual change or causal effect. |
| C05 | Gap in perceived gaming friendship benefit: boy players minus girl players | 55 − 35 | 20.0 percentage points | Descriptive difference of published rounded estimates; no new significance test. |
| C06 | Parent–teen population estimate gap, overall | 93.1 − 58.5 | 34.6 percentage points | Separately weighted parent and teen population estimates, with different eligible sample sizes. Not an individual disagreement rate. The original report discusses these reporting differences. |
| C07 | Parent–teen population estimate gap, girls | 93.3 − 52.0 | 41.3 percentage points | Separately weighted parent and teen population estimates, with different eligible sample sizes. Not an individual disagreement rate. The original report discusses these reporting differences. |
| C08 | Parent–teen population estimate gap, boys | 93.0 − 64.8 | 28.2 percentage points | Separately weighted parent and teen population estimates, with different eligible sample sizes. Not an individual disagreement rate. The original report discusses these reporting differences. |
| C09 | Support gap: teens outside combined minority category minus sexual/gender minority teens | 63.5 − 43.9 | 19.6 percentage points | Unadjusted population estimates; not a causal effect of identity or an estimate for every subgroup. |
| C10 | Age-15 high peer-support gap in Canada: girls minus boys | 42 − 35 | 7.0 percentage points | Descriptive difference of published rounded estimates; no new significance test. |
| C11 | Age-15 high peer-support gap in England: girls minus boys | 50 − 41 | 9.0 percentage points | Descriptive difference of published rounded estimates; no new significance test. |
| C12 | Age-15 high peer-support gap in Scotland: girls minus boys | 50 − 42 | 8.0 percentage points | Descriptive difference of published rounded estimates; no new significance test. |
| C13 | Age-15 high peer-support gap in Wales: girls minus boys | 49 − 46 | 3.0 percentage points | Descriptive difference of published rounded estimates; no new significance test. |
| C14 | Canada online-contact grade contrast for cisgender girls: grades 9–10 minus 6–8 | 73 − 54 | 19.0 percentage points | Same survey, different grade groups; not within-person growth. Original researchers already discuss the contrast. |
| C15 | Canada high-friend-support grade contrast for cisgender girls: grades 9–10 minus 6–8 | 42 − 45 | -3.0 percentage points | Descriptive grade-group contrast; source confidence intervals overlap. No new significance claim or within-person decline. |
| C16 | Australia higher peer-trust gap: young women minus young men | 79 − 74 | 5.0 percentage points | Descriptive difference of published rounded estimates; no new significance test. |
| C17 | Australia higher peer-communication gap: young women minus young men | 60 − 33 | 27.0 percentage points | Descriptive difference of published rounded estimates; no new significance test. |
| C18 | Australia helping-a-friend gap by own negative online experience | 88 − 59 | 29.0 percentage points | September 2020 weighted nonprobability survey. Observational difference, not evidence that experiencing harm causes helpful behavior. |
| C19 | Child Mind Institute peer minus digital connectedness mean | 4.22 − 3.77 | 0.45 scale points (1–5) | Different domain item sets on the same response scale. No new inference test or percent conversion. |
| C20 | Child Mind Institute conditional loneliness gap: low family/no strong peers minus low family/strong peers | 78 − 51 | 27.0 percentage points | Conditional descriptive comparison; unknown subgroup sizes/cutpoints and no causal or adjusted-effect claim. |
How was this research assembled and checked?
We reviewed original publications from Pew Research Center, CDC/NCHS, WHO/HBSC, the Public Health Agency of Canada, the Australian Institute of Family Studies, eSafety and the Child Mind Institute. We checked source text, questionnaires, methods and relevant tables where available, including the original WHO age-15 chart and Canadian confidence intervals.
The 60 findings are grouped editorial observations. A distribution, subgroup comparison or set of scale means remains one numbered finding. The underlying database has 136 numeric source inputs. Source reports, publishing organizations, respondents and independent studies are different counts. No pooled global prevalence was estimated.
The main coverage is the US, Canada, Australia and selected UK regions. Ages, grade groups, definitions, survey modes and fieldwork periods differ. School surveys do not represent all out-of-school young people. Some studies include younger adolescents aged 11 or 12 and do not cover ages 18–19. Canada’s 2022 cycle included fieldwork in 2023, while the Australian longitudinal analysis used adolescent data collected in 2012–2016.
Published Canadian 95% confidence intervals, CDC standard errors and selected Australian standard deviations or confidence intervals are retained with their original labels. We did not manufacture missing intervals, combine standard errors, test cross-study differences or infer individual overlaps from separate percentages.
Two unresolved source inconsistencies were excluded: the affirmative support estimate for boys in Pew’s friendship article versus its combined topline, and the CDC “sometimes” support category in two passages. Published combined percentages were not reconstructed by adding independently rounded response categories. Data files distinguish approximate values and inequalities from exact displayed estimates.
The Child Mind Institute report describes its survey as nationally representative, but does not disclose enough recruitment and weighting information for an independent assessment here. Its conditional subgroup comparison also lacks cutpoints, subgroup counts and uncertainty. These limitations remain visible beside the relevant findings.
What this resource contributes: a matched-age international table, a comparison of parent and teen population estimates, a side-by-side view of online contact and support, a trust-versus-communication comparison, source-level caveats and reusable calculations. The fieldwork belongs to the original researchers; MyLittleDesire contributed source selection, verification, arithmetic and presentation.
Does peer support have a proven treatment success rate?
These prevalence and association findings do not establish a universal treatment success rate. An original review of friendship interventions included heterogeneous interventions and participants aged 12–24; short-term friendship-building findings did not establish durable long-term effects. Informal support, structured peer programs and professional treatment require different evidence. A friend should not be assigned responsibility for another teen’s clinical care.
What questions should publishers check before citing?
What percentage of teens have no close friends?
Pew reported 2% among US ages 13–17 in its September–October 2024 survey. The item excludes family members.
How many teens have a friend for emotional support?
89% of teens with at least one close friend said they had someone to turn to in Pew’s 2024 survey. This conditional estimate excludes teens without close friends.
Are friend availability and comfort talking about mental health the same?
They are separate questions. Pew found 48% of all surveyed teens would feel highly comfortable discussing mental health with a friend; the emotional-support availability item used a conditional base.
Can online contact be used as a measure of friendship quality?
The Canadian HBSC report measures contact frequency and friend support separately. The percentages do not reveal which individual respondents belong to both categories.
What does CDC’s 49% peer-support figure mean?
It is the publisher’s rounded estimate for answering a lot to either being able to rely on friends for a serious problem or being able to open up to them about worries.
Do the international figures cover the whole UK?
The selected WHO chart reports England, Scotland and Wales separately at age 15. We do not calculate a UK-wide rate or infer Northern Ireland’s result.
Does the 2026 study show that peers prevent loneliness?
Its 51% and 78% comparison is conditional and cross-sectional, with missing subgroup counts and cutpoints. It is an association, not a measured prevention effect.
What are the complete original sources?
- S01 · The Gender Gap in Teen Experiences: friendships and emotional support networksPew Research Center · Published 2025-03-13 · Data: 2024-09-18 to 2024-10-10. Population: Ages 13–17 living with parents; friendship-support items conditional on having a close friend. Report sample: 1,391.Study methods, limitations and supporting documentsIpsos KnowledgePanel probability-based panel; parent permission and private teen questionnaire; weighted; 1,391 parent–teen dyads. Close-friend item base n=1,358.Same fieldwork as S02. Whole-survey boys n=698 and girls n=669 are not the conditional friendship-item bases. Article says 85% of boys have a supportive friend; combined questionnaire says 84%. That affirmative estimate is withheld; the consistent no-support estimates are retained. Independently rounded categories may not sum to 100%.Supporting document 1 · Supporting document 2
- S02 · Teens, Social Media and Mental HealthPew Research Center · Published 2025-04-22 · Data: 2024-09-18 to 2024-10-10; selected comparison with 2022 survey. Population: Ages 13–17 living with parents. Report sample: 1,391.Study methods, limitations and supporting documentsWeighted Ipsos KnowledgePanel probability-based online survey; full-sample margin of sampling error ±3.3 percentage points.Same respondents as S01, not an independent replication. Perceived effects and stated comfort do not establish causal effects or actual help-seeking. Some questions include nonusers in the all-teen base. 2022 and 2024 are different samples.Supporting document 1 · Supporting document 2
- S03 · Teens and Video Games TodayPew Research Center · Published 2024-05-09 · Data: 2023-09-26 to 2023-10-23. Population: Ages 13–17 living with parents; most findings among 1,245 teen video-game players. Report sample: 1,453.Study methods, limitations and supporting documentsWeighted Ipsos KnowledgePanel probability-based online survey. All-teens sample n=1,453; player base n=1,245.Making a friend online, spending time with others and perceived friendship benefits are distinct. Effects are self-reported, not experimental. Use the publisher’s combined percentages rather than reconstructing them from rounded categories.Supporting document 1
- S04 · Perceived Social and Emotional Support Among Teenagers: United States, July 2021–December 2022CDC / National Center for Health Statistics · Published 2024-07-16 · Data: 2021-07 to 2022-12. Population: Ages 12–17 in the civilian noninstitutionalized population. Report sample: 1,176.Study methods, limitations and supporting documentsNHIS–Teen web follow-back to probability-sampled NHIS. 1,176 teen respondents, 1,157 with support data; NHIS parent sample 4,424, valid support n=4,379. Complex-survey weights.Support can come from any source, not only friends. Parent estimates use the full eligible NHIS sample, not only matched parent–teen pairs; the population gap is not an individual disagreement rate. Cross-sectional health associations are not causal effects. The sometimes category is 21.7% in one passage and 21.6% in another and is withheld.Supporting document 1
- S05 · Data and Statistics on Children’s Mental Health: NHIS–Teen support indicatorsCDC · Published 2026-08-20 · Data: 2021-07 to 2023-12. Population: Ages 12–17. Report sample: Not supplied on the cited summary page.Study methods, limitations and supporting documentsPublisher’s rounded national summary from the completed NHIS–Teen collection. Questionnaire and survey overview also checked.Item-specific analytic bases and uncertainty are not provided on this summary page. No microdata reanalysis or interactive-tool recalculation performed. Overlaps the earlier collection in S04; these are not independent samples or a time trend.Supporting document 1 · Supporting document 2 · Supporting document 3 · Supporting document 4
- S06 · A focus on adolescent social contexts in Europe, central Asia and Canada: 2021/2022 HBSC international report, Volume 7WHO Regional Office for Europe / HBSC · Published 2024-11-13 · Data: 2021/2022 survey cycle; country fieldwork varies and includes extended collection. Population: School pupils aged 11, 13 and 15; country comparison restricted to age 15. Report sample: 279,117.Study methods, limitations and supporting documentsSchool-based cross-sectional HBSC survey. High peer support: average ≥5.5 on four 1–7 peer-support items. Original PDF, methods and the age-15 chart inspected.International averages are HBSC averages, not worldwide teen rates. Country/age/gender item bases are not shown next to the chart. England, Scotland and Wales are separate regions, not a UK estimate. Canada also appears in S07, with different grade and gender groupings. Round-number differences are descriptive, not new significance tests.Supporting document 1
- S07 · The health of young people in Canada: Focus on mental health, Chapter 4: FriendsPublic Health Agency of Canada / Canadian HBSC research team · Published 2025-06-23 · Data: 2022 cycle; fieldwork in 2022 and 2023. Population: School students in grades 6–10. Report sample: 26,360.Study methods, limitations and supporting documents School-based HBSC questionnaire; weighted for enrolment and classroom clustering. Total 317 schools, 26,360 participants; grade/gender table n=25,943. Published 95% confidence intervals retained.Not all provinces/territories or out-of-school youth covered. Item-specific subgroup bases not supplied with figures. TGD means transgender and gender-diverse. High-support classification retained as published; the accessible chapter describes the 4–28 scale but does not specify its dichotomization cutpoint. Online frequency is not support quality. Group correlations are observational.Supporting document 1
- S08 · Parents’ relationship and their children’s friendships in adolescence, Growing Up in Australia research snapshot 13Australian Institute of Family Studies · Published 2025-06 · Data: Peer measures in 2012, 2014 and 2016; parental measures in 2004, 2006 and 2008. Population: Selected LSAC K-cohort young people aged 12–13, 14–15 and 16–17. Report sample: 3,168.Study methods, limitations and supporting documentsLongitudinal Study of Australian Children analysis. IPPA peer trust/communication scales, SDQ peer problems; adjusted associations with early parental relationship measures.A selected longitudinal analysis, not a new 2025 population poll. Valid counts differ by wave/item. Reported percentages across adolescence do not identify a within-person trajectory. The trust and communication thresholds both use mean score ≥4 on their respective 1–5 scales; constructs differ. Associations do not prove causation.Supporting document 1 · Supporting document 2
- S09 · The digital lives of Aussie teens Australian eSafety Commissioner / Omnipoll · Published 2021-02 · Data: 2020-09-17 to 2020-09-28; negative experiences in prior six months. Population: Ages 12–17. Report sample: 627.Study methods, limitations and supporting documents Omnipoll mobile survey using nonprobability Lightspeed consumer panel; age/gender/geographic quotas and weights to 2016 Census. Original PDF verified through public web retrieval.Historical pandemic-period findings, not 2027 prevalence. Selection bias possible. Multiple responses overlap. Negative-experience subgroup n=276, no-negative-experience n=351. Direct local download returned 503; public web PDF text and page images were accessible. Supporting document 1
- S10 · Building Bridges: Teen Loneliness and Connection, 2026 Study Report Child Mind Institute / Ipsos · Published 2026-10-07 · Data: 2026-01-26 to 2026-03-13. Population: Ages 14–17. Report sample: 1,000.Study methods, limitations and supporting documents Online survey in partnership with Ipsos; five eight-item connectedness domains rated 1–5; validated loneliness/anxiety/depression screens. Funded by Morgan Stanley Alliance for Children’s Mental Health. Publisher describes the sample as nationally representative, but public report lacks recruitment, weighting, response-rate and item/subgroup-base detail to independently assess that claim. Cross-sectional, noncausal. Selected high/low connectedness thresholds and subgroup sizes are not given for the conditional loneliness comparison. “Over 85%” retained as an inequality. Supporting document 1 · Supporting document 2
- S11 · Investigating the Role of Friendship Interventions on the Mental Health Outcomes of Adolescents: A Scoping Review of Range and a Systematic Review of Effectiveness Manchanda, Stein and Fazel / International Journal of Environmental Research and Public Health · Published 2023-01-25 · Data: Studies available through the review search; historical intervention evidence. Population: Review eligibility ages 12–24; not a teen-only prevalence sample. Report sample: 12,815.Study methods, limitations and supporting documents Original evidence synthesis: 24 studies in scoping review and 18 in effectiveness review. Full original XML obtained from Europe PMC. Used for interpretation only, not among the 60 prevalence/association findings. Heterogeneous designs, populations and programs; no universal peer-support treatment success rate. Short-term friendship-building results did not establish durable long-term effects. Review participants include young adults. Supporting document 1
How should this page be cited?
MyLittleDesire. Teen Friendship & Peer Support Statistics 2027. https://mylittledesire.com/teen-friendship-statistics/. Include your own access date.
Read and link to the original HTML article
When citing a particular survey, also credit and consult its original research source. MyLittleDesire’s contribution is the synthesis, comparisons and presentation.