A family statistic can count households, family units, individual adults or children. It can include grown children living at home, or classify two siblings differently from a parent and child. This resource brings those definitions alongside the numbers so readers can make useful comparisons without changing what the evidence measures.
What do family structure statistics measure?
Start with the unit, resident relationships, child-dependence rule and actual year. The definitions below explain why similar-looking percentages can answer different questions.
| Term | Definition | Interpretation |
|---|---|---|
| Household | The people sharing an occupied home under the source’s household rules. It can contain no family, one family or more than one family. | Do not substitute a family count for a household count. |
| US CPS family | People related to the householder by birth, marriage or adoption. | Adult siblings can form a family household; cohabiting partners are not a married-couple household. |
| UK family | A couple with or without children, or a parent with qualifying co-resident children. | The ONS “two or more unrelated adults” household category can include siblings. |
| Canadian census family | A couple with or without children, or one parent with a qualifying co-resident child. | Adult children can be included. Siblings alone do not form a census family. |
| Australian family | Related co-residents classified as couple, one-parent or other family under ABS rules. | Two adult brothers can be an other family. |
| Dependent child | A source-specific age/education/relationship classification. | UK: under 16 or qualifying 16–18 in full-time education. Australia: under 15 or qualifying full-time student 15–24. |
| No resident children | No children present in that family unit under the source definition. | Not a measure of lifetime childlessness or childfree identity. |
| One-parent / lone-parent family | A co-resident family category with one parent and qualifying child or children. | Not evidence that another parent has no contact or that every child is young. |
| Co-residence | Living together in the measured household or family arrangement. | Does not directly measure love, support quality, legal custody, happiness or relationship outcomes. |
Worked example: two adult siblings sharing a home
Imagine two adult siblings living together, with no partner, parent or child in the home. Applying the published definitions gives the classifications below. This is a definition-guided illustration, not an analysis of linked census records.
| Country | Classification under the cited rules | Why | Definition source |
|---|---|---|---|
| United States | Family household | The siblings are related to the householder by birth. | CPS family definition |
| United Kingdom | “Two or more unrelated adults” household | The category can include siblings; there is no couple or parent–child family here. | ONS workbook notes, note 10 |
| Canada | Non-census-family household | Siblings alone are not a couple or parent–child census family. | Statistics Canada household explanation |
| Australia | Other family within a family household | AIFS’s ABS-definition appendix explicitly gives two brothers as an example. | AIFS definitions appendix |
Key family structure findings
47%
39%
Of US households were married-couple households.
Of US families had their own children under 18.
33%
28.7%
Of US adults lived with at least two adult generations.
Of UK 20–34-year-olds lived in their parents’ family.
38.9%
16.4%
Of UK lone-parent families had only non-dependent children.
Of Canadian census families were one-parent families.
29.3%
14.5%
Of Canadian households contained one person.
Of people 15+ in Canadian private households lived alone.
21.8%
6,730,187
Of Canadian families with a child 0–5 had common-law parents.
Families were counted in Australia.
519,457
394,202
Australian couple families with children had only non-dependent children.
Australian one-parent families had only non-dependent children.
How has US household and family composition changed?
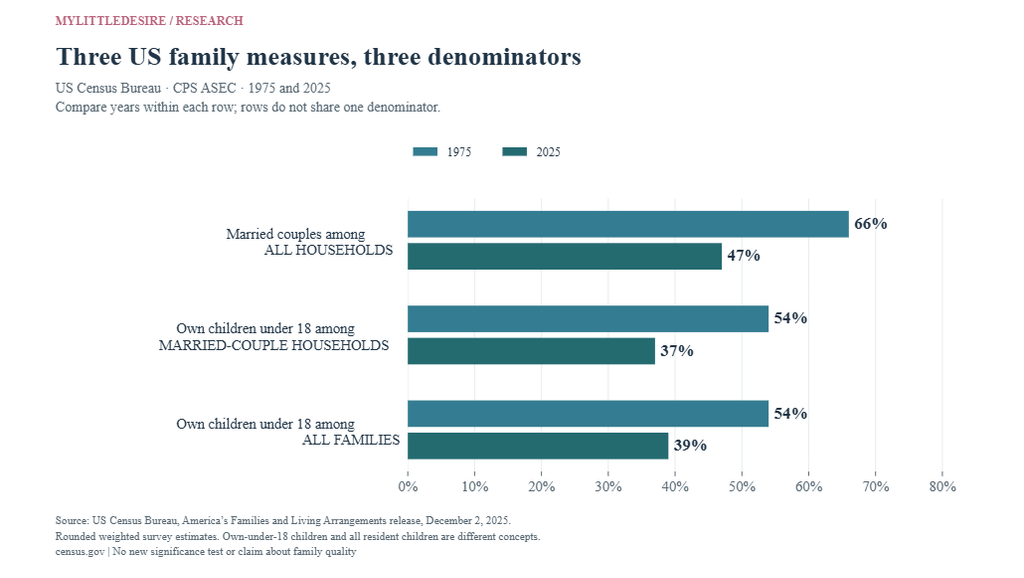
Married-couple households accounted for 47% of US households in 2025. That is a different question from whether a family has children under 18. The chart keeps three denominators separate and compares years only within each measure.
| ID | Finding and qualification | Population, actual period and base | Original source and locator |
|---|---|---|---|
| F01 | Married-couple households accounted for 47% of all US households in 2025, compared with 66% in 1975. Definition: All households are the denominator. Qualification: Not the share of adults married, or the share of families headed by a married couple. | US households under CPS ASEC definitions United States 1975 and 2025 CPS ASEC Selected item/subgroup n is not disclosed beside these figures. An overall report n is not a subgroup base. | US Census Bureau Published 2025-12-02 Opening release paragraph. |
| F02 | Among married-couple households, 37% had their own children under 18 in 2025, down from 54% in 1975. Definition: Conditional on a married-couple household. Qualification: Own under-18 children include never-married biological, step and adopted children under the source definition; not all younger relatives. | US married-couple households United States 1975 and 2025 CPS ASEC Selected item/subgroup n is not disclosed beside these figures. An overall report n is not a subgroup base. | US Census Bureau Published 2025-12-02 Second release paragraph. |
| F03 | The share of families with own children under 18 fell from 54% in 1975 to 39% in 2025. Definition: All CPS families, not only married couples. Qualification: The 39% figure and the 37% married-couple figure have different denominators. | US CPS families/family households United States 1975 and 2025 CPS ASEC Selected item/subgroup n is not disclosed beside these figures. An overall report n is not a subgroup base. | US Census Bureau Published 2025-12-02 Other Highlights, Families bullet. |
| F04 | One-person households numbered 39.7 million in 2025 and represented 29% of households, versus 20% in 1975. Definition: Households containing one person. Qualification: Not 29% of people or adults. The count and share use household units. | US households United States 1975 and 2025 CPS ASEC Selected item/subgroup n is not disclosed beside these figures. An overall report n is not a subgroup base. | US Census Bureau Published 2025-12-02 Other Highlights, Households first bullet. |
| F05 | Householders 65+ rose from about one in five in 1975 to more than one in four in 2025. Definition: Age of the householder, not everyone in the household. Qualification: These are the release’s approximate descriptions; 25% is a lower bound for 2025, not an exact estimate. | US householders United States 1975 and 2025 CPS ASEC Selected item/subgroup n is not disclosed beside these figures. An overall report n is not a subgroup base. | US Census Bureau Published 2025-12-02 Other Highlights, Households second bullet. |
| F06 | 58% of adults 18–24 lived in their parental home in 2025, compared with 16% at ages 25–34. Definition: Within each named adult age group. Qualification: These age bands differ from the UK’s 20–34 and SHED’s under-30 figures; do not create a cross-country ranking. | US adults in the specified age groups United States 2025 CPS ASEC Selected item/subgroup n is not disclosed beside these figures. An overall report n is not a subgroup base. | US Census Bureau Published 2025-12-02 Other Highlights, Living Arrangements bullet. |
What do the US child-family estimates include?
The NCFMR analysis describes children’s co-resident parent arrangements, with two adoptive parents included in its two-biological-parent label. The authors exclude children in same-sex families because of small samples. These estimates must retain that coverage limit.
| ID | Finding and qualification | Population, actual period and base | Original source and locator |
|---|---|---|---|
| F07 | 65% of analyzed children lived with two biological/adoptive parents in 2025, compared with 64% in 2019. Definition: Source category two biological includes two adoptive parents. Qualification: Same-sex-family children excluded by the authors; do not present this as an inclusive national rate for all children. | US children under 18 in the NCFMR analysis; same-sex-family children excluded United States 2019 and 2025 CPS ASEC / IPUMS CPS Selected item/subgroup n is not disclosed beside these figures. An overall report n is not a subgroup base. | Bowling Green State University, National Center for Family & Marriage Research Published 2026 profile; page updated 2026-07-08 Children’s Family Structure, first paragraph and Figure 1 note. |
| F08 | Among analyzed children with two biological/adoptive parents, 94% had married parents and 6% cohabiting parents in 2025. Definition: Conditional on the two-biological/adoptive-parent category. Qualification: Not shares of all analyzed children. Source says this pattern was unchanged from 2019. | US children under 18 in the NCFMR analysis; same-sex-family children excluded; two-biological/adoptive-parent subset United States 2025 Selected item/subgroup n is not disclosed beside these figures. An overall report n is not a subgroup base. | Bowling Green State University, National Center for Family & Marriage Research Published 2026 profile; page updated 2026-07-08 Second paragraph under Children’s Family Structure. |
| F09 | Single-parent families represented 21% of analyzed children in 2025 and 22% in 2019; within the 2025 single-parent group, 86% lived with mothers and 14% fathers. Definition: Overall family-type shares followed by conditional parent-sex shares. Qualification: These are different denominators. A co-resident single parent does not establish absence of contact with the other parent. | US children under 18 in the NCFMR analysis; same-sex-family children excluded United States 2019 and 2025 CPS ASEC / IPUMS CPS Selected item/subgroup n is not disclosed beside these figures. An overall report n is not a subgroup base. | Bowling Green State University, National Center for Family & Marriage Research Published 2026 profile; page updated 2026-07-08 Single-parent paragraphs and Figure 1. |
| F10 | Stepfamilies accounted for 10% of analyzed children in 2025, versus 9% in 2019; among the 2025 stepfamily group, 60% had married parents and 40% cohabiting parents. Definition: Child-level stepfamily measure with a conditional union-status split. Qualification: The married share within stepfamilies was 56% in 2019. These source definitions are distinct from blended-sibling definitions in other research. | US children under 18 in the NCFMR analysis; same-sex-family children excluded United States 2019 and 2025 CPS ASEC / IPUMS CPS Selected item/subgroup n is not disclosed beside these figures. An overall report n is not a subgroup base. | Bowling Green State University, National Center for Family & Marriage Research Published 2026 profile; page updated 2026-07-08 Stepfamily paragraphs and Figure 1. |
| F11 | Two-biological/adoptive-parent living was reported for 86% of the Asian category, 73% of White children and 37% of Black children in the analysis. Definition: Within the source’s race/ethnicity groups. Qualification: Source Asian category includes non-Hispanic Asian or Native Hawaiian/Other Pacific Islander; White/Black are non-Hispanic. No causal explanation or family-quality judgment is inferred. | US children under 18 in the NCFMR analysis; same-sex-family children excluded; within named race/ethnicity groups United States 2025 Selected item/subgroup n is not disclosed beside these figures. An overall report n is not a subgroup base. | Bowling Green State University, National Center for Family & Marriage Research Published 2026 profile; page updated 2026-07-08 Race/Ethnicity section, first paragraph/Figure 2 note. |
Who do US adults live with?
In the Federal Reserve’s 2025 SHED survey, 65% of adults lived with a spouse or partner. Co-resident relationships can overlap: an adult can live with a partner, a child and a parent. The adult-generation measure is also different from a three-generation household count.
| ID | Finding and qualification | Population, actual period and base | Original source and locator |
|---|---|---|---|
| F12 | Adults reported living with a spouse/partner at 65%, minor children at 26%, adult children at 19%, a parent at 15%, siblings at 7%, other relatives at 5% and other non-relatives at 6%. Definition: Adult-weighted multiple-response relationship categories. Qualification: Shares overlap and must not be added as a household-type distribution. | US adults 18+ in SHED United States October 17–28, 2025 Selected item/subgroup n is not disclosed beside these figures. An overall report n is not a subgroup base. | Board of Governors of the Federal Reserve System Published May 2026; exact report publication day not established Table 8, Other people living in the household. |
| F13 | 33% of adults lived with at least two generations of adults; 2% lived with both a parent and an adult child. Definition: Adult-generation co-residence; the 2% group is nested. Qualification: Not the same as every household containing a grandparent and a minor grandchild. | US adults 18+ in SHED United States October 17–28, 2025 Selected item/subgroup n is not disclosed beside these figures. An overall report n is not a subgroup base. | Board of Governors of the Federal Reserve System Published May 2026; exact report publication day not established Opening living-arrangements paragraph. |
| F14 | 49% of adults under 30 lived with a parent in 2025, up 6 percentage points since 2022 and 12 points since 2019. Definition: Source-reported prevalence and percentage-point changes. Qualification: The earlier prevalence values are not back-calculated and relabeled as original observations. | US SHED adults ages 18–29 United States 2025 with 2022/2019 comparisons Selected item/subgroup n is not disclosed beside these figures. An overall report n is not a subgroup base. | Board of Governors of the Federal Reserve System Published May 2026; exact report publication day not established Paragraph after Table 8. |
| F15 | 13% of adults lived alone in 2025; among adults 60+, the figure was 20%. Definition: People are the denominator; older adults are a subset. Qualification: These are not household shares, a loneliness measure or independent comparison samples. | US SHED adults 18+ and the 60+ subset United States October 17–28, 2025 Selected item/subgroup n is not disclosed beside these figures. An overall report n is not a subgroup base. | Board of Governors of the Federal Reserve System Published May 2026; exact report publication day not established Solo-living paragraph after Table 8. |
How common are solo households and living with parents in the UK?
The UK had 29.0 million households in 2025. The young-adult parent-home figures use the ONS family classification: someone who forms their own family by partnering or having a child is excluded, even if still sharing their parents’ home. Ages and definitions must be checked before an international comparison.
| ID | Finding and qualification | Population, actual period and base | Original source and locator |
|---|---|---|---|
| F16 | The UK had 29.0 million households in 2025, compared with 27.0 million in 2015; average household size in 2025 was 2.36. Definition: Weighted household counts and residents per household. Qualification: Rounded headline counts; exact published counts and confidence half-widths are in the source-quality data. | UK households in the LFS population United Kingdom April–June 2015 and 2025 Selected item/subgroup n is not disclosed beside these figures. An overall report n is not a subgroup base. | Office for National Statistics Published 2026-04-17 Bulletin section 2; workbook 7, B27/AF27. |
| F17 | In 2025, 66.8% of UK households contained one family, 29.5% one person, 2.8% two or more unrelated adults and 0.8% two or more families. Definition: All households; ONS household-type categories. Qualification: One-family households can include lodgers or other individuals. The unrelated-adults category can include siblings under ONS rules. Rounded shares total 99.9%. | UK households United Kingdom April–June 2025 Selected item/subgroup n is not disclosed beside these figures. An overall report n is not a subgroup base. | Office for National Statistics Published 2026-04-17 Bulletin section 2/Figure 1. |
| F18 | People 65+ made up 49.6% of solo residents in 2025, compared with 46.9% in 2015. Definition: Age composition among solo residents. Qualification: Not the percentage of all older people who live alone. | UK solo residents United Kingdom April–June 2015 and 2025 Selected item/subgroup n is not disclosed beside these figures. An overall report n is not a subgroup base. | Office for National Statistics Published 2026-04-17 Bulletin section 3/Figure 2. |
| F19 | Among solo residents 65+, 63.9% were female and 36.1% male in 2025. Definition: Sex composition of older solo residents. Qualification: Does not mean 63.9% of older women live alone. | UK solo residents aged 65+ United Kingdom April–June 2025 Selected item/subgroup n is not disclosed beside these figures. An overall report n is not a subgroup base. | Office for National Statistics Published 2026-04-17 Bulletin section 3, final paragraph. |
| F20 | Among 20–34-year-olds, 28.7% lived in a parent’s family in 2025, versus 25.4% in 2015. Definition: Living in the parents’ family under ONS classification. Qualification: Someone who forms their own family by partnering or having a child is excluded even if sharing a home with parents. | UK people 20–34 in households United Kingdom April–June 2015 and 2025 Selected item/subgroup n is not disclosed beside these figures. An overall report n is not a subgroup base. | Office for National Statistics Published 2026-04-17 Bulletin section 4/Figure 3. |
| F21 | In 2025, parent-family residence was 34.9% for males 20–34 and 22.3% for females; the male figure was 30.5% in 2015. Definition: Within-sex percentages for ages 20–34. Qualification: ONS finds the male increase significant and the female increase not significant. A point difference is not a new significance test. | UK males/females 20–34 in households United Kingdom April–June 2015 and 2025 Selected item/subgroup n is not disclosed beside these figures. An overall report n is not a subgroup base. | Office for National Statistics Published 2026-04-17 Bulletin section 4, Figure 3/4 discussion. |
| F22 | Using the broader 15–34 band, 42.4% lived in a parent’s family in 2025, versus 39.7% in 2015; counts were 7.2 million and 6.6 million. Definition: Includes ages 15–19, unlike the 20–34 measure. Qualification: Different age bands cannot be used as comparable country estimates. | UK people 15–34 in households United Kingdom April–June 2015 and 2025 Selected item/subgroup n is not disclosed beside these figures. An overall report n is not a subgroup base. | Office for National Statistics Published 2026-04-17 Bulletin section 4, opening paragraph. |
Do lone-parent families always contain dependent children?
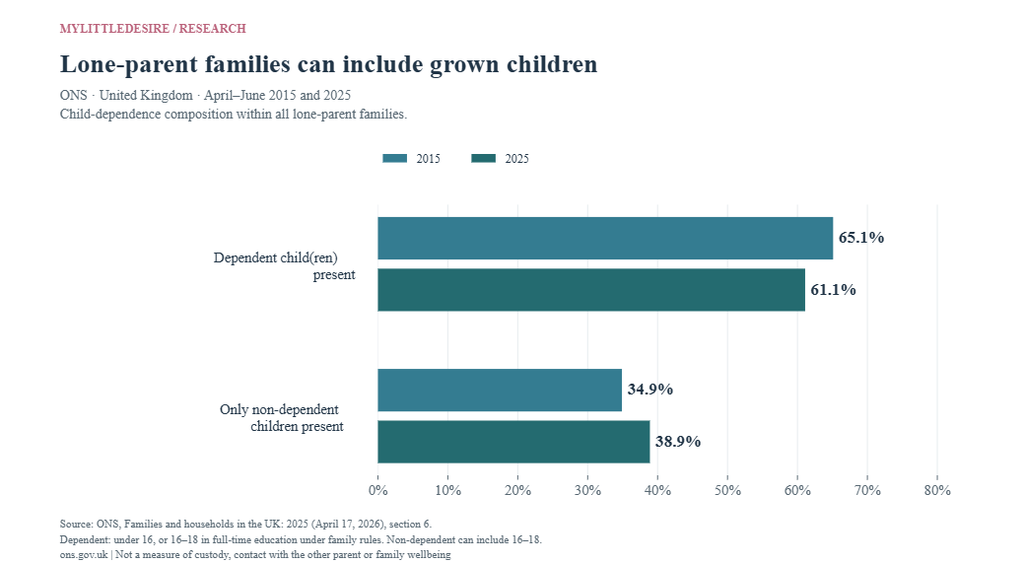
No. In 2025, 38.9% of UK lone-parent families had only non-dependent children. This group can include some 16–18-year-olds as well as older adults. A family’s co-resident structure does not measure custody arrangements or contact with a parent living elsewhere.
| ID | Finding and qualification | Population, actual period and base | Original source and locator |
|---|---|---|---|
| F23 | The UK had an estimated 19.9 million families in 2025, compared with 18.7 million in 2015. Definition: Family units, which can be more numerous than one-family households. Qualification: Families in communal establishments are outside this bulletin’s family population. Original count precision and 95% margins are retained separately. | UK LFS family units United Kingdom April–June 2015 and 2025 Selected item/subgroup n is not disclosed beside these figures. An overall report n is not a subgroup base. | Office for National Statistics Published 2026-04-17 Bulletin section 5; workbook 1, B36/AF36. |
| F24 | Families in 2025 were 65.3% married couples, 17.6% cohabiting couples, 16.0% lone parents and 1.1% civil-partner couples. Definition: All family units, not all households. Qualification: Married/civil-partner categories include opposite- and same-sex couples. The 2015 married share was 66.6%; cohabiting share changes were not statistically significant. | UK LFS family units United Kingdom April–June 2025; labeled 2015 married-share comparator Selected item/subgroup n is not disclosed beside these figures. An overall report n is not a subgroup base. | Office for National Statistics Published 2026-04-17 Bulletin section 5/Figure 5. |
| F25 | 42.8% of families contained dependent children, 15.8% only non-dependent children and 41.4% no resident children in 2025. Definition: Presence and dependence of co-resident children. Qualification: No children does not mean never having children; non-dependent children need not all be over 18. | UK LFS family units United Kingdom April–June 2025 Selected item/subgroup n is not disclosed beside these figures. An overall report n is not a subgroup base. | Office for National Statistics Published 2026-04-17 Bulletin section 5, child-presence paragraph. |
| F26 | Among families with dependent children, 45.0% had one, 41.0% two and 14.1% three or more dependent children. Definition: Conditional on at least one dependent child. Qualification: Not all families. Rounded components total 100.1%. | UK families with dependent children United Kingdom April–June 2025 Selected item/subgroup n is not disclosed beside these figures. An overall report n is not a subgroup base. | Office for National Statistics Published 2026-04-17 Bulletin section 5, final paragraph. |
| F27 | Lone-parent families with only non-dependent children increased from 34.9% in 2015 to 38.9% in 2025; those with dependent children fell from 65.1% to 61.1%. Definition: Child-dependence composition within all lone-parent families. Qualification: A change in composition is not a measured transition of the same families or an estimate of absent-parent involvement. | UK lone-parent family units United Kingdom April–June 2015 and 2025 Selected item/subgroup n is not disclosed beside these figures. An overall report n is not a subgroup base. | Office for National Statistics Published 2026-04-17 Bulletin section 6/Figure 6. |
| F28 | Lone fathers accounted for 15.4% of lone-parent families in 2025 and 14.4% in 2015; lone mothers accounted for 84.6% and 85.6%. Definition: Parent-sex composition among lone-parent family units. Qualification: ONS states these changes are not statistically significant. | UK lone-parent family units United Kingdom April–June 2015 and 2025 Selected item/subgroup n is not disclosed beside these figures. An overall report n is not a subgroup base. | Office for National Statistics Published 2026-04-17 Bulletin section 6, opening paragraph. |
What types of census families does Canada count?
Canada recorded 10,262,920 census families in 2021. Couple families with and without resident children each made up 41.8% of the total. A census family is not necessarily an entire household, and its children can be adults.
| ID | Finding and qualification | Population, actual period and base | Original source and locator |
|---|---|---|---|
| F29 | Canada counted 10,262,920 census families in 2021: 1,686,340 one-parent families (16.4%) and 8,576,580 couple families (83.6%). Definition: All census family units in the covered household population. Qualification: Not a count of households, all kinship networks or only families with minor children. | Canadian census families Canada 2021 Census enumeration; this count is not a sample n. An overall report n is not a subgroup base. | Statistics Canada Published 2022-07-13 Table 1, census family structure. |
| F30 | Couples without resident children numbered 4,286,165; couples with children numbered 4,290,415. Each represented 41.8% of all census families. Definition: All census families form the percentage denominator. Qualification: Children may be adults. None resident does not establish lifetime childlessness. | Canadian census families Canada 2021 Census enumeration; this count is not a sample n. An overall report n is not a subgroup base. | Statistics Canada Published 2022-07-13 Table 1, couple families with/without children. |
| F31 | Two-parent non-stepfamilies numbered 3,786,935 (36.9% of all families); two-parent stepfamilies numbered 503,475 (4.9%). Definition: All-family shares, not shares within couple families with children. Qualification: Small count differences can arise through disclosure controls. Canadian definitions are not substituted for Australian family-blending definitions. | Canadian census families Canada 2021 Census enumeration; this count is not a sample n. An overall report n is not a subgroup base. | Statistics Canada Published 2022-07-13 Table 1, detailed two-parent categories. |
| F32 | Families with a child aged 0–5 represented 38.4% of families in Nunavut and 11.7% in Newfoundland and Labrador, versus 16.0% nationally. Definition: Within each geography’s census families. Qualification: Selected regional contrasts, not an explanation of family preferences or socioeconomic causes. | Census families within the named Canadian geographies Canada 2021 Census enumeration; this count is not a sample n. An overall report n is not a subgroup base. | Statistics Canada Published 2022-07-13 Table 2, regional family shares. |
| F33 | One-parent families represented 33.2% of families in Nunavut and 14.9% in British Columbia, versus 16.4% nationally. Definition: Within each geography’s census families. Qualification: Not percentages of children, women, or all households. | Census families within the named Canadian geographies Canada 2021 Census enumeration; this count is not a sample n. An overall report n is not a subgroup base. | Statistics Canada Published 2022-07-13 Table 3, regional one-parent family shares. |
| F34 | Average census-family size fell from 4.2 people in 1931 to 2.9 in 2021. Definition: People per census family, not per household. Qualification: Long-run published comparison, not a prediction or a causal account of family ties. | Canadian census families Canada 1931 and 2021 Census enumeration; this count is not a sample n. An overall report n is not a subgroup base. | Statistics Canada Published 2022-07-13 Did you know? statement and historical source note. |
Why is Canada’s household solo-living figure larger than its adult figure?
One-person households were 29.3% of Canadian households, while 14.5% of people aged 15 or older in private households lived alone in 2021. Both are valid, but they divide by different populations. Grandparent, roommate and complex-family counts need similarly precise labels.
| ID | Finding and qualification | Population, actual period and base | Original source and locator |
|---|---|---|---|
| F35 | In 2021, one-person households represented 29.3% of households, while solo residents were 14.5% of people 15+ in private households; about 4.4 million people lived alone. Definition: Household share and person share have different denominators. Qualification: A 29.3% household share does not mean 29.3% of adults live alone. | Canadian households and private-household residents 15+ Canada 2021 Census enumeration; this count is not a sample n. An overall report n is not a subgroup base. | Statistics Canada Published 2022-07-13 Top Canada indicator and Highlights/solo-living section. |
| F36 | Roommate households grew 54% from 2001 to 2021 but still represented only 4% of households in 2021. Definition: No resident forms a census family within that household. Qualification: Growth is a relative count change; 4% is prevalence. Related adult siblings can be outside the census-family concept. | Canadian roommate households / all private households Canada 2001–2021 count change; 2021 share Census enumeration; this count is not a sample n. An overall report n is not a subgroup base. | Statistics Canada Published 2022-07-13 Highlights, roommate-household bullet. |
| F37 | 986,400 households contained multiple generations, multiple census families, or one census family plus other people; together these were 7% of households in 2021. Definition: A combined category broader than three-generation households. Qualification: The combined category grew 45% since 2001. Do not call all 986,400 households multigenerational. | Canadian private households Canada 2021; stated 2001–2021 growth Census enumeration; this count is not a sample n. An overall report n is not a subgroup base. | Statistics Canada Published 2022-07-13 Highlights, other census-family households bullet. |
| F38 | 35.1% of adults 20–34 lived with at least one parent in 2021; a separate 15% lived with roommates. Definition: Age-specific living arrangements under the census classification. Qualification: Do not equate Canada’s at-least-one-parent measure with ONS’s parent-family measure, or add across unverified classifications. | Canadian adults 20–34 in the covered population Canada 2021 Census enumeration; this count is not a sample n. An overall report n is not a subgroup base. | Statistics Canada Published 2022-07-13 Canada top indicator and young-adult Highlights bullet. |
| F39 | Among children 0–14 in a one-parent family, 21% lived with their father in 2021, compared with 14% in 1981. Definition: Children are the denominator, not parent-family units. Qualification: Cannot be compared directly with the UK’s proportion of lone-parent families headed by fathers. | Canadian children 0–14 in one-parent census families Canada 1981 and 2021 Census enumeration; this count is not a sample n. An overall report n is not a subgroup base. | Statistics Canada Published 2022-07-13 Highlights, children’s one-parent families bullet. |
| F40 | 553,855 children 0–14 lived with a grandparent (9.3%); 516,995 also lived with a parent and 36,860 had no parent present. Definition: Grandparent co-residence within census-family children. Qualification: Three-generation and skip-generation homes are distinct; coresidence does not establish custody or primary care. | Canadian children 0–14 in census families Canada 2021 Census enumeration; this count is not a sample n. An overall report n is not a subgroup base. | Statistics Canada Published 2022-07-13 Canada top indicator; Highlights; Table 3. |
How does Canadian family composition differ by children’s age?
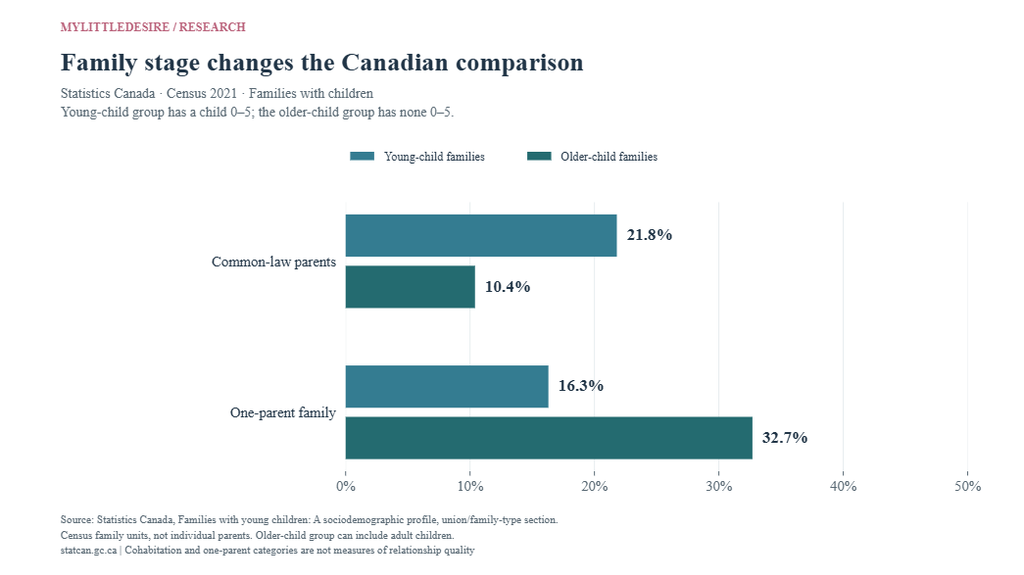
Among families with a child aged 0–5, 21.8% had common-law parents and 16.3% had one parent in 2021. Among families with only older children, the corresponding figures were 10.4% and 32.7%. These are cross-sectional family-stage comparisons; they do not follow the same families as children grow.
| ID | Finding and qualification | Population, actual period and base | Original source and locator |
|---|---|---|---|
| F41 | Families with at least one child aged 0–5 declined from 24.0% of all census families in 1981 to 16.0% in 2021. Definition: All-family denominator, with a youngest-child age criterion. Qualification: A family-composition share, not a current fertility rate or an individual parenthood probability. | Canadian census families Canada 1981 and 2021 Census enumeration; this count is not a sample n. An overall report n is not a subgroup base. | Statistics Canada Published 2024-10-22 Fewer families have young children at home, first paragraph. |
| F42 | Among families with a child 0–5 in 2021, 61.9% had married parents, 21.8% common-law parents and 16.3% one parent. Definition: Family types within the young-child family group. Qualification: Not shares of all families or of individual parents. | Canadian census families with at least one child 0–5 Canada 2021 Census enumeration; this count is not a sample n. An overall report n is not a subgroup base. | Statistics Canada Published 2024-10-22 Over one in five families with young children have parents in a common-law union. |
| F43 | In 1981, 86.4% of families with a child 0–5 had married parents and 4.0% common-law parents. Definition: Historical baseline for the same young-child family definition. Qualification: Do not treat a cross-sectional change as the transition probability of a particular couple. | Canadian census families with at least one child 0–5 Canada 1981 Census enumeration; this count is not a sample n. An overall report n is not a subgroup base. | Statistics Canada Published 2024-10-22 Same section, historical comparison around Chart 3. |
| F44 | Among families with older children in 2021, 10.4% had common-law parents and 32.7% one parent. Definition: Comparison group has older children and can include adult children. Qualification: These are different family stages, not the same families followed as children age. | Canadian census families with older children; none age 0–5 Canada 2021 Census enumeration; this count is not a sample n. An overall report n is not a subgroup base. | Statistics Canada Published 2024-10-22 Same section, older-child comparisons. |
| F45 | Of 268,170 one-parent families with a child 0–5 in 2021, 81.2% were mother-led, compared with 84.6% in 1981. Definition: Parent-family units with a young child, not all parents. Qualification: Different denominator from the child-level father share in F39. | Canadian one-parent census families with a child 0–5 Canada 1981 and 2021 Census enumeration; this count is not a sample n. An overall report n is not a subgroup base. | Statistics Canada Published 2024-10-22 Same section, paragraph on one-parent families with young children. |
| F46 | Parents of children 0–5 averaged 36.2 years old in 2021, up from 30.7 in 1981; 2021 means were 37.6 for fathers and 34.9 for mothers. Definition: Mean age of co-resident parents of young children. Qualification: Not age at first parenthood or a recommended childbearing age. | Canadian co-resident parents with at least one child 0–5 Canada 1981 and 2021 Census enumeration; this count is not a sample n. An overall report n is not a subgroup base. | Statistics Canada Published 2024-10-22 Young children, older parents. |
| F47 | In 2021, 33.3% of parents of young children were immigrants and 33.9% belonged to a racialized group. Definition: Individual parents, using the source’s classifications. Qualification: The groups overlap and must not be added. These are not percentages of families or young children. | Canadian co-resident parents with at least one child 0–5 Canada 2021 Census enumeration; this count is not a sample n. An overall report n is not a subgroup base. | Statistics Canada Published 2024-10-22 High level of ethnocultural diversity among parents of young children. |
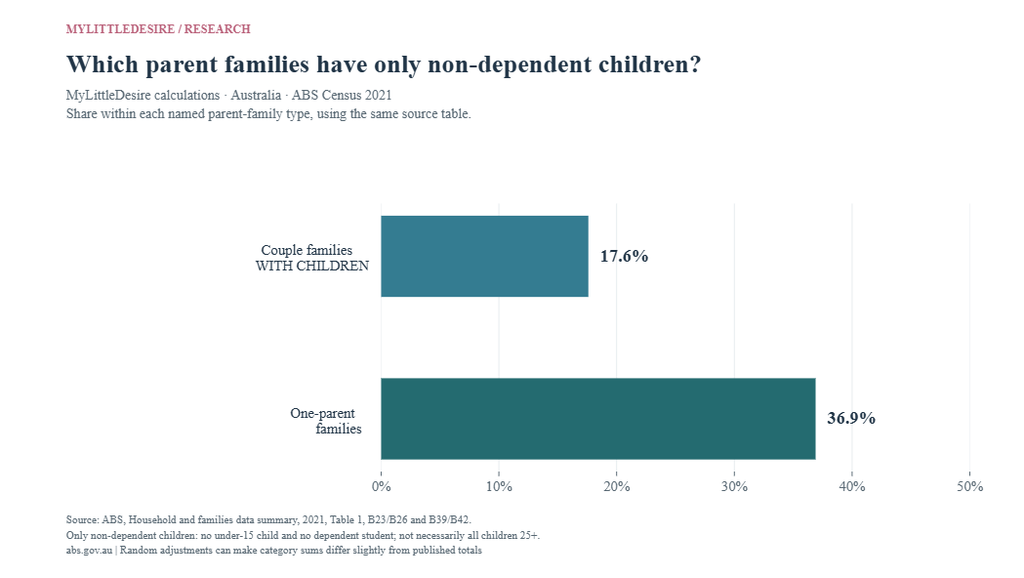
How many Australian parent families have only non-dependent children?
Our calculation from ABS’s published 2021 counts is approximately 17.6% of couple families with children and 36.9% of one-parent families. The denominators are the respective parent-family totals. Non-dependent does not necessarily mean age 25 or older, and confidentiality adjustments limit arithmetic precision.
| ID | Finding and qualification | Population, actual period and base | Original source and locator |
|---|---|---|---|
| F48 | Australia counted 6,730,187 families in 2021, including 2,608,834 couples without children, 2,944,140 couples with children, 1,068,268 one-parent families and 108,941 other families. Definition: Family units under the workbook’s enumeration rules. Qualification: Census random adjustments mean component sums may not equal totals. Not household counts. | Australian family units in the ABS summary Australia 2021 Census enumeration; this count is not a sample n. An overall report n is not a subgroup base. | Australian Bureau of Statistics Published 2022-06-28 release; workbook date 2022-06-28 Original XLSX, Table 1, B10/B26/B42/B44/B46. |
| F49 | The same workbook counted 19,616,339 people in families. Definition: Person count, excluding family members temporarily absent on Census night and overseas visitors. Qualification: Not all Australian residents and not the number of families. | Persons in Australian families under Table 1 rules Australia 2021 Census enumeration; this count is not a sample n. An overall report n is not a subgroup base. | Australian Bureau of Statistics Published 2022-06-28 release; workbook date 2022-06-28 Original XLSX, Table 1, C46 and person-count footnotes. |
| F50 | Among couples with children, 2,026,712 families had a child under 15; 917,427 had no under-15 child but had dependent students or non-dependent children. Definition: Presence of an under-15 child within couple-parent families. Qualification: The no-under-15 group can still include dependent students 15–24; it is not an adult-independent-only group. | Australian couple families with children in Table 1 Australia 2021 Census enumeration; this count is not a sample n. An overall report n is not a subgroup base. | Australian Bureau of Statistics Published 2022-06-28 release; workbook date 2022-06-28 Original XLSX, Table 1, B18/B24. |
| F51 | 519,457 couple-parent families and 394,202 one-parent families had only non-dependent children. Definition: No child under 15 and no dependent student, but non-dependent children present. Qualification: Non-dependent can include a 15–24-year-old who is not a full-time student. These counts support the clearly labeled calculated chart. | Australian couple-parent and one-parent family units Australia 2021 Census enumeration; this count is not a sample n. An overall report n is not a subgroup base. | Australian Bureau of Statistics Published 2022-06-28 release; workbook date 2022-06-28 Original XLSX, Table 1, B23/B39. |
| F52 | One-parent families included 523,571 with under-15 children and 544,691 without an under-15 child. Definition: Within one-parent family units; older students and non-dependent children remain possible. Qualification: Do not assume every one-parent family is raising a young child or interpret rounded residuals as exact household records. | Australian one-parent family units Australia 2021 Census enumeration; this count is not a sample n. An overall report n is not a subgroup base. | Australian Bureau of Statistics Published 2022-06-28 release; workbook date 2022-06-28 Original XLSX, Table 1, B34/B40. |
| F53 | The relationship table counted 209,608 males and 858,656 females in the lone-parent role. Definition: People classified in a household relationship role, using published sex categories. Qualification: Different from counts of children with one parent; small differences from family totals can reflect random adjustments. | Australian persons in the lone-parent relationship role Australia 2021 Census enumeration; this count is not a sample n. An overall report n is not a subgroup base. | Australian Bureau of Statistics Published 2022-06-28 release; workbook date 2022-06-28 Original XLSX, Table 3, K16/K32. |
| F54 | The 2021 Census counted 23,914 same-sex marriages. Definition: Census stock of recorded marriages, not marriages celebrated during one year. Qualification: Not all same-sex couples, all LGBT people or an annual marriage flow. | Same-sex married couples counted under the ABS release definition Australia 2021 Census enumeration; this count is not a sample n. An overall report n is not a subgroup base. | Australian Bureau of Statistics Published 2022-06-28 release; workbook date 2022-06-28 ABS release, Key statistics. |
| F55 | Australia had 2,424,680 couple families with dependent children and 674,059 one-parent families with dependent children in 2021. Definition: Dependent children under 15 or full-time students 15–24. Qualification: These are subsets of parent families. Child dependence definitions differ from the UK and US. | Australian census families with dependent children Australia 2021 Census enumeration; this count is not a sample n. An overall report n is not a subgroup base. | Australian Institute of Family Studies Published 2023-08-01 Overall family trends, first list. |
| F56 | Among one-parent families with dependent children, the share with two dependent children rose from 32% in 2011 to 34% in 2021. Definition: Conditional on one-parent family and at least one dependent child. Qualification: Not the share of all one-parent families, and not total lifetime family size. | Australian one-parent families with dependent children Australia 2011 and 2021 Census enumeration; this count is not a sample n. An overall report n is not a subgroup base. | Australian Institute of Family Studies Published 2023-08-01 How many dependent children in families with children?, paragraph before Figure 4. |
| F57 | Same-sex couples represented 1.4% of couples in 2021, versus 0.3% in 1996; the 2021 male/female couple split was approximately 50% each. Definition: Census-recorded co-resident couple categories, not sexual orientation prevalence. Qualification: Disclosure and classification changes affect trends. No same-sex-parent prevalence is inferred. | Australian census-recorded couples; same-sex subset for composition Australia 1996 and 2021 Census enumeration; this count is not a sample n. An overall report n is not a subgroup base. | Australian Institute of Family Studies Published 2023-08-01 Same-sex couple families, Figures 9–10 and accompanying text. |
How have Australian households changed over the long term?
The AIFS historical series puts average household size at 4.5 people in 1911 and 2.5 in 2021. Its family-household and solo-household comparisons are useful historical context, with changes in coverage, classification and temporary-absence rules. Household size does not measure the strength of family relationships.
| ID | Finding and qualification | Population, actual period and base | Original source and locator |
|---|---|---|---|
| F58 | The cited household series recorded 9.275 million households in 2021, 8.286 million in 2016 and 7.76 million in 2011. Definition: Household counts under the source’s census coverage. Qualification: Not family-unit counts; do not infer one family per household. | Australian households under the AIFS census-series coverage Australia 2011, 2016 and 2021 Census enumeration; this count is not a sample n. An overall report n is not a subgroup base. | Australian Institute of Family Studies Published 2023-07-19 More but smaller households, opening paragraph and footnotes. |
| F59 | Average household size was 4.5 people in 1911 and 2.5 in 2021. Definition: People per household, not per family. Qualification: A historical comparison with coverage/definition changes; smaller households do not measure weakening relationships. | Australian households in the published historical series Australia 1911 and 2021 Census enumeration; this count is not a sample n. An overall report n is not a subgroup base. | Australian Institute of Family Studies Published 2023-07-19 More but smaller households, Figure 10 discussion. |
| F60 | Family households declined from 78% in 1981 to 71% in 2021; one-person households increased from 18% to 26%. Definition: Composition of classifiable private households under the historical series. Qualification: 1981 uses a 1% Census household sample file; temporary-absence rules and classification changed. Rounded 2021 components can total 101. | Australian classifiable private households Australia 1981 and 2021 Census enumeration; this count is not a sample n. An overall report n is not a subgroup base. | Australian Institute of Family Studies Published 2023-07-19 More but smaller households, Figure 11 discussion and notes. |
24 comparisons with reproducible inputs
These descriptive calculations use matched inputs within a source. The Australian percentages are calculated from published counts; the other contrasts preserve their original units. Complementary categories and a ratio of the same figures are useful presentations, not independent scientific discoveries. Rounded endpoints limit precision.
| ID | Comparison | Arithmetic and unit | Original inputs and qualification |
|---|---|---|---|
| C01 | US married-couple household share: 2025 minus 1975 | 47 − 66 = -19.0 percentage points | F01 / F01 All-household denominator; rounded source estimates. |
| C02 | US own-under-18 share within married-couple households: 2025 minus 1975 | 37 − 54 = -17.0 percentage points | F02 / F02 Conditional married-couple household denominator, distinct from all families. |
| C03 | US own-under-18 share within all families: 2025 minus 1975 | 39 − 54 = -15.0 percentage points | F03 / F03 All-family denominator; do not substitute the married-couple percentage. |
| C04 | US one-person household share: 2025 minus 1975 | 29 − 20 = 9.0 percentage points | F04 / F04 Households, not people; not a loneliness change. |
| C05 | NCFMR married share within stepfamilies: 2025 minus 2019 | 60 − 56 = 4.0 percentage points | F10 / F10 Analyzed children in stepfamilies, same-sex-family children excluded; no new significance test. |
| C06 | UK parent-family residence 20–34: 2025 minus 2015 | 28.7 − 25.4 = 3.3 percentage points | F20 / F20 ONS excludes people classified in their own family even if co-resident with parents. |
| C07 | UK parent-family residence 20–34: male minus female, 2025 | 34.9 − 22.3 = 12.6 percentage points | F21 / F21 Within-sex prevalence, not a measure of causes or individual maturity. |
| C08 | UK male parent-family residence 20–34: 2025 minus 2015 | 34.9 − 30.5 = 4.4 percentage points | F21 / F21 Published point contrast; ONS reports the male increase significant, not a new test here. |
| C09 | UK married-couple share of families: 2025 minus 2015 | 65.3 − 66.6 = -1.3 percentage points | F24 / F24 All-family denominator; different from US share of all households. |
| C10 | UK lone-parent families with only non-dependent children: 2025 minus 2015 | 38.9 − 34.9 = 4.0 percentage points | F27 / F27 Within-lone-parent composition, not the total prevalence of one-parent families. |
| C11 | UK lone-parent families with dependent children: 2025 minus 2015 | 61.1 − 65.1 = -4.0 percentage points | F27 / F27 Complementary composition contrast, not an independent discovery or longitudinal family transition. |
| C12 | Canada mean family size: 2021 minus 1931 | 2.9 − 4.2 = -1.3 people/family | F34 / F34 People per census family, not household size; historical definitions/coverage may differ. |
| C13 | Canada young-child family share: 2021 minus 1981 | 16 − 24 = -8.0 percentage points | F41 / F41 All-family denominator, not a birth rate or attitude about parenthood. |
| C14 | Canada common-law family share: young-child minus older-child group | 21.8 − 10.4 = 11.4 percentage points | F42 / F44 Different youngest-child stages; older children can be adults. Cross-sectional, not an aging effect. |
| C15 | Canada one-parent family share: young-child minus older-child group | 16.3 − 32.7 = -16.4 percentage points | F42 / F44 Both groups contain children, with different age/dependence mixes. No causal explanation. |
| C16 | Canada married share within young-child families: 2021 minus 1981 | 61.9 − 86.4 = -24.5 percentage points | F42 / F43 Conditional family stage; no individual couple transition probability. |
| C17 | Canada common-law share within young-child families: 2021 minus 1981 | 21.8 − 4 = 17.8 percentage points | F42 / F43 Percentage points, not relative percentage growth. |
| C18 | Canada one-parent share: older-child versus young-child prevalence ratio | 32.7 ÷ 16.3 = 2.01 times | F44 / F42 Rounded prevalence ratio. Researchers already describe approximately twofold; no novelty or causal claim. |
| C19 | Australia only non-dependent children among couple-parent families | 519457 ÷ 2.94414e+06 × 100 = 17.6 percent | F51 / F48 Table 1 B23/B26. Approximate calculated share from confidentiality-adjusted census counts, not a published survey percentage. |
| C20 | Australia only non-dependent children among one-parent families | 394202 ÷ 1.06827e+06 × 100 = 36.9 percent | F51 / F48 Table 1 B39/B42. Use the published total; random adjustments mean category sums can differ slightly. |
| C21 | Australia family-household share: 2021 minus 1981 | 71 − 78 = -7.0 percentage points | F60 / F60 Historical household classification/temporary-absence changes; not a perfectly harmonized causal trend. |
| C22 | Australia one-person household share: 2021 minus 1981 | 26 − 18 = 8.0 percentage points | F60 / F60 Classifiable private-household denominator; not adults living alone. |
| C23 | Australia mean household size: 2021 minus 1911 | 2.5 − 4.5 = -2.0 people/household | F59 / F59 People per household; historical coverage differs, and family size is a different measure. |
| C24 | Australia one-parent dependent-child families with two children: 2021 minus 2011 | 34 − 32 = 2.0 percentage points | F56 / F56 Conditional dependent-child family subset; not the share of all one-parent families. |
Common questions about family structure
What percentage of US households are married-couple households?
The US Census release gives 47% in 2025, compared with 66% in 1975. That is the share of all households, not the share of adults who are married. Original source.
Does a family without resident children mean the adults never had children?
No. Children may have left home or live elsewhere. The UK “no resident children” category is a current co-residence classification. Original source.
Are all lone-parent families raising dependent children?
No. ONS reports that 38.9% of UK lone-parent families had only non-dependent children in 2025. Non-dependent can include some 16–18-year-olds. Original source.
Why are Canada’s living-alone percentages 29.3% and 14.5%?
The first is the share of households with one person. The second is the share of people aged 15 or older in private households who live alone. They are different denominators, not contradictory estimates. Original source.
How do Canadian young-child families differ from older-child families?
In 2021, common-law parents accounted for 21.8% of families with a child aged 0–5 versus 10.4% of families with only older children. The one-parent shares were 16.3% and 32.7%. These are different groups observed at one time. Original source.
Can family structure statistics show which families have better relationships?
The selected population counts and descriptive analyses do not establish that. They classify living arrangements rather than the quality of love, support, custody or contact. Original source.
Methodology and limitations
How sources were selected
We selected original statistical-agency releases, source workbooks, original census analyses and a Federal Reserve survey report. Every grouped finding records its source, exact table or passage locator, actual data period, eligible population, definition and caveat. Original XLSX cells were inspected rather than copied from secondary roundups.
What 60 findings means
The database contains 60 grouped findings and 171 numeric inputs from ten source records published by seven organizations. Related categories and comparisons share finding IDs. These are not 60 studies or ten independent samples. The US Census release and NCFMR use CPS; Canadian releases reuse census data; ABS and AIFS reuse Australian census data. ONS supplies 13 findings, the largest single source contribution.
Edition and actual data years
2027 is the editorial edition. Sources were reviewed October 31, 2026. Selected US and UK observations reach 2025; selected Canadian and Australian census observations are from 2021, with clearly labeled historical comparisons. A 2026 analysis of 2021 data does not become a 2026 measurement. No 2027 observations, realized projections or future publication dates are claimed.
Sampling, enumeration and uncertainty
Census population counts are not sample sizes. SHED’s final overall analytic sample was 12,934 adults, but no undisclosed subgroup n is filled with that total. The ONS design-cover description is not treated as the achieved 2025 sample. Twenty original UK count estimates and their published 95% confidence half-widths are retained in the source-quality file and workbook. Missing margins remain blank; count intervals are not repurposed as percentage or difference intervals.
Coverage and source limitations
The NCFMR child-family analysis excludes children in same-sex families and includes two adoptive parents in its two-biological-parent label. The ABS documents a 2021 stepchild overcount in several jurisdictions; affected step/blended prevalence is excluded. Two ancillary source inconsistencies—AIFS historical-chart alternative text and a Justice Canada multigeneration baseline year—are documented in the owner audit rather than silently corrected into the article.
Comparable calculations
MyLittleDesire contributes four charts, 24 reproducible descriptive calculations and a definition-guided illustration of how two adult siblings can be classified across countries. Calculations use published inputs from the same source and retain units. Percentage-point changes, ratios, within-group shares and changes in mean household/family size are different measures. Some contrasts are already apparent in the original research; these are not new scientific discoveries.
Limits of interpretation
Cross-sectional family-stage differences do not estimate a transition as a child ages. Co-resident structure does not identify custody, non-resident contact or relationship quality. Age bands, family definitions, observation years and exclusions differ across countries, so this resource does not rank countries using incompatible percentages. No new causal estimates, significance tests or sampling intervals were generated.
Rounding and historical changes
Published percentages and headline counts are rounded. Canadian and Australian disclosure controls can make component sums differ slightly from totals. Calculations use reported denominators, not totals forced from adjusted components. Historical series retain the original agency comparison with its coverage and definition limits. Additional decimal places do not add precision.
Updating the resource
Check each original release and workbook before substituting a newer number. Reconcile the population, age limits, classification and units first. Keep historically useful findings clearly dated. Change the last-reviewed or publication information only after a real review or substantive update; preserve the evergreen article URL.
Related MyLittleDesire research
Marriage and Divorce Statistics examines marriage and divorce records. Cohabitation Statistics focuses on living-together relationships. Stepfamily and Blended Family Statistics explores more specific family arrangements. Parent–Adult Child Relationship Statistics and Family Caregiving and Relationship Statistics address family ties and responsibilities beyond a household count.
Complete original-source bibliography
- S01 · US Census Bureau. America’s Families and Living Arrangements: 2025 release.
Published 2025-12-02. Data period: 1975 and 2025 CPS ASEC.
Population: Households, family households, married-couple households or adults in the specified age groups; denominator varies
Method: Original weighted Current Population Survey Annual Social and Economic Supplement estimates. The release identifies the two reference years and links 2025 technical documentation. CPS family means people related to the householder by birth, marriage or adoption. Own children under 18 are never-married biological, step or adopted children under the source definition.
Limits: Rounded release estimates. Counts of households, families and people are different units. A married-couple share of all households is not a share of families or adults. Families without own under-18 children may have adult children or other children present and are not necessarily childfree. Selected item n and intervals are not printed in this release. Census comparison statements use its stated testing convention; no new tests here.
Supporting document 1 · Supporting document 2
Reviewed October 31, 2026. - S02 · Bowling Green State University, National Center for Family & Marriage Research. Children’s Family Structure, 2025 (FP-26-06).
Published 2026 profile; page updated 2026-07-08. Data period: 2019 and 2025 CPS ASEC / IPUMS CPS.
Population: Analyzed children under 18; children in same-sex families excluded by the authors
Method: Original NCFMR analysis by Jaycob Applegate using IPUMS CPS. The published two-biological-parent category also includes two adoptive parents. Parent union status and single-parent sex percentages have conditional bases.
Limits: Same-sex-family children are excluded because of small sample sizes; selected estimates are not an inclusive count of all US children. This uses the same CPS program as S01, not an independent survey. Rounding and unreported analytic n/intervals apply. No new significance claim or family-outcome inference. Race/ethnicity categories follow source definitions, including a broad Asian/NHPI category.
Reviewed October 31, 2026. - S03 · Board of Governors of the Federal Reserve System. Economic Well-Being of U.S. Households in 2025: Living Arrangements and Care Work.
Published May 2026; exact report publication day not established. Data period: 2025-10-17 to 2025-10-28; labeled 2019/2022 comparison references.
Population: Adults 18+ in SHED; age-specific subsets vary
Method: Ipsos KnowledgePanel probability-based online survey with address-based recruitment and weighting. 13,099 completed; final analytic sample 12,934. Final-stage completion 73.2%; cumulative recruitment response 4.1%. Original Table 8 and survey methods inspected.
Limits: Adults are the denominator, not households. Multiple co-resident relationships can overlap. The report’s adult multigeneration measure requires at least two generations of adults, unlike some three-generation census measures. Overall n is not assigned to unreported item/subgroup bases. No causal conclusion from family arrangements.
Supporting document 1
Reviewed October 31, 2026. - S04 · Office for National Statistics. Families and households in the UK: 2025.
Published 2026-04-17. Data period: April–June 2025 LFS; April–June 2015 comparisons.
Population: Families and households under LFS definitions; some findings concern people aged 15–34 or 20–34
Method: Weighted LFS household dataset, April–June quarter each year. Bulletin plus original nine-table and young-adult workbooks inspected. Source-quality CSV/workbook tab retain selected exact count estimates and published 95% confidence half-widths, in thousands.
Limits: Lower achieved samples increase uncertainty. The cover’s generic 41,000-household design description is not a verified 2025 achieved n. Do not apply count confidence margins to percentages. Bulletin says some changes are not significant, including lone-parent share/sex and cohabiting share. Parent-home measure excludes people classified in their own family after partnering/having a child, even if co-resident with parents. Dependent means under 16 or 16–18 in full-time education under specified family rules; non-dependent can include 16–18. No children means none resident, not never having children. One-family households can include other people.
Supporting document 1 · Supporting document 2
Reviewed October 31, 2026. - S05 · Statistics Canada. A portrait of Canada’s families in 2021.
Published 2022-07-13. Data period: 2021 Census; historical 1931 comparison.
Population: Census families in private households; selected regional percentages
Method: Original census infographic with accessible numeric tables. Census family consists of a couple with or without children, or a parent with a qualifying co-resident child. Children can be adults. Original family-structure counts, regional denominators and mean-size statement inspected.
Limits: Census counts, not a sample n; disclosure controls and rounding apply. One-parent share uses all census families, while the stepfamily share in Table 1 also uses all families and cannot be presented as a share of couple families with children. A family is not necessarily a whole household or everyone related within it. Historical size comparison is not a 2027 estimate.
Reviewed October 31, 2026. - S06 · Statistics Canada. Home alone: More persons living solo than ever before, but roomies the fastest growing household type.
Published 2022-07-13. Data period: 2021 Census; labeled 1981/2001 comparisons.
Population: Private-household residents and households; children 0–14 or young adults 20–34 as specified
Method: Original census analysis. Precise 14.5% adult solo-living figure in the indicator is retained over the rounded 15% narrative. Parent-home measure concerns at least one co-resident parent. Child-grandparent counts separate parent-present and skip-generation arrangements.
Limits: People, households and children have distinct denominators. Roommate household means two or more people with no census family, and is not limited to unrelated friends. Three-generation households differ from the SHED adult-generation measure. Coresidence is not primary care, custody or relationship quality. No international ranking from mixed years/definitions.
Reviewed October 31, 2026. - S07 · Statistics Canada. Families with young children: A sociodemographic profile.
Published 2024-10-22. Data period: 1981 and 2021 Census comparisons; main current findings refer to 2021.
Population: Census families with at least one child aged 0–5; comparison families with older children; individual parents where specified
Method: Original census analysis distinguishing youngest-child family stages, union types and parental characteristics. Parents of young children and families with young children are separate units.
Limits: Older children can include adult children, so this is not a comparison of two preschool-parent groups or a longitudinal effect of children aging. Counts reflect census classification, not continuous family relationships across homes. Immigrant status and racialized-group membership overlap; do not sum them or infer effects. Later migration/price changes are not added as measured 2021 changes.
Reviewed October 31, 2026. - S08 · Australian Bureau of Statistics. Household and families: Census, 2021; original data summary workbook.
Published 2022-06-28 release; workbook date 2022-06-28. Data period: 2021 Census.
Population: Enumerated families and persons in the specified family/relationship categories
Method: Original ABS Census summary and XLSX. Table 1 counts families and persons in families; Table 3 counts relationship roles. Table 1 is based on place of enumeration, with separate person exclusions. Original cell values inspected directly.
Limits: Small random adjustments can make component sums differ from totals. Use the published total within the same table for calculated conditional percentages; label them approximate. Family units and person counts differ. Dependence includes children under 15 and full-time students 15–24. Non-dependent children need not all be 25+. ABS flags 2021 step-child overcount/natural-child undercount in several jurisdictions; affected family-blending counts are withheld.
Supporting document 1 · Supporting document 2
Reviewed October 31, 2026. - S09 · Australian Institute of Family Studies. Families and family composition.
Published 2023-08-01. Data period: Mainly 2021 Census; explicit 1996/2011 comparisons.
Population: Census family units with dependent children; reported same-sex couple categories
Method: Original AIFS analysis/synthesis of ABS Census and TableBuilder data. Selected dependent-family counts, two-dependent-child one-parent shares and same-sex-couple figures inspected.
Limits: Overlaps the ABS census source, not an independent survey. Census-recorded same-sex couple households are not all LGBT people or non-cohabiting couples. Disclosure willingness and social/legal changes may affect counts. Figure 1 alternative text conflicts with the 2021 couple-only figure; affected trend is omitted. Affected stepfamily percentages and ambiguous student-denominator sentence are withheld.
Supporting document 1 - S10 · Australian Institute of Family Studies. Population, households and families.
Published 2023-07-19. Data period: 2021 Census; explicit 1911/1981/2011/2016 historical comparisons.
Population: Classifiable private households; mean household-size series under source definitions
Method: Original AIFS historical Census analysis, including 1981 1% household sample file. Notes exclude visitors-only/other non-classifiable households from household-composition comparisons; historical temporary-absence classification differs.
Limits: Not an independent survey of 2027 conditions. Family households can contain more than one family. Rounded composition shares can total 101. Mean household size is not census-family size. Historic household-definition/coverage changes limit causal or perfectly harmonized century-long interpretation.
How to cite this resource
MyLittleDesire. Family Structure Statistics 2027 https://mylittledesire.com/family-structure-statistics/.