Singlehood can describe a relationship status, a current preference or a period between relationships. Living alone and being unmarried measure other things. Keeping the definition attached to each number makes the research more useful—and helps avoid misleading headlines.
What do single, unmarried, unpartnered and living alone mean?
Start with the definition that answers your question. The same person can meet one definition and not another.
| Term | What it measures | Relevant findings |
|---|---|---|
| Single in the Pew dating survey | Not married, not living with a partner and not in a committed romantic relationship. | F08–F16 |
| Unpartnered in the Pew ACS analysis | Not living with a spouse or identified unmarried partner. A nonresident partner can exist. | F01–F07 |
| Unmarried in the wealth analysis | No legal spouse; cohabiting household heads are included. | F54–F60 |
| Living alone | One usual resident in a household, subject to each source’s coverage rules. Romantic status is not established. | F32–F53 |
| Never married | Legal marital history; someone may currently be cohabiting or dating. | Definition context, not an interchangeable single rate |
| Preferring singlehood | A reported attitude at the time of a survey; not a lifetime forecast. | F20–F31 |
Key singles and singlehood findings
42%
30%
Were not living with a spouse or partner in the 2023 US analysis.
Met the US survey definition of single in July 2022.
57%
31%
Of US singles were not currently looking for a relationship or casual dates.
Of single-and-looking Americans wanted only a committed relationship.
57%
24%
Of GB singles were happy being single.
Of GB singles wanted a relationship now.
38%
8.6m
Of GB singles selected home/routine control as a top benefit.
People lived alone in the UK in 2025.
14.5%
16.5%
Of Canadians 15+ in private households lived alone in 2021.
Of Canadian solo dwellers 20+ had a partner living elsewhere in 2017.
125,023
+$5,100 / −$20,500
Lone females 85+ were counted in the specified ABS table, versus 46,236 males.
Female-minus-male median household wealth gaps, all ages versus under 65.
How many US adults live without a partner?
Pew’s residence-based analysis found 42% were not living with a spouse or partner in 2023. This is a household measure: someone dating a partner who lives elsewhere can still be classified as unpartnered.
| ID | Finding and qualification | Population, actual period and base | Original source and locator |
|---|---|---|---|
| F01 | 42% of US adults were not living with a spouse or partner in 2023, down from 44% in 2019; married shares were 51% and 50%, and cohabiting shares 7% and 6%. Definition: Residence-based unpartnered definition; published percentages. Qualification: Not a self-reported absence of every romantic relationship. Nonresident partners can exist; ACS misses some cohabitors. | Adults 18+; education figures use adults 25+ United States 2023 ACS; 2019 comparison Item/subgroup bases are not provided alongside these estimates. Overall report size is not the valid base for every item. | Pew Research Center Published 2025-01-08 Opening paragraphs and methods box. |
| F02 | Women were more likely than men to be unpartnered in 2023: 44% versus 40%. Definition: No resident spouse or identified unmarried partner. Qualification: Composition and age differ; no causal gender effect is isolated. | Adults 18+; education figures use adults 25+ United States 2023 ACS; 2019 comparison Item/subgroup bases are not provided alongside these estimates. Overall report size is not the valid base for every item. | Pew Research Center Published 2025-01-08 Demographic list, Gender. |
| F03 | Unpartnered shares were 86% at 18–24, 42% at 25–39, 29% at 40–54, 32% at 55–64 and 41% at 65+. Definition: Share within each adult age group. Qualification: Cross-sectional age profile, not an individual’s trajectory into or out of partnership. | Adults 18+; education figures use adults 25+ United States 2023 ACS; 2019 comparison Item/subgroup bases are not provided alongside these estimates. Overall report size is not the valid base for every item. | Pew Research Center Published 2025-01-08 Demographic list, Age. |
| F04 | Among adults 65+, 51% of women and 29% of men were unpartnered in 2023. Definition: Share within each age 65+ sex/gender group used by the analysis. Qualification: Does not measure loneliness, widowhood alone or willingness to date. | Adults 18+; education figures use adults 25+ United States 2023 ACS; 2019 comparison Item/subgroup bases are not provided alongside these estimates. Overall report size is not the valid base for every item. | Pew Research Center Published 2025-01-08 Demographic list, Gender and age. |
| F05 | Reported unpartnered shares were 61% among Black adults, 45% Hispanic, 38% White and 35% Asian adults. Definition: Pew’s race/ethnicity classifications in the ACS analysis. Qualification: Descriptive composition differences; no cultural or biological explanation is established. | Adults 18+; education figures use adults 25+ United States 2023 ACS; 2019 comparison Item/subgroup bases are not provided alongside these estimates. Overall report size is not the valid base for every item. | Pew Research Center Published 2025-01-08 Demographic list, Race and ethnicity. |
| F06 | 44% of US-born adults and 33% of foreign-born adults were unpartnered in 2023. Definition: Nativity groups in the resident adult population. Qualification: Not the percentage unmarried by citizenship, and not an immigration effect. | Adults 18+; education figures use adults 25+ United States 2023 ACS; 2019 comparison Item/subgroup bases are not provided alongside these estimates. Overall report size is not the valid base for every item. | Pew Research Center Published 2025-01-08 Demographic list, Nativity. |
| F07 | Among adults 25+, 44% without a high-school diploma and 30% with at least a bachelor’s degree were unpartnered. Definition: Adults 25+, unlike the 18+ overall estimate. Qualification: No adjustment for age, income or other composition; education does not establish causation. | US adults 25+ in the specified education groups United States 2023 ACS; 2019 comparison Item/subgroup bases are not provided alongside these estimates. Overall report size is not the valid base for every item. | Pew Research Center Published 2025-01-08 Demographic list, Education. |
How many single Americans want to date or find a relationship?
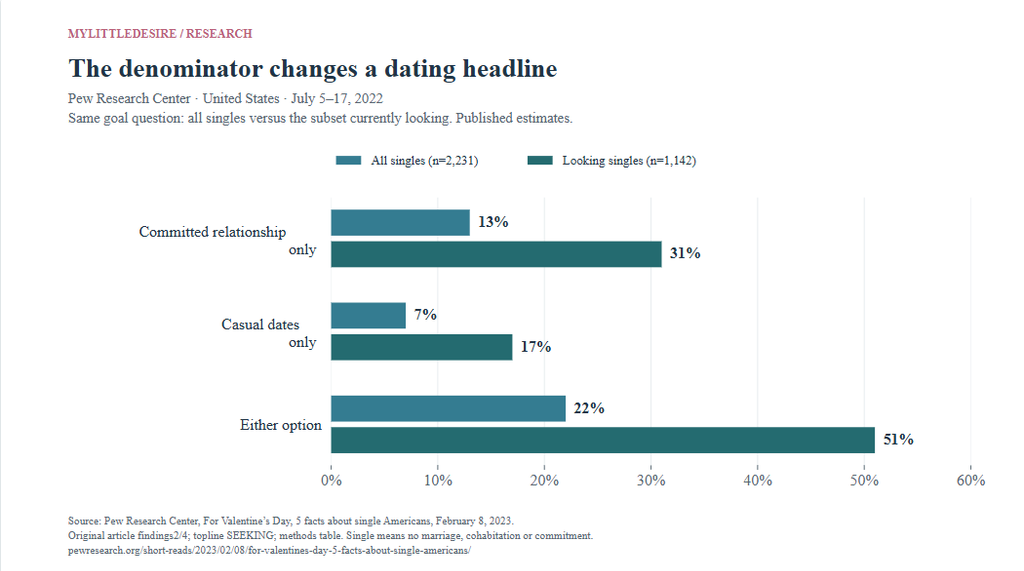
In Pew’s July 2022 survey,30% of adults met its stricter single definition. Among those singles,57% were not currently looking for romance. Goals among everyone who is single differ from goals within the subset looking.
| ID | Finding and qualification | Population, actual period and base | Original source and locator |
|---|---|---|---|
| F08 | 30% of US adults were single in the July 2022 survey. Definition: Not married, not living with a partner and not in a committed romantic relationship. Qualification: Different from the residence-only ACS definition and the unmarried wealth definition. | Adults 18+; n=6,034 overall, singles n=2,231, single-and-looking n=1,142 United States 2022-07-05 to 2022-07-17; selected 2019 comparisons Overall report n=6,034. Published input bases: 6,034. Overall report size is not the valid base for every item. | Pew Research Center Published 2023-02-08 Original article, first finding; topline p.2, COMBO. |
| F09 | 47% of adults under 30 were single, versus 21% of those 30–49. Definition: Within-age prevalence using the survey single definition. Qualification: Not an estimate for every member of a named generation or for teenagers. | Adults 18+; n=6,034 overall, singles n=2,231, single-and-looking n=1,142 United States 2022-07-05 to 2022-07-17; selected 2019 comparisons Overall report n=6,034. Item/subgroup bases are not provided alongside these estimates. Overall report size is not the valid base for every item. | Pew Research Center Published 2023-02-08 Article, first finding, age paragraph. |
| F10 | 63% of men 18–29 described themselves as single, versus 34% of women in that age group. Definition: Same age band and survey definition, different respondent groups. Qualification: Not a count of unmatched heterosexual partners; ages, orientation and relationships outside the band can differ. | Adults 18+; n=6,034 overall, singles n=2,231, single-and-looking n=1,142 United States 2022-07-05 to 2022-07-17; selected 2019 comparisons Overall report n=6,034. Item/subgroup bases are not provided alongside these estimates. Overall report size is not the valid base for every item. | Pew Research Center Published 2023-02-08 Article, first finding, age/gender paragraph. |
| F11 | Among singles, 57% were not looking;13% wanted only a committed relationship, 7% only casual dates and 22% either. The published looking NET was 42%. Definition: All single respondents; n=2,231. Qualification: 42% is the published NET; do not replace it with 100−57=43. Rounded categories/nonresponse can prevent a100% total. | US single adults; eligible n=2,231 United States 2022-07-05 to 2022-07-17; selected 2019 comparisons Overall report n=6,034. Published input bases: 2,231. Overall report size is not the valid base for every item. | Pew Research Center Published 2023-02-08 Article, second finding; topline p.1, SEEKING. |
| F12 | 50% of single men and 35% of single women were looking for a relationship and/or casual dates. Definition: At least one romantic/dating goal among singles. Qualification: Not the share wanting only commitment. Exact single-gender valid n not given in this summary. | US single men or women; subgroup n unavailable United States 2022-07-05 to 2022-07-17; selected 2019 comparisons Overall report n=6,034. Item/subgroup bases are not provided alongside these estimates. Overall report size is not the valid base for every item. | Pew Research Center Published 2023-02-08 Article, second finding, gender comparison. |
| F13 | Looking shares among singles were 57% under 50, 36% at 50–64 and 16% at 65+. Definition: Currently seeking a committed relationship and/or casual dates. Qualification: Not everyone under 50, and not an observed long-term change as people age. | US single adults in each specified age band United States 2022-07-05 to 2022-07-17; selected 2019 comparisons Overall report n=6,034. Item/subgroup bases are not provided alongside these estimates. Overall report size is not the valid base for every item. | Pew Research Center Published 2023-02-08 Article, second finding, age comparison. |
| F14 | The looking share fell from 49% in 2019 to 42% in 2022; among men 61% to 50%, and among women 38% to 35%. Definition: Separate historical survey waves using source-published combined estimates. Qualification: Pew reports no significant change for women; do not turn the−3-point arithmetic into a significant decline. Not-looking wording differed slightly. | US singles; different historical-wave samples United States 2019-10-16 to 2019-10-28 and 2022-07-05 to 2022-07-17 Overall report n=6,034. Item/subgroup bases are not provided alongside these estimates. Overall report size is not the valid base for every item. | Pew Research Center Published 2023-02-08 Article, third finding; 2019 wording note in topline p.1. |
| F15 | Among single-and-looking adults, 31% wanted only commitment, 17% only casual dates and 51% either; commitment-only was 41% for women and 25% for men. Definition: Conditional on being single and looking, not all singles. Qualification: Looking men n=606, women n=519; these raw sample sizes reflect oversampling and do not indicate population sex balance. | US singles seeking a relationship and/or casual dates; n=1,142 United States 2022-07-05 to 2022-07-17; selected 2019 comparisons Overall report n=6,034. Published input bases: 519, 606, 1,142. Overall report size is not the valid base for every item. | Pew Research Center Published 2023-02-08 Article, fourth finding; methods table, looking n=1,142. |
| F16 | 45% of single-and-looking adults used a dating site or app in the past year;53% under 50 and 26% at 50+ did so. Definition: Past-year use, including current use, among people single and looking. Qualification: Not 45% of every single adult. This is bounded context; app behavior is covered separately in the Online Dating Hub. | US single-and-looking adults, with age subgroups United States 2022-07-05 to 2022-07-17; selected 2019 comparisons Overall report n=6,034. Published input bases: 1,142. Overall report size is not the valid base for every item. | Pew Research Center Published 2023-02-08 Article, fifth finding. |
How do British singles feel about singlehood?
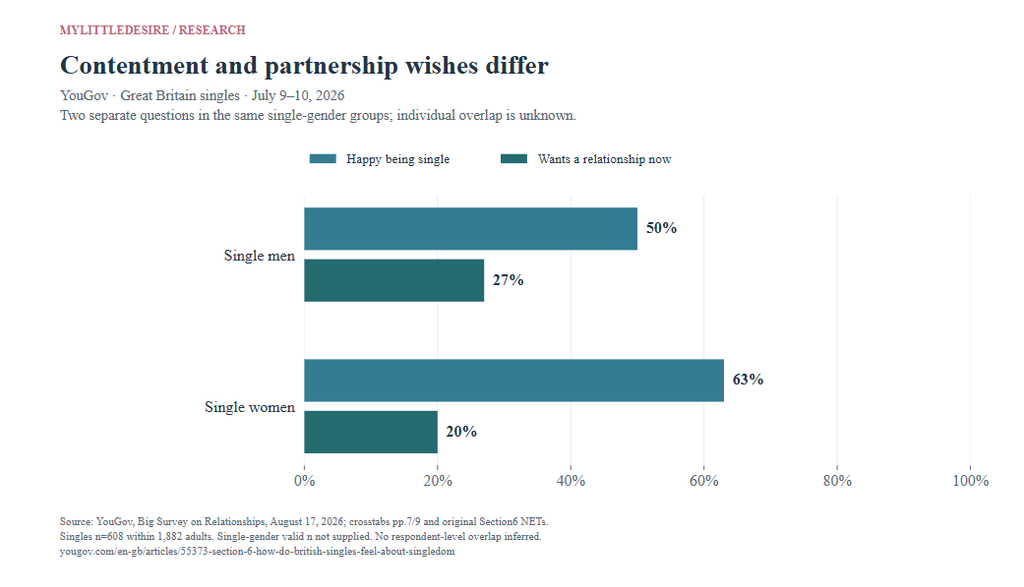
YouGov’s July 2026 survey found that most singles were happy with their status. Some wanted a relationship immediately, some in the future and others selected never. Satisfaction, preferences and barriers are separate measures; the same person can report more than one relevant experience.
| ID | Finding and qualification | Population, actual period and base | Original source and locator |
|---|---|---|---|
| F17 | 33% of GB adults were not currently in a relationship, 65% were partnered and 2% preferred not to say. Definition: Self-reported current relationship, all adults. Qualification: Not the share unmarried or living alone. | GB adults 18+ n=1,882; not-currently-in-relationship group n=608 (weighted base 626); partnered group n=1,233 Great Britain, not the whole United Kingdom 2026-07-09 to 2026-07-10 Overall report n=1,882. Published input bases: 1,882. Overall report size is not the valid base for every item. | YouGov Published 2026-08-17 PDF p.1, current relationship question. |
| F18 | Among current singles, 71% had previously been in a relationship and 27% never had. Definition: Current single group n=608. Qualification: Not 27% of all GB adults; remaining response share preferred not to say. | GB adults not currently in a relationship; n=608 Great Britain, not the whole United Kingdom 2026-07-09 to 2026-07-10 Overall report n=1,882. Published input bases: 608. Overall report size is not the valid base for every item. | YouGov Published 2026-08-17 PDF p.1, prior relationship history. |
| F19 | 15% of currently partnered GB adults did not live with their partner. Definition: Conditional on currently having a relationship. Qualification: Demonstrates why non-co-residence is not singlehood; not 15% of all adults or of singles. | GB currently partnered adults; n=1,233 Great Britain, not the whole United Kingdom 2026-07-09 to 2026-07-10 Overall report n=1,882. Published input bases: 1,233. Overall report size is not the valid base for every item. | YouGov Published 2026-08-17 PDF p.1, co-residence question, partnered n=1,233. |
| F20 | 57% of singles were happy with their status, including 30% very happy;24% were neutral and 17% unhappy. Definition: Very/fairly happy NET; current single group. Qualification: Happiness with status is not a general mental-health score, and can coexist with future partner interest. | GB current singles; n=608 Great Britain, not the whole United Kingdom 2026-07-09 to 2026-07-10 Overall report n=1,882. Published input bases: 608. Overall report size is not the valid base for every item. | YouGov Published 2026-08-17 PDF p.7 happiness item; original Section 6 summary, published NETs. |
| F21 | 63% of single women and 50% of single men were happy being single;38% and 22%, respectively, were very happy. Definition: Within single-gender groups. Qualification: Exact eligible gender n unavailable; full-survey male/female n are not the single subgroup bases. | GB single women or men; exact subgroup n unavailable Great Britain, not the whole United Kingdom 2026-07-09 to 2026-07-10 Overall report n=1,882. Item/subgroup bases are not provided alongside these estimates. Overall report size is not the valid base for every item. | YouGov Published 2026-08-17 PDF p.7 and original Section 6 summary NETs. |
| F22 | 65% of singles 60+ were happy being single, versus 48% of singles under 40. Definition: Published under 40 and 60+ groups, not 18–29 alone. Qualification: Cross-sectional age contrast; no inference that a person becomes happier by staying single. | GB singles 18–39 or 60+; exact subgroup n unavailable Great Britain, not the whole United Kingdom 2026-07-09 to 2026-07-10 Overall report n=1,882. Item/subgroup bases are not provided alongside these estimates. Overall report size is not the valid base for every item. | YouGov Published 2026-08-17 Original Section 6 happiness age paragraph; published combined under 40 estimate. |
| F23 | 24% of singles wanted a relationship now, 35% in the future but not now, 23% selected never, and 18% did not know. Definition: Four current-response categories. Qualification: Never is the response wording, not proof of a lifetime outcome. Do not equate future interest with current dissatisfaction. | GB current singles; n=608 Great Britain, not the whole United Kingdom 2026-07-09 to 2026-07-10 Overall report n=1,882. Published input bases: 608. Overall report size is not the valid base for every item. | YouGov Published 2026-08-17 PDF p.9, relationship-desire question. |
| F24 | 27% of single men and 20% of single women wanted a relationship now;17% of men and 29% of women selected never. Definition: Within single-gender groups. Qualification: Unknown individual overlap with happiness; no share of happy-but-looking people can be calculated. | GB single men or women; exact subgroup n unavailable Great Britain, not the whole United Kingdom 2026-07-09 to 2026-07-10 Overall report n=1,882. Item/subgroup bases are not provided alongside these estimates. Overall report size is not the valid base for every item. | YouGov Published 2026-08-17 PDF p.9, relationship desire by gender. |
| F25 | 35% of singles 18–29 wanted a relationship now versus 12% at 60+;47% and 16% wanted one in the future but not now. Definition: Separate age-specific desire categories. Qualification: Not all members of either generation; the selected categories do not identify later partnerships. | GB singles 18–29 or 60+; exact subgroup n unavailable Great Britain, not the whole United Kingdom 2026-07-09 to 2026-07-10 Overall report n=1,882. Item/subgroup bases are not provided alongside these estimates. Overall report size is not the valid base for every item. | YouGov Published 2026-08-17 PDF p.9, age columns. |
| F26 | Reasons for singlehood included not meeting the right person(42%), preferring singlehood(35%), no current interest(30%), trust difficulty(29%) and stressful dating(29%). Definition: Multiple current reasons may be selected by the same person. Qualification: Preferences and barriers can coexist. These are not mutually exclusive shares of voluntary/involuntary singlehood. | GB current singles; n=608 Great Britain, not the whole United Kingdom 2026-07-09 to 2026-07-10 Overall report n=1,882. Published input bases: 608. Overall report size is not the valid base for every item. | YouGov Published 2026-08-17 PDF p.9, select-all reasons. |
| F27 | Singles 18–29 versus 60+ cited focusing on work/education at 30% versus 1%, and preferring singlehood at 23% versus 45%. Definition: Same multi-select items, respondent age contrast. Qualification: These do not show that career focus causes singlehood or that preferences are permanent. | GB singles 18–29 or 60+; exact subgroup n unavailable Great Britain, not the whole United Kingdom 2026-07-09 to 2026-07-10 Overall report n=1,882. Item/subgroup bases are not provided alongside these estimates. Overall report size is not the valid base for every item. | YouGov Published 2026-08-17 PDF p.9, reasons by age. |
| F28 | 37% of single women and 23% of single men cited no current relationship interest;27% and 19% cited hurt in previous relationships. Definition: Current self-reported reasons, select all. Qualification: Not measures of trauma or proof that a past relationship caused the present status. | GB single women or men; exact subgroup n unavailable Great Britain, not the whole United Kingdom 2026-07-09 to 2026-07-10 Overall report n=1,882. Item/subgroup bases are not provided alongside these estimates. Overall report size is not the valid base for every item. | YouGov Published 2026-08-17 PDF p.9, reasons by gender. |
| F29 | Top benefits included control over home/routine(38%), avoiding stress(32%), fewer expectations(32%), independence(31%) and personal time(29%). Definition: Selected among the benefits that respondents liked most. Qualification: Not the prevalence of every benefit ever experienced; items overlap. | GB current singles; n=608 Great Britain, not the whole United Kingdom 2026-07-09 to 2026-07-10 Overall report n=1,882. Published input bases: 608. Overall report size is not the valid base for every item. | YouGov Published 2026-08-17 PDF p.13, benefits, choose up to three. |
| F30 | 45% of single women and 31% of single men selected control over home/routine;37% and 27% selected fewer partner expectations. Definition: Choose up to three most-liked benefits. Qualification: No new gender significance test or causal effect; valid subgroup n unavailable. | GB single women or men; exact subgroup n unavailable Great Britain, not the whole United Kingdom 2026-07-09 to 2026-07-10 Overall report n=1,882. Item/subgroup bases are not provided alongside these estimates. Overall report size is not the valid base for every item. | YouGov Published 2026-08-17 PDF p.13, benefits by gender. |
| F31 | Top drawbacks included missing companionship(24%), conversation(22%), affection(22%) and partner emotional support(21%);21% said nothing bothered them. Missing sex was selected by 23% of single men and 10% of single women; less practical support by 22% of women and 10% of men. Definition: Most-bothersome drawbacks; male/female figures also identify contrasting concerns. Qualification: Not a clinical loneliness rate. Gender item margins are not individual overlaps or evidence that all singles lack support. | GB current singles n=608; exact gender-subgroup n unavailable Great Britain, not the whole United Kingdom 2026-07-09 to 2026-07-10 Overall report n=1,882. Published input bases: 608. Overall report size is not the valid base for every item. | YouGov Published 2026-08-17 PDF p.11, drawbacks, choose up to three; gender rows retained. |
How many people live alone in the UK?
ONS estimated 8.6 million solo dwellers in 2025, corresponding to 29.5% of households. That household percentage is not the share of all people who live alone. Older adults form a large part of the solo-living population.
| ID | Finding and qualification | Population, actual period and base | Original source and locator |
|---|---|---|---|
| F32 | 8.6 million people lived alone in the UK in 2025, equivalent to 29.5% of households, not 29.5% of the population. Definition: One usual resident; one person per one-person household. Qualification: The denominator for 29.5% is households; this does not measure relationship status. | People and households in private households; young-adult finding uses ages 20–34 United Kingdom April–June 2025 Labour Force Survey; 2015 comparisons Item/subgroup bases are not provided alongside these estimates. Overall report size is not the valid base for every item. | Office for National Statistics Published 2026-04-17 Bulletin sections 2–3; PDF pp.2–3. |
| F33 | The solo-living count was 7.7 million in 2015; ONS reported 10.7% count growth to 2025 but no significant increase after accounting for population growth. Definition: Published count comparison and source’s significance qualification. Qualification: Do not present the raw count rise as an unqualified statistically significant increase in solo prevalence. | People and households in private households; young-adult finding uses ages 20–34 United Kingdom 2015 and 2025 LFS April–June quarters Item/subgroup bases are not provided alongside these estimates. Overall report size is not the valid base for every item. | Office for National Statistics Published 2026-04-17 Section 3, people living alone. |
| F34 | 49.6% of solo dwellers were 65+ in 2025, versus 46.9% in 2015. Definition: Age composition of people who live alone. Qualification: Not 49.6% of all older people living alone. | People and households in private households; young-adult finding uses ages 20–34 United Kingdom 2015 and 2025 Item/subgroup bases are not provided alongside these estimates. Overall report size is not the valid base for every item. | Office for National Statistics Published 2026-04-17 Section 3, Figure 2. |
| F35 | Among solo dwellers 65+, 63.9% were female and 36.1% male in 2025. Definition: Sex composition within older solo dwellers. Qualification: Not the share of all older women/men who live alone. | People and households in private households; young-adult finding uses ages 20–34 United Kingdom April–June 2025 Labour Force Survey; 2015 comparisons Item/subgroup bases are not provided alongside these estimates. Overall report size is not the valid base for every item. | Office for National Statistics Published 2026-04-17 Section 3, paragraph after Figure 2. |
| F36 | 28.7% of adults 20–34 lived in their parents’ family in 2025, versus 25.4% in 2015; the 2025 shares were 34.9% for males and 22.3% for females. Definition: ONS family definition; people forming their own co-resident couple/parent family are excluded even in the same household. Qualification: Not a singlehood or financial-dependence measure; a nonresident romantic relationship can exist. | UK private-household adults 20–34 under ONS family definition United Kingdom 2015 and 2025 Item/subgroup bases are not provided alongside these estimates. Overall report size is not the valid base for every item. | Office for National Statistics Published 2026-04-17 Section 4 and Figure 3 notes. |
What does Canada’s census show about living alone?
Canada’s2021 census release reported 14.5% of people 15+ in private households living alone. The household share was 29.3%. These denominators answer different questions, and neither is a direct measure of romantic singlehood.
| ID | Finding and qualification | Population, actual period and base | Original source and locator |
|---|---|---|---|
| F37 | 4.4 million Canadians lived alone in 2021, representing 14.5% of people 15+ in private households. Definition: Person-level prevalence, including some 15–17-year-olds. Qualification: Not 14.5% of every Canadian or a strictly 18+ adult measure. | People 15+ in private households for overall solo prevalence; specified adult age groups and households use different denominators Canada 2021 Census; explicitly labeled historical comparisons Item/subgroup bases are not provided alongside these estimates. Overall report size is not the valid base for every item. | Statistics Canada Published 2022-07-13 Release indicator and Living solo? You’re not alone. |
| F38 | One-person households represented 29.3% of Canada’s households in 2021; the release notes a6% share in 1941. Definition: Share of households, not people. Qualification: The two denominators 14.5% people and 29.3% households are not contradictory; long-run count definitions/designs require care. | People 15+ in private households for overall solo prevalence; specified adult age groups and households use different denominators Canada 2021 Census;1941 historical context Item/subgroup bases are not provided alongside these estimates. Overall report size is not the valid base for every item. | Statistics Canada Published 2022-07-13 Highlights and Living solo? section. |
| F39 | Among people 35–44, living alone rose from 5% in 1981 to 10% in 2021. Definition: Within-age prevalence in private households. Qualification: Different cohorts and periods; not the same people followed for 40 years. | Canadians 35–44 in private households Canada 1981 and 2021 censuses Item/subgroup bases are not provided alongside these estimates. Overall report size is not the valid base for every item. | Statistics Canada Published 2022-07-13 Solo living is on the rise among younger adults; PDF p.5. |
| F40 | 42% of people 85+ in private households lived alone in 2021, compared with 7% of those 20–24. Definition: Within-age prevalence in private households. Qualification: Excludes collective/institutional dwellings; not 42% of every person 85+ in Canada. | Canadians in the specified adult age groups and private households Canada 2021 Census; explicitly labeled historical comparisons Item/subgroup bases are not provided alongside these estimates. Overall report size is not the valid base for every item. | Statistics Canada Published 2022-07-13 Solo living age discussion; PDF p.5. |
| F41 | 53% of women 85+ in private households lived alone in 2021, versus 60% in 2001. Definition: Within-age/sex prevalence, excluding collective dwellings. Qualification: Do not generalize to all women 65+ or every form of later-life living arrangement. | Canadian women 85+ in private households Canada 2001 and 2021 censuses Item/subgroup bases are not provided alongside these estimates. Overall report size is not the valid base for every item. | Statistics Canada Published 2022-07-13 Solo living older-women discussion; PDF p.5. |
| F42 | Solo-living prevalence among people 15+ was 19.0% in Quebec and 8.0% in Nunavut in 2021. Definition: Same person-level private-household age 15+ definition. Qualification: Age structure, housing and other composition differ; not a ranking of loneliness or singlehood preference. | People 15+ in private households for overall solo prevalence; specified adult age groups and households use different denominators Canada 2021 Census; explicitly labeled historical comparisons Item/subgroup bases are not provided alongside these estimates. Overall report size is not the valid base for every item. | Statistics Canada Published 2022-07-13 Geographic release indicators and Quebec still the leader section. |
Can someone live alone and still have a partner or family?
Yes. Statistics Canada’s2017 survey found that some solo dwellers had a romantic partner living elsewhere and many had previously lived as part of a couple or parented a child. These historical findings help explain the definition; they are not present-day Canadian preferences.
| ID | Finding and qualification | Population, actual period and base | Original source and locator |
|---|---|---|---|
| F43 | In 2017,72.2% of solo dwellers 20+ had previously lived in a married/common-law union, and 54.6% had parented a child. Definition: Usual solo residence does not mean lifelong absence of partners or children. Qualification: Some children may stay part-time; this is not a measure of never wanting family. Published uncertainty: Previously in co-resident union: 70.8 to 73.5 (Original-source 95% confidence interval); Has parented at least one child: 53.1 to 56.1 (Original-source 95% confidence interval). | Canadian non-institutionalized solo dwellers 20+, ten provinces Canada: ten provinces, not territories 2017 GSS Overall report n=19,902. Item/subgroup bases are not provided alongside these estimates. Overall report size is not the valid base for every item. | Statistics Canada Published 2019-03-06 Table 1, both-sexes 20+ column; published 95% intervals. |
| F44 | 16.5% of solo dwellers 20+ had a partner living elsewhere in 2017; the shares were 33.4% at 20–34 and 6.2% at 65+. Definition: Not married/cohabiting but in a couple with a person residing elsewhere. Qualification: Published 95% intervals retained. Living alone is not equivalent to no romantic relationship. Published uncertainty: LAT among solo dwellers 20+: 15.4 to 17.7 (Original-source 95% confidence interval); LAT among solo dwellers 20–34: 29.4 to 37.5 (Original-source 95% confidence interval); LAT among solo dwellers 65+: 5.2 to 7.3 (Original-source 95% confidence interval). | Canadian solo dwellers 20+ and age subgroups; ten provinces Canada: ten provinces, not territories 2017 GSS Overall report n=19,902. Item/subgroup bases are not provided alongside these estimates. Overall report size is not the valid base for every item. | Statistics Canada Published 2019-03-06 Table 2, living-apart-together, both-sexes columns. |
| F45 | Among unpartnered solo dwellers 20–34 in 2017,72.0% thought they could live common law in future and 59.7% intended to marry/remarry. Definition: Excludes married, cohabiting and living-apart-together respondents. Qualification: Intentions are not later outcomes or current 2027 preferences. Fertility intentions use different routing and are not combined here. Published uncertainty: Could live common law, 20–34: 66.8 to 76.4 (Original-source 95% confidence interval); Intends marry/remarry, 20–34: 54.5 to 64.7 (Original-source 95% confidence interval). | Canadian unpartnered solo dwellers 20–34; ten provinces Canada: ten provinces, not territories 2017 GSS Overall report n=19,902. Item/subgroup bases are not provided alongside these estimates. Overall report size is not the valid base for every item. | Statistics Canada Published 2019-03-06 Table 3, both-sexes 20–34 columns and note 1. |
How does Australia’s lone-person population differ by age and sex?
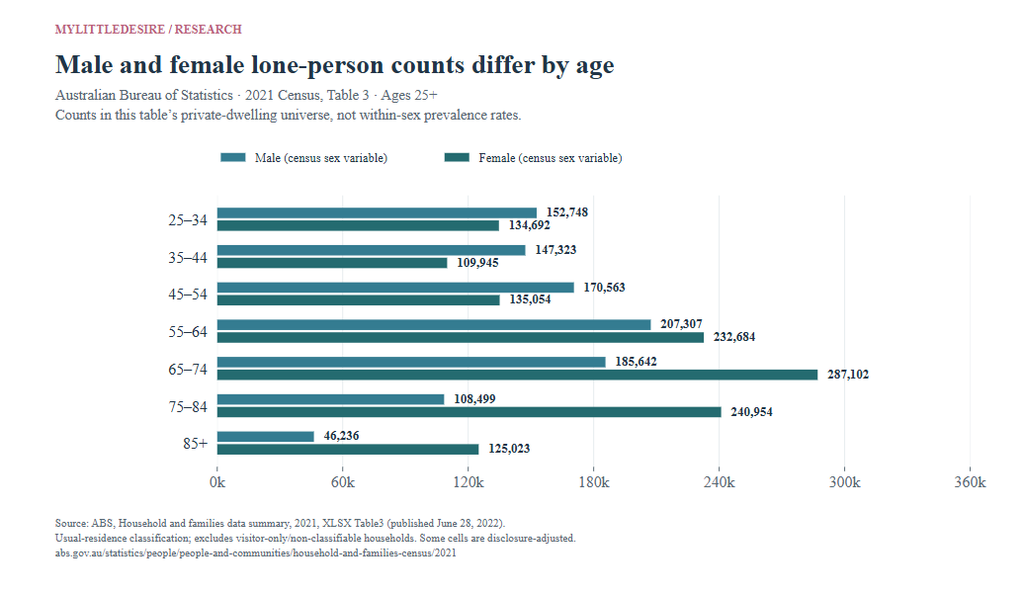
The ABS 2021 table shows more males than females among younger lone-person groups, with the pattern reversing in older groups. These are counts in a specific private-dwelling classification, rather than the probability that a person of a given sex lives alone.
| ID | Finding and qualification | Population, actual period and base | Original source and locator |
|---|---|---|---|
| F46 | ABS Table 3 identified 2,370,740 lone persons in its 2021 private-dwelling universe:1,061,225 males and 1,309,515 females. Definition: Specific usual-residence household-relationship table, not every single adult or one-person household. Qualification: Includes the 15–24 band, which contains some minors; visitor-only/non-classifiable households are excluded. Do not equate the total with a broader projection baseline. | Persons classified as lone persons in occupied private dwellings in this specific usual-residence table; charts use ages 25+ Australia 2021 Census Item/subgroup bases are not provided alongside these estimates. Overall report size is not the valid base for every item. | Australian Bureau of Statistics Published 2022-06-28 XLSX Table 3, cellsK 23, K39, K55 and notes 60–68. |
| F47 | At 25–34, lone-person counts were 152,748 males and 134,692 females; at 35–44 they were 147,323 and 109,945. Definition: Counts within each age/sex group in the stated table universe. Qualification: Counts are not within-sex solo-living rates; overall age/sex population sizes differ. | Persons classified as lone persons in occupied private dwellings in this specific usual-residence table; charts use ages 25+ Australia 2021 Census Item/subgroup bases are not provided alongside these estimates. Overall report size is not the valid base for every item. | Australian Bureau of Statistics Published 2022-06-28 Table 3, D23: E23 and D39: E39. |
| F48 | At 45–54, counts were 170,563 lone males and 135,054 lone females; at 55–64,207,307 and 232,684. Definition: Counts by age and census sex variable. Qualification: The change in composition between age bands does not identify an individual’s later living situation. | Persons classified as lone persons in occupied private dwellings in this specific usual-residence table; charts use ages 25+ Australia 2021 Census Item/subgroup bases are not provided alongside these estimates. Overall report size is not the valid base for every item. | Australian Bureau of Statistics Published 2022-06-28 Table 3, F23: G23 and F39: G39. |
| F49 | At 65–74, counts were 185,642 lone males and 287,102 lone females; at 75–84,108,499 and 240,954. Definition: Same table definition, two older age bands. Qualification: Not a count of widowed people alone; prior legal/romantic status is not established by this row. | Persons classified as lone persons in occupied private dwellings in this specific usual-residence table; charts use ages 25+ Australia 2021 Census Item/subgroup bases are not provided alongside these estimates. Overall report size is not the valid base for every item. | Australian Bureau of Statistics Published 2022-06-28 Table 3, H23: I23 and H39: I39. |
| F50 | At 85+, the table counted 46,236 lone males and 125,023 lone females. Definition: Private-dwelling lone-person counts, age 85+. Qualification: The female/male count ratio is not how much more likely an individual female is to live alone. | Persons classified as lone persons in occupied private dwellings in this specific usual-residence table; charts use ages 25+ Australia 2021 Census Item/subgroup bases are not provided alongside these estimates. Overall report size is not the valid base for every item. | Australian Bureau of Statistics Published 2022-06-28 Table 3, J23 and J39. |
Why do US household and adult-person percentages differ?
Census household counts produce a one-person share of 29.5% in 2025(C19). A separate Federal Reserve survey found 13% of adults lived alone. The units and eligible populations differ: one-person households account for one person each, while other households contain multiple people.
| ID | Finding and qualification | Population, actual period and base | Original source and locator |
|---|---|---|---|
| F51 | The 2025 CPS household table counted 39.741 million one-person households out of 134.790 million households. Definition: Original values 39,741 and 134,790 thousand households; calculated share appears as C19. Qualification: Not 39.741 million romantically single adults; count and population-weight basis differ from housing inventory totals. | Households; one-person counts are in thousands, not percentages of adults United States 2025 CPS ASEC Item/subgroup bases are not provided alongside these estimates. Overall report size is not the valid base for every item. | US Census Bureau Published December 2025; exact day not established HH-4 worksheet, 2025t row, cellsB 10: C10; numbers in thousands. |
| F52 | The 1960 row counted 6.917 million one-person households out of 52.799 million households. Definition: Historical same-row count/totals; share calculated in C20. Qualification: Not a harmonized causal comparison to 2025, and not a current singlehood rate. | Households; one-person counts are in thousands, not percentages of adults United States 1960 historical CPS row Item/subgroup bases are not provided alongside these estimates. Overall report size is not the valid base for every item. | US Census Bureau Published December 2025; exact day not established HH-4 worksheet, 1960 row, cellsB 78: C78; numbers in thousands. |
| F53 | 13% of US adults lived alone in 2025; among adults 60+, 20% did. Definition: Adult person-level prevalence, age 18+ overall. Qualification: Not the household share calculated from Census counts. Different surveys, units and eligible populations should not be pooled. | Adults 18+ overall n=12,934; age 60+ subgroup valid n unavailable United States 2025-10-17 to 2025-10-28 Overall report n=12,934. Published input bases: 12,934. Overall report size is not the valid base for every item. | Board of Governors of the Federal Reserve System Published May 2026; exact day not established Full report physical p.27 / printed p.23, Living Arrangements. |
What does unmarried-household research show about wealth?
| ID | Finding and qualification | Population, actual period and base | Original source and locator |
|---|---|---|---|
| F54 | Median household wealth was$82,100 for unmarried male heads and$58,100 for unmarried female heads in 2022. Definition: Household assets minus debts; unmarried, not necessarily without a partner. Qualification: Household medians are not individual salaries or all-single-adult wealth; children/age composition differ. | US households classified by unmarried head; cohabiting heads included;2022 nominal USD United States Net worth as of 2022-12-31;2023 SIPP Item/subgroup bases are not provided alongside these estimates. Overall report size is not the valid base for every item. | Pew Research Center Published 2024-11-04 Opening wealth comparison and methods box. |
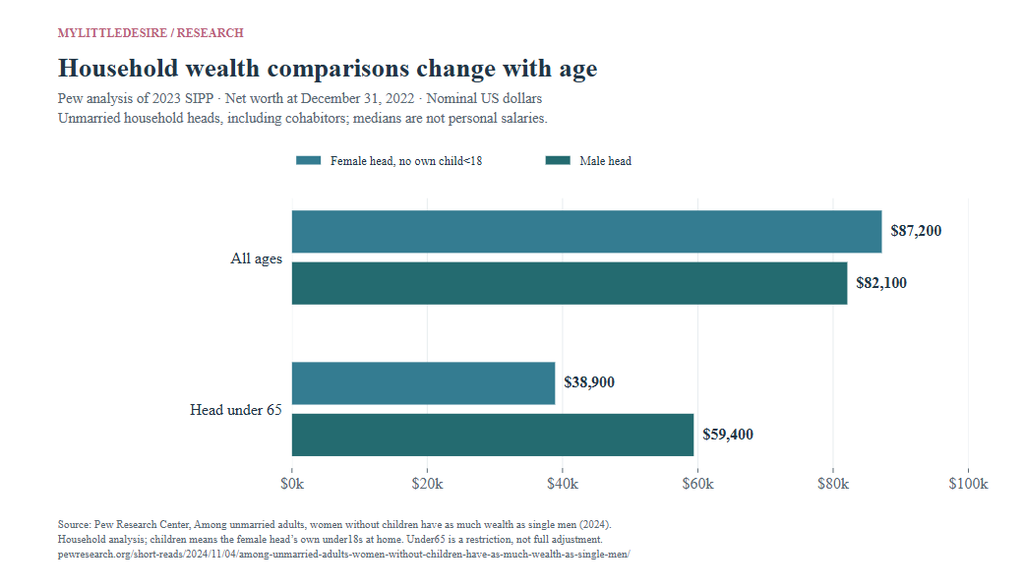
| F55 | Unmarried female-headed households without own children under 18 at home had median wealth$87,200; with children, $10,700. Definition: Children group is the female head’s own children under 18 in the household. Qualification: Without a child under 18 at home does not mean never a mother. The comparison is not an effect of parenting. | US households classified by unmarried head; cohabiting heads included;2022 nominal USD United States Net worth as of 2022-12-31;2023 SIPP Item/subgroup bases are not provided alongside these estimates. Overall report size is not the valid base for every item. | Pew Research Center Published 2024-11-04 Paragraph following methods. |
| F56 | Homeownership was 50% for unmarried female heads without own children under 18, 47% for unmarried male heads and 34% for unmarried mother heads. Definition: Share owning a home within each household-head group. Qualification: Not the groups’ shares of all homes; does not isolate age or income. | US households classified by unmarried head; cohabiting heads included;2022 nominal USD United States Net worth as of 2022-12-31;2023 SIPP Item/subgroup bases are not provided alongside these estimates. Overall report size is not the valid base for every item. | Pew Research Center Published 2024-11-04 Gaps in specific household assets: Home ownership. |
| F57 | Among homeowners, median home equity was$165,000 for unmarried female heads without own children under 18, $150,000 for male heads and$114,000 for mother heads. Definition: Conditional homeowner medians; equity is home value minus mortgage. Qualification: Not all households, home prices or average equity. Do not compare with the unconditional ownership rates as amounts. | US households classified by unmarried head; cohabiting heads included;2022 nominal USD United States Net worth as of 2022-12-31;2023 SIPP Item/subgroup bases are not provided alongside these estimates. Overall report size is not the valid base for every item. | Pew Research Center Published 2024-11-04 Gaps in specific household assets: Home equity. |
| F58 | Retirement-account ownership was 48% for unmarried female heads without own children under 18, 50% for male heads and 40% for mother heads. Definition: Household-head groups with an account such as 401(k) or IRA. Qualification: Not the percentage with adequate retirement savings or current workers enrolled. | US households classified by unmarried head; cohabiting heads included;2022 nominal USD United States Net worth as of 2022-12-31;2023 SIPP Item/subgroup bases are not provided alongside these estimates. Overall report size is not the valid base for every item. | Pew Research Center Published 2024-11-04 Gaps in specific household assets: Retirement account ownership. |
| F59 | Among retirement-account holders, median balances were$43,700 for unmarried female heads without own children under 18, $45,000 for male heads and$12,000 for mother heads. Definition: Conditional medians among account holders, not every household. Qualification: Not total wealth or a retirement target; current purchasing power is not estimated. | US households classified by unmarried head; cohabiting heads included;2022 nominal USD United States Net worth as of 2022-12-31;2023 SIPP Item/subgroup bases are not provided alongside these estimates. Overall report size is not the valid base for every item. | Pew Research Center Published 2024-11-04 Gaps in specific household assets: Retirement savings. |
| F60 | Below 65, median wealth was$38,900 for unmarried female heads without own children under 18 and$59,400 for male heads; overall median ages were 61 and 50. Definition: Under 65 wealth comparison; separate overall median-age profile. Qualification: Age restriction is not full age standardization or a causal effect. The overall median ages do not describe only the under 65 subset. | US households classified by unmarried head; cohabiting heads included;2022 nominal USD United States Net worth as of 2022-12-31;2023 SIPP Item/subgroup bases are not provided alongside these estimates. Overall report size is not the valid base for every item. | Pew Research Center Published 2024-11-04 How age contributes to wealth. |
20 transparent comparisons for writers and researchers
These calculations retain each source’s population and units. A difference in percentage points is not a percent growth rate; a ratio of counts is not a relative risk. Conditional household medians and survey preferences do not estimate an individual effect.
| ID | Comparison | Arithmetic and result | Source inputs and interpretation limit |
|---|---|---|---|
| C01 | US residence-based unpartnered share:2023 minus 2019 | 42 − 44 = -2.0 percentage points | F01 / F01 ACS definition, different years; not a change in self-identified relationship absence. |
| C02 | US unpartnered at 65+: women minus men | 51 − 29 = 22.0 percentage points | F04 / F04 Descriptive sex/age contrast; not a causal effect or loneliness difference. |
| C03 | US self-reported single at 18–29: men minus women | 63 − 34 = 29.0 percentage points | F10 / F10 Not a heterosexual partner-count imbalance or an all-Gen-Z estimate. |
| C04 | US singles looking: men minus women | 50 − 35 = 15.0 percentage points | F12 / F12 Within singles; includes casual dates and committed relationships. |
| C05 | US singles looking:2022 minus 2019 | 42 − 49 = -7.0 percentage points | F11 / F14 Source-described historical comparison; source wording changed slightly. |
| C06 | US single men looking:2022 minus 2019 | 50 − 61 = -11.0 percentage points | F12 / F14 Pew already describes this 11-point difference; reproduced arithmetic, not a new discovery. |
| C07 | US single women looking:2022 minus 2019 | 35 − 38 = -3.0 percentage points | F12 / F14 Pew reports no statistically significant change; −3 points is descriptive only. |
| C08 | US looking singles: commitment-only minus casual-only | 31 − 17 = 14.0 percentage points | F15 / F15 Conditional looking base; not the distribution among all singles. |
| C09 | GB happy with singlehood: women minus men | 63 − 50 = 13.0 percentage points | F21 / F21 Published happiness NETs; no new significance test or gender causation. |
| C10 | GB wants relationship now: men minus women | 27 − 20 = 7.0 percentage points | F24 / F24 Separate from happiness; no happy-but-looking overlap is identified. |
| C11 | GB home/routine control benefit: women minus men | 45 − 31 = 14.0 percentage points | F30 / F30 Choose-up-to-three benefit item; not prevalence of every experience. |
| C12 | GB missing practical support: women minus men | 22 − 10 = 12.0 percentage points | F31 / F31 Choose-up-to-three drawback item; no inference of actual support-network absence. |
| C13 | GB missing sex: men minus women | 23 − 10 = 13.0 percentage points | F31 / F31 Selected drawback, not sexual activity or clinical satisfaction rate. |
| C14 | Canada solo living 35–44: 2021 minus 1981 | 10 − 5 = 5.0 percentage points | F39 / F39 Historical within-age private-household shares; different cohorts, no causal effect. |
| C15 | Australia lone persons 25–34: male/female count ratio | 152,748 ÷ 134,692 = Approximately 1.13× | F47 / F47 Population count ratio, not relative probability of solo living; small disclosure adjustments. |
| C16 | Australia lone persons 85+: female/male count ratio | 125,023 ÷ 46,236 = Approximately 2.70× | F50 / F50 Count ratio in the specified table universe, not how much more likely a female is to live alone. |
| C17 | US unmarried household wealth: female no child<18 minus male, all ages | 87200 − 82100 = 5,100 US dollars | F55 / F54 Household medians; cohabiting heads included. Composition differs; not an individual effect. |
| C18 | US unmarried household wealth: female no child<18 minus male, under 65 | 38900 − 59400 = -20,500 US dollars | F60 / F60 Restricting to under 65 changes group composition; not full age adjustment or a causal loss. |
| C19 | US one-person household share, 2025 | 39,741 ÷ 134,790 ×100 = 29.5% (calculated) | F51 / F51 Matching CPS household counts in thousands; the unit cancels. Not a percentage of Americans. |
| C20 | US one-person household share, 1960 | 6,917 ÷ 52,799 ×100 = 13.1% (calculated) | F52 / F52 Matching historical household counts; not a current adult singlehood measure. |
Useful editorial comparisons: show current satisfaction beside current partner desire without inventing overlap; distinguish all singles from looking singles; compare the sex composition of Australia’s lone-person counts by age; and explain how an age restriction changes an unmarried-household wealth comparison. These are source-linked contrasts, not newly established causes.
Common questions about singles and singlehood
What percentage of Americans are single?
The 2022 Pew survey found 30% had no marriage, cohabiting partnership or committed relationship(F08). The 2023 residence-based analysis found 42% not living with a spouse or partner(F01). These are different definitions and years, not competing estimates of one identical population. Original source.
Do most singles want a relationship?
Not under every definition or time frame. In July 2022,57% of US singles were not currently looking(F11). In July 2026,24% of GB singles wanted a relationship now and 35% in the future but not now(F23). Different surveys and questions cannot form a cross-country preference ranking. Original source.
Can single people be happy and still want a partner?
Happiness with current status and desire for partnership are different questions. YouGov reported 57% happy and 24% wanting a relationship now, but the margins do not reveal the overlap. The source does not support a precise happy-but-looking percentage. Original source.
Does living alone mean someone is romantically single?
No. In the historical Canadian GSS,16.5% of solo dwellers 20+ had a partner living elsewhere(F44). Residence and romantic relationship status must be checked separately. Original source.
What share of US households has one person?
C19 calculates 29.5% in 2025 from 39,741 thousand one-person households divided by 134,790 thousand households. This is not 29.5% of Americans. The separate 2025 Federal Reserve estimate is 13% of adults(F53). Original source.
Are unmarried women wealthier than unmarried men?
There is no valid universal conclusion. In the 2022 household analysis, all unmarried female heads had median wealth$58,100 versus$82,100 for male heads(F54). Female heads without own children under 18 had$87,200 overall, but$38,900 below 65(F55,F60). Cohabiting heads are included, and household composition differs. Original source.
Methodology and limitations
How were the sources selected?
We prioritized accessible original surveys, government tables and original statistical analyses from Pew Research Center, YouGov, ONS, Statistics Canada, ABS, the US Census Bureau and the Federal Reserve. Findings were checked against the original wording, table or cell reference. Full source PDFs are not republished in the download.
What does 60 grouped findings mean?
It does not mean 60 independent studies. There are ten original-source analyses from seven publishing organizations. Pew contributes 23 findings from three different analyses; YouGov contributes 15 from one survey. Multiple questions, categories and subgroups can share participants. The Australian age profiles share one census table and are grouped for readability.
Which populations and periods are covered?
The resource covers US, Great Britain, UK, Canadian and Australian evidence. Main contemporary reference periods range from 2017 to 2026, alongside explicitly labeled historical census/CPS comparisons. Canadian overall census figures use 15+, whereas the GSS relationship findings use 20+. Australian charts use 25+ only. Countries and periods are not pooled into a global rate.
How were calculations handled?
C01–C20 use source-linked inputs. Percentage-point gaps, count ratios, dollar differences and calculated household shares have different units. We use readable rounding; we do not infer individual overlaps from separate margins or replace a published combined estimate with rounded subtraction. Seven published Canadian 95% intervals are retained; no intervals, significance tests or causal effects were newly calculated.
What is original about this resource?
MyLittleDesire selected the evidence, aligned useful measures, designed four charts and calculated transparent descriptive contrasts. Some differences were already apparent in or discussed by the original researchers. The contribution is convenient synthesis and presentation, not new fieldwork or a claim that all 20 calculations are novel discoveries.
What remains uncertain?
Exact eligible item/subgroup n and uncertainty are not always published beside figures. Unknowns remain blank in the data. The ABS table has a specific classification universe and disclosure-adjusted cells. Census household weights differ from housing inventory weights. Sample/design changes and age composition can affect historical comparisons. Cross-sectional differences cannot establish why someone is single or how their life will change.
How are neighboring topics kept distinct?
This hub focuses on relationship status, singlehood preferences, ordinary benefits/costs, solo living and the definition of unmarried-household finances. The Online Dating Hub covers app behavior in detail. The Loneliness Hub covers loneliness measures; living alone is not used as a loneliness diagnosis here.
What does 2027 mean?
2027 is the editorial edition, reviewed October 31,2026. It is not a fieldwork year, forecast or future publication date. Actual source publication and reference dates stay attached to findings. An edition-year change does not make an older estimate newly measured.
Related relationship research
For different forms of social connection, see Friendship Statistics. For legal union trends, see Marriage and Divorce Statistics. This resource keeps romantic status, living arrangements and preferences separate.
Complete original-source bibliography
- S01 · Pew Research Center. Share of US adults living without a romantic partner has ticked down in recent years.
Published 2025-01-08. Actual data: 2023 ACS; 2019 comparison.
Population: Adults 18+; education figures use adults 25+
Method: Original analysis of decennial census and American Community Survey microdata supplied by IPUMS. ACS samples more than three million addresses; exact analytic n for this analysis not printed. Unpartnered means no resident spouse or identified unmarried partner.
Limitations: Not a no-romantic-relationship measure. ACS identifies cohabitation involving the household head and misses some other cohabitors, slightly overstating unpartnered prevalence. 2020 ACS excluded for data-quality issues. No new inference tests or causal explanations. Secondary Federal Reserve figures quoted in this article are not treated as new Pew fieldwork.. Reviewed October 31, 2026. - S02 · Pew Research Center. For Valentine’s Day, 5 facts about single Americans.
Published 2023-02-08. Actual data: 2022-07-05 to 2022-07-17; selected 2019 comparisons.
Population: Adults 18+; n=6,034 overall, singles n=2,231, single-and-looking n=1,142
Method: ATP probability-based panel plus Ipsos KnowledgePanel LGB oversample, weighted to the US adult population. Original survey/topline/methods inspected. Overall 95% margin ±2.0 points; singles ±3.5; looking ±5.1. Looking men n=606/women n=519. Oversampling means raw n are not population proportions.
Limitations: Single excludes marriage, cohabitation and a committed romantic relationship. Looking and not-looking figures have different bases from all adults. Retain published NETs; do not calculate 100 minus a rounded percentage as a missing NET. 2019 not-looking wording differed slightly; do not claim significance for untested differences.
Supporting document 1; Supporting document 2. Reviewed October 31, 2026. - S03 · YouGov. Big Survey on Relationships: British singles.
Published 2026-08-17. Actual data: 2026-07-09 to 2026-07-10.
Population: GB adults 18+ n=1,882; not-currently-in-relationship group n=608 (weighted base 626); partnered group n=1,233
Method: Original weighted online-panel crosstabs; active sampling and demographic weighting described in YouGov methodology. Explicit question routing retained. Happiness NETs and under-40 combined estimate from the original published summary. Reasons are select-all; benefits/drawbacks allow up to three selections.
Limitations: Exact valid n for single gender/age subgroups not supplied in these crosstabs; the full-sample gender/age n are not valid subgroup n. Happiness and wanting a partner are separate marginal answers, not individual overlap. Reasons can coexist. “Never want a relationship” is a current response, not a realized lifetime outcome.
Supporting document 1; Supporting document 2; Supporting document 3. Reviewed October 31, 2026. - S04 · Office for National Statistics. Families and households in the UK: 2025.
Published 2026-04-17. Actual data: April–June 2025 Labour Force Survey; 2015 comparisons.
Population: People and households in private households; young-adult finding uses ages 20–34
Method: Original Labour Force Survey household-dataset estimates, April–June quarter each year, weighted to the household population. Bulletin and quality/method guide inspected. Exact achieved/item sample n and selected confidence intervals not printed beside the summary figures.
Limitations: 29.5% is a share of households, not people. Age/sex composition of solo dwellers is not within-age/sex prevalence. Lower recent achieved samples increase uncertainty. ONS says the solo-count increase was not significant after accounting for population increase. Parent-home measure excludes adults who form their own co-resident couple/parent family.
Supporting document 1; Supporting document 2. Reviewed October 31, 2026. - S05 · Statistics Canada. Home alone: More persons living solo than ever before, but roomies the fastest growing household type.
Published 2022-07-13. Actual data: 2021 Census; explicitly labeled historical comparisons.
Population: People 15+ in private households for overall solo prevalence; specified adult age groups and households use different denominators
Method: Original Census of Population analysis. Usual place of residence defines living alone. Exact 14.5% person prevalence and 29.3% household share appear in the original release. Census counts subject to disclosure control.
Limitations: Overall 15+ includes some minors and must not be labeled all adults 18+. Older-age estimates exclude collective dwellings such as institutional care. One-person households are not necessarily romantically single. Historical observations are not new 2027 data.
Supporting document 1. Reviewed October 31, 2026. - S06 · Statistics Canada. Living alone in Canada.
Published 2019-03-06. Actual data: 2017 General Social Survey on Family; historical relationship context.
Population: Non-institutionalized people 20+; overall eligible study group n=19,902, solo/item subsets smaller
Method: Original GSS analysis; survey overall n=20,602, response rate 52.4%; article 20+ eligible n=19,902. Person weights and bootstrap replicate weights used. Published 95% intervals in Tables 1–3 retained. No new intervals calculated.
Limitations: 2017 historical intentions and circumstances, not present Canadian preferences. Table 3 excludes married, cohabiting and living-apart-together respondents. Overall n must not be assigned to the solo/young nonpartnered subsets. Intentions do not establish later behavior.
Supporting document 1. Reviewed October 31, 2026. - S07 · Australian Bureau of Statistics. 2021 Census: Household and families data summary, Table 3.
Published 2022-06-28. Actual data: 2021 Census.
Population: Persons classified as lone persons in occupied private dwellings in this specific usual-residence table; charts use ages 25+
Method: Original XLSX Table 3, Relationship in household by age by sex, inspected at cell level. Counts use place of usual residence and exclude visitor-only and other non-classifiable households. Australian residents away on Census Night may appear in the visitor row rather than the lone-person row.
Limitations: These counts are not a total of all single Australians or every one-person household. Overall lone-person count includes the 15–24 band, including some minors; chart excludes that band. Counts compare population composition, not the probability of living alone within sex. Small random adjustments can prevent component cells matching independently adjusted totals.
Supporting document 1. Reviewed October 31, 2026. - S08 · US Census Bureau. Historical Households Table HH-4: Households by size, 1960 to present.
Published December 2025; exact day not established. Actual data: 2025 CPS ASEC and 1960 historical row.
Population: Households; one-person counts are in thousands, not percentages of adults
Method: Original XLS TableHH-4, row 2025t and row 1960, inspected. Census CPS March/ASEC household estimates use the householder person weight. C19/C20 calculate one-person shares using the matching all-household totals.
Limitations: 2025 vintage population estimates create a method component in 2024–2025 changes; no year-on-year demographic-growth claim is made. Counts differ from HVS housing-unit-weighted inventory estimates. Historical survey/design changes limit naïve long-run count comparisons.
Supporting document 1; Supporting document 2. Reviewed October 31, 2026. - S09 · Board of Governors of the Federal Reserve System. Report on the Economic Well-Being of US Households in 2025.
Published May 2026; exact day not established. Actual data: 2025-10-17 to 2025-10-28.
Population: Adults 18+ overall n=12,934; age 60+ subgroup valid n unavailable
Method: SHED online survey administered by Ipsos KnowledgePanel, probability-based address recruitment and weighting. Final analytic n=12,934 after exclusions. Original report survey description and living-arrangements chapter inspected.
Limitations: 13% of adults is not comparable as the same denominator to 29.5% of households. Living alone does not mean unpartnered, lonely or needing help. No causal or relationship-quality inference.
Supporting document 1. Reviewed October 31, 2026. - S10 · Pew Research Center. Among unmarried adults, women without children have as much wealth as single men.
Published 2024-11-04. Actual data: Net worth as of 2022-12-31;2023 SIPP.
Population: Households classified by unmarried head; includes cohabiting household heads. More than 17,000 households overall; exact eligible/item n not given.
Method: Original analysis of Census Bureau 2023 SIPP assets and liabilities. Wealth is household assets minus debts. Children means the female head’s own children under 18 in the household; homeowners/account holders are conditional subsets for balances.
Limitations: “Single” means unmarried here and includes cohabitors. These are household medians, not personal salaries or wealth of all romantically single adults. No child under 18 at home does not mean never a parent or a childfree identity. Age restriction is not full age standardization; no causal effect. Values are nominal 2022 US dollars.
How to cite this resource
MyLittleDesire. Singles & Singlehood Statistics 2027 https://mylittledesire.com/singles-singlehood-statistics/