Online relationships can provide companionship, confidence and support. They can also involve exclusion, abusive messages and bullying. This resource brings original research on those experiences together, with the population, question and time period kept beside every finding.
60 grouped findings from 13 original-source reports or research pages, with 170 numeric inputs, 20 transparent descriptive calculations and four MyLittleDesire charts. Nine publishing organizations contribute evidence. Two Australian publications share one survey, so the source count is not an independent-study count.
What are the key findings?
27%
44%
Of Snapchat teen users had experienced at least one of three harassment behaviors. Original source [S02].
Of Snapchat teen users said using it helped their friendships. Original source [S02].
79% vs. 65%
53% / 38%
Felt confident communicating online versus in person. Original source [S08].
Reported lifetime versus past-year cyberbullying. Original source [S09].
39%
12%
Described group-chat targeting in selected incident follow-ups. Original source [S09].
Said some friends stopped wanting to spend time together after the selected incident. Original source [S09].
46%
17.0% / 15.9%
Had ever experienced at least one of six online harassment behaviors. Original source [S01].
Reported electronic bullying with frequent versus less-frequent social-media use. Original source [S03].
22%
35%
Of already-bullied students reported online/text bullying. Original source [S04].
With a lot of friendship-making difficulty or unable to make friends reported cyberbullying. Original source [S06].
29%
69%
Of youth respondents felt very safe online. Original source [S07].
Reported using digital spaces to connect with others. Original source [S13].
Which statistics can be compared?
Start with the question, eligible population and recall window. The following measures answer different questions, even when they use the same percentage sign.
| Measure | What it measures | Boundary when quoting |
|---|---|---|
| Ever/lifetime experience | Whether a behavior has happened at any point. | Not a current-year rate. |
| Past-year or past-month experience | A specified retrospective window. | Nested in lifetime experience; differences do not measure recovery. |
| Broad harassment | A defined list of offensive, threatening or other behaviors. | May not require repeated aggression. |
| Cyberbullying | Each researcher’s operational definition. | Repetition, intent and power criteria vary. |
| Potentially uncomfortable contact | Requests, messages or group contact that may be unwanted. | Not every contact establishes bullying, illegality or experienced harm. |
| Platform-user prevalence | Experience among users of a particular site. | User groups overlap and have different composition/exposure. |
| Incident follow-up | Details of a selected most-recent/impactful experience. | Not the prevalence among all children or all incidents. |
| Adjusted prevalence ratio | Relative prevalence after specified adjustment. | Not a percentage-point gap, risk ratio over follow-up, or causal effect. |
| Confidence/connection | Reported social experiences or perceived benefits. | Not proof of safety or treatment effectiveness. |
Also Read:-
Couples Money Management Statistics 2027
Teen Friendship And Peer Support Statistics 2027
Couples Therapy and Counseling Statistics 2027
Sibling Relationship Statistics 2027
What do the newest platform comparisons show?
Pew’s April 2026 report surveyed teens in fall 2025. Snapchat users were more likely than Instagram or TikTok users to report measured harassment and perceived friendship benefits. Both findings matter, but neither proves that a particular platform caused the experience.
| ID | Finding and qualification | Population, actual period and base | Original source and locator |
|---|---|---|---|
| F07 | At least one of three harassment behaviors was reported by 27% of Snapchat users, 19% of Instagram users and 18% of TikTok users. Definition: Ever called a name, threatened physically or had rumors spread on that platform. Qualification: Each site’s user base differs and overlaps; this is not a randomized safety ranking. | Ages 13–17 living with parents; each platform’s own teen users United States 2025-09-25 to 2025-10-09 Overall report n=1,458. Published input bases: 772, 908, 996. Overall report size is not the valid base for every item. | Pew Research Center Published 2026-04-15 Report physical p.10, printed p.9; OH question batteries. Study methods and limitations |
| F08 | Rumors were reported by 18% of Snapchat users, 12% of Instagram users and 10% of TikTok users. Definition: Ever had someone spread rumors on the named site. Qualification: A component of the combined behavior measure, kept as one useful platform comparison. | Ages 13–17 living with parents; each platform’s own teen users United States 2025-09-25 to 2025-10-09 Overall report n=1,458. Published input bases: 772, 908, 996. Overall report size is not the valid base for every item. | Pew Research Center Published 2026-04-15 Report physical p.10; Topline in full report physical pp.41/44/47. Study methods and limitations |
| F09 | Reported friendship benefits were 44% on Snapchat, 36% on Instagram and 24% on TikTok. Definition: Helped a lot/a little combined by the publisher. Qualification: Rounded category sums can differ from combined estimates; use the published chart. Harassment and perceived benefit can coexist. | Ages 13–17 living with parents; each platform’s own teen users United States 2025-09-25 to 2025-10-09 Overall report n=1,458. Published input bases: 772, 908, 996. Overall report size is not the valid base for every item. | Pew Research Center Published 2026-04-15 Report physical p.8, printed p.7, Friendships chart. Study methods and limitations |
| F10 | Daily direct messaging was reported by 57% of Snapchat users, 34% of Instagram users and 24% of TikTok users. Definition: Several times a day or about once a day; combined published estimates. Qualification: Frequency is not friendship quality or proof of harmful exposure. | Ages 13–17 living with parents; each platform’s own teen users United States 2025-09-25 to 2025-10-09 Overall report n=1,458. Published input bases: 772, 908, 996. Overall report size is not the valid base for every item. | Pew Research Center Published 2026-04-15 Report physical p.6, printed p.5, NET daily. Study methods and limitations |
| F11 | Mostly positive experiences were reported by 68% on Snapchat, 68% on Instagram and 69% on TikTok; 3% on each said mostly negative. Definition: Overall appraisal, distinct from any specific adverse incident. Qualification: Positive/negative/mixed are not the same question as harassment history. | Ages 13–17 living with parents; each platform’s own teen users United States 2025-09-25 to 2025-10-09 Overall report n=1,458. Published input bases: 772, 908, 996. Overall report size is not the valid base for every item. | Pew Research Center Published 2026-04-15 Full report Topline physical pp.38,41,44: TIGEXP/TSCEXP/TTTEXP. Study methods and limitations |
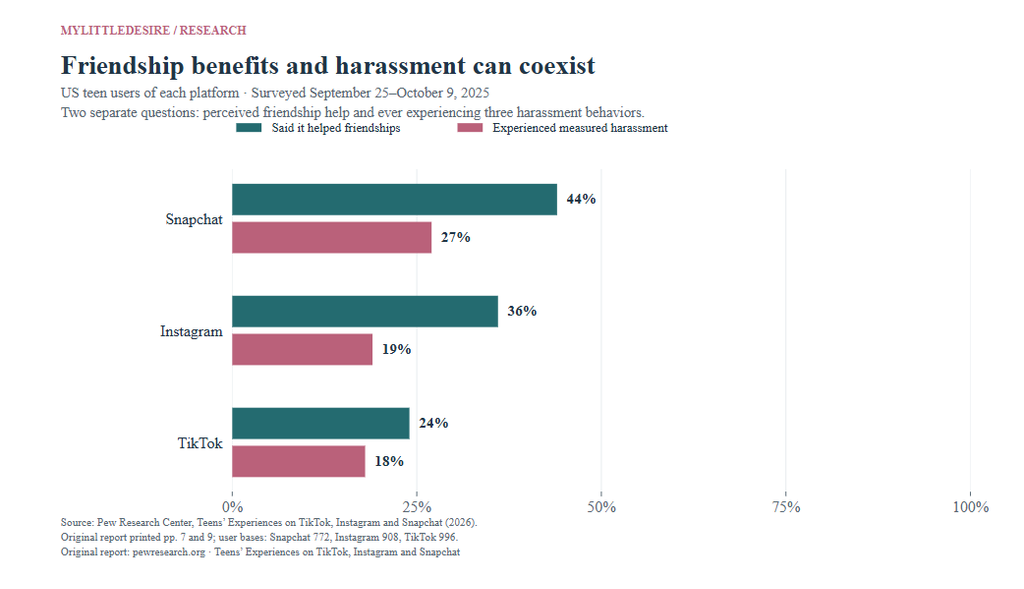
MyLittleDesire’s paired presentation makes two questions easier to inspect together. It does not identify how many respondents experienced both outcomes. Summing, subtracting or dividing the benefit and harassment percentages would not produce a valid individual net-benefit score.
How do online and in-person communication differ?
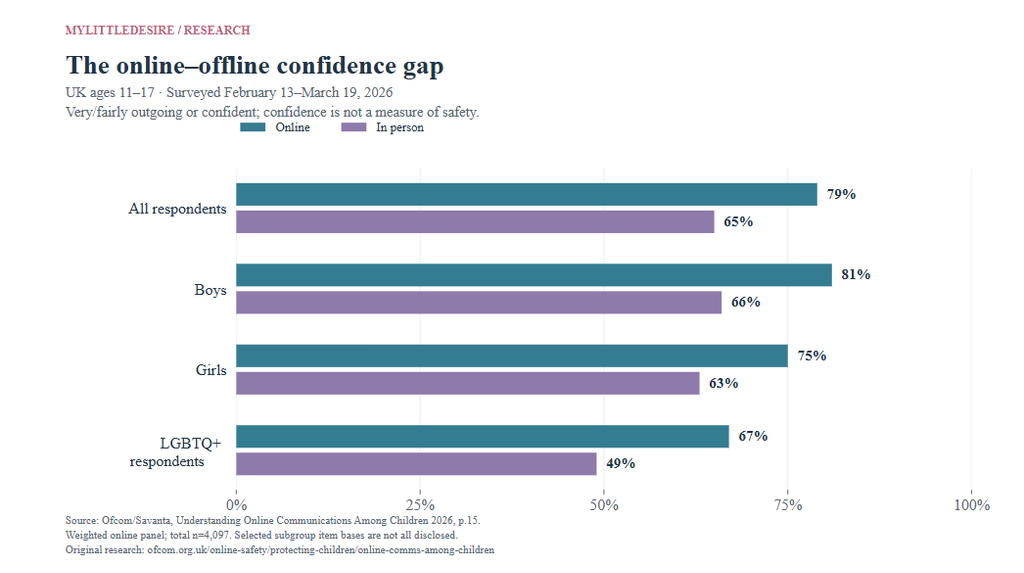
Ofcom’s 2026 survey found higher reported confidence online than in person. Its questions also show how children connect with familiar people and encounter unknown or unwanted contacts. Confidence, contact and cyberbullying are different measures.
| ID | Finding and qualification | Population, actual period and base | Original source and locator |
|---|---|---|---|
| F38 | 79% felt confident communicating online, compared with 65% in person. Definition: Very/fairly outgoing or confident combined. Qualification: Perceived confidence does not establish safety or social skill. | Ages 11–17 United Kingdom 2026-02-13 to 2026-03-19 Overall report n=4,097. Published input bases: 4,097. Overall report size is not the valid base for every item. | Ofcom / Savanta Published 2026-09-09 Report physical p.15, S17. Study methods and limitations |
| F39 | Boys’ confidence was 81% online versus 66% in person; girls’ was 75% versus 63%. Definition: Same confidence item in two settings. Qualification: No new statistical test of differences between these gaps. | Ages 11–17 United Kingdom 2026-02-13 to 2026-03-19 Overall report n=4,097. Published input bases: 1,972, 2,006. Overall report size is not the valid base for every item. | Ofcom / Savanta Published 2026-09-09 Report p.15, subgroup box; p.6 sample profile. Study methods and limitations |
| F40 | LGBTQ+ respondents’ confidence was 67% online versus 49% in person, compared with 80% and 66% for heterosexual/straight respondents. Definition: Publisher’s LGBTQ+ grouping retained. Qualification: Subgroup item bases absent from the displayed box; no causal or universal subgroup claim. | Ages 11–17 United Kingdom 2026-02-13 to 2026-03-19 Overall report n=4,097. Item/subgroup bases are not provided alongside these estimates. Overall report size is not the valid base for every item. | Ofcom / Savanta Published 2026-09-09 Report p.15, subgroup box. Study methods and limitations |
| F41 | Among connection-app users, 64% mainly connected with people known personally, 30% had a mixture and 6% mainly unknown contacts. Definition: Composition of online contacts. Qualification: Not a measure of abusive behavior or victimization. | Ages 11–17 United Kingdom 2026-02-13 to 2026-03-19 Overall report n=4,097. Published input bases: 3,836. Overall report size is not the valid base for every item. | Ofcom / Savanta Published 2026-09-09 Report p.16, A2A, base n=3,836. Study methods and limitations |
| F42 | 69% used platforms to interact with people already known, while 26% used them to meet people or connect around shared interests. Definition: Multiple-choice platform purposes. Qualification: Purpose categories overlap; gaming excluded from platform scope. | Ages 11–17 United Kingdom 2026-02-13 to 2026-03-19 Overall report n=4,097. Published input bases: 4,065. Overall report size is not the valid base for every item. | Ofcom / Savanta Published 2026-09-09 Report p.18, A3A, base n=4,065. Study methods and limitations |
| F43 | 67% used one-person direct messages and 59% used group direct messages. Definition: Reported communication channels. Qualification: Multiple answers; no ranking of channel safety. | Ages 11–17 United Kingdom 2026-02-13 to 2026-03-19 Overall report n=4,097. Published input bases: 4,065. Overall report size is not the valid base for every item. | Ofcom / Savanta Published 2026-09-09 Report p.19, A4, base n=4,065. Study methods and limitations |
| F44 | 64% of connection-app users received requests from someone never previously spoken/messaged to at least weekly; 14% at least daily. Definition: Request frequency, including people possibly known outside messaging. Qualification: Not every request is unwanted or malicious; daily is contained within weekly. | Ages 11–17 United Kingdom 2026-02-13 to 2026-03-19 Overall report n=4,097. Published input bases: 3,836. Overall report size is not the valid base for every item. | Ofcom / Savanta Published 2026-09-09 Report p.24, A70, base n=3,836. Study methods and limitations |
| F45 | 39% received unwanted requests, 32% were added to unfamiliar group chats, 25% received abusive messages and 22% received an impersonated friend request. Definition: Ever experienced selected potentially uncomfortable contacts. Qualification: Broader than cyberbullying; no requirement that every encounter caused harm. | Ages 11–17 United Kingdom 2026-02-13 to 2026-03-19 Overall report n=4,097. Published input bases: 4,065. Overall report size is not the valid base for every item. | Ofcom / Savanta Published 2026-09-09 Report p.31, B1; base n=4,065. Study methods and limitations |
For a separate form of digital interaction, see AI companion and digital relationship statistics. AI interactions are not included as human friendships in the comparisons here.
How common is cyberbullying in Australia?
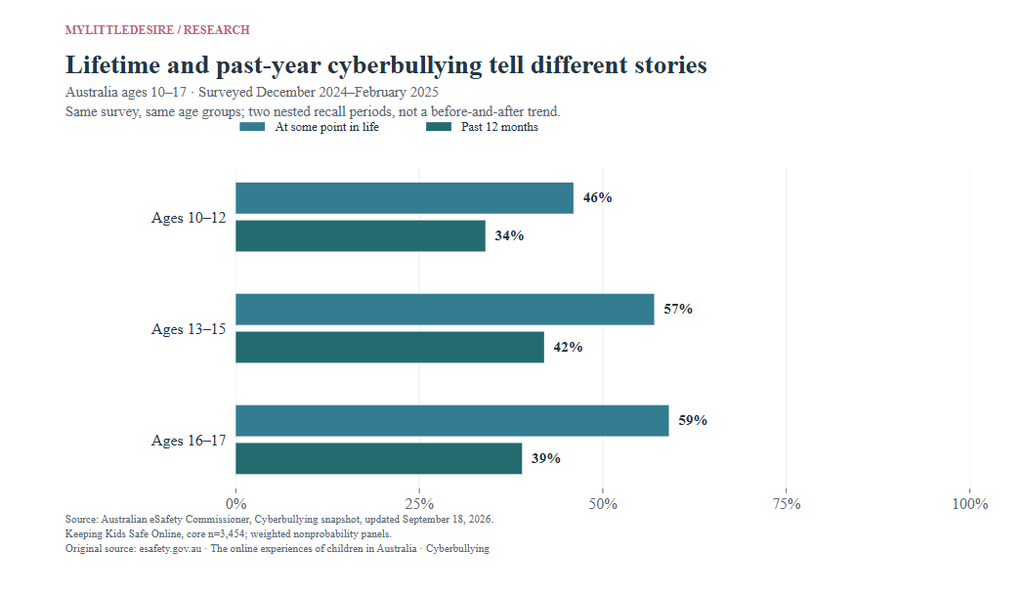
The eSafety survey measured both lifetime and past-year experience, before Australia’s social-media age restrictions took effect. The age profile changes with the recall window. Incident follow-ups describe a selected group of respondents, rather than all children.
| ID | Finding and qualification | Population, actual period and base | Original source and locator |
|---|---|---|---|
| F46 | 53% reported cyberbullying at some point and 38% in the previous year. Definition: Intentional acts intended to humiliate, upset or damage social acceptance. Qualification: Lifetime versus recent-period comparison, not falling incidence. | Ages 10–17; sexually diverse subgroup ages 13–17 only Australia 2024-12 to 2025-02; lifetime and preceding 12 months Overall report n=3,454. Published input bases: 3,454. Overall report size is not the valid base for every item. | Australian eSafety Commissioner Published 2026-09-18 Snapshot Cyberbullying experiences; notes 2–4, G.1.1/G.1.2. Study methods and limitations |
| F47 | Lifetime/past-year cyberbullying was 56%/40% for girls and 50%/35% for boys. Definition: Same two experience windows, separately by gender. Qualification: Weighted nonprobability estimates; no new significance tests. | Ages 10–17; sexually diverse subgroup ages 13–17 only Australia 2024-12 to 2025-02; lifetime and preceding 12 months Overall report n=3,454. Published input bases: 1,632, 1,739. Overall report size is not the valid base for every item. | Australian eSafety Commissioner Published 2026-09-18 Snapshot Girls are more likely than boys; methodology Table 1. Study methods and limitations |
| F48 | Lifetime/past-year cyberbullying was 46%/34% at ages 10–12, 57%/42% at 13–15 and 59%/39% at 16–17. Definition: Same survey and measures across three age groups. Qualification: The two teen age groups did not differ significantly for either window; do not claim an older-teen increase. | Ages 10–17; sexually diverse subgroup ages 13–17 only Australia 2024-12 to 2025-02; lifetime and preceding 12 months Overall report n=3,454. Item/subgroup bases are not provided alongside these estimates. Overall report size is not the valid base for every item. | Australian eSafety Commissioner Published 2026-09-18 Snapshot age chart/alt text; note7. Study methods and limitations |
| F49 | Trans/gender-diverse children reported 81% lifetime and 69% past-year cyberbullying; children with disability reported 63% and 47%. Definition: Published identity/disability group definitions. Qualification: Trans/gender-diverse n=83; the groups can overlap. Not a causal effect of identity or disability. | Ages 10–17; sexually diverse subgroup ages 13–17 only Australia 2024-12 to 2025-02; lifetime and preceding 12 months Overall report n=3,454. Published input bases: 83. Overall report size is not the valid base for every item. | Australian eSafety Commissioner Published 2026-09-18 Snapshot demographic findings; note5, methodology Tables1–2. Study methods and limitations |
| F50 | In selected incident follow-ups, 39% described group-chat targeting and 27% one-person messages, texts, emails or calls. Definition: Most recent or selected impactful incident; n=696 incident-follow-up sample. Qualification: Not percentages of all Australian children; multiple responses permitted. | Ages 10–17; sexually diverse subgroup ages 13–17 only Australia 2024-12 to 2025-02; lifetime and preceding 12 months Overall report n=3,454. Published input bases: 696. Overall report size is not the valid base for every item. | Australian eSafety Commissioner Published 2026-09-18 Snapshot Children are typically targeted…; notes8/14. Study methods and limitations |
| F51 | In those incident follow-ups, 48% reported at least one difficulty; 12% said friends stopped wanting to spend time together and 9% reported relationship friction/withdrawal. Definition: Respondents’ reported aftermath of a selected cyberbullying incident. Qualification: Not diagnosed outcomes or a causal estimate. The 9% category also includes arguments or reduced desire for company. | Ages 10–17; sexually diverse subgroup ages 13–17 only Australia 2024-12 to 2025-02; lifetime and preceding 12 months Overall report n=3,454. Published input bases: 696. Overall report size is not the valid base for every item. | Australian eSafety Commissioner Published 2026-09-18 Snapshot Difficulties figure/alt text; notes8/18. Study methods and limitations |
What benefits and safety practices do Australian children report?
The same Australian survey also asked about connection, interests and privacy practices. Those findings add context to the harm figures. They cannot be subtracted from cyberbullying prevalence to calculate a net benefit or the number of unharmed children.
| ID | Finding and qualification | Population, actual period and base | Original source and locator |
|---|---|---|---|
| F59 | 69% reported using digital spaces to connect with others; 80% used them to explore interests/hobbies and 72% for fun or relaxation. Definition: Reported uses/benefits of being online. Qualification: Same survey as the cyberbullying snapshot. These categories overlap and do not offset harm mathematically. | Ages 10–17 Australia 2024-12 to 2025-02 Overall report n=3,454. Item/subgroup bases are not provided alongside these estimates. Overall report size is not the valid base for every item. | Australian eSafety Commissioner Published 2026-06-17 Original agency report webpage Key findings, benefits bullet. Study methods and limitations |
| F60 | 71% reported limiting interactions to known people and 55% keeping personal information private. Definition: Self-reported proactive practices. Qualification: Not proof that these practices prevented cyberbullying or that the remaining respondents took no precautions. | Ages 10–17 Australia 2024-12 to 2025-02 Overall report n=3,454. Item/subgroup bases are not provided alongside these estimates. Overall report size is not the valid base for every item. | Australian eSafety Commissioner Published 2026-06-17 Original agency report webpage Key findings, safety-practices bullet. Study methods and limitations |
What did the broader US teen harassment survey measure?
Pew’s 2022 study asked all surveyed teens about six behaviors they had ever experienced online or by phone. It remains a useful benchmark with a broader definition than the newer three-platform study. Different questions and eligible populations prevent a direct trend comparison.
| ID | Finding and qualification | Population, actual period and base | Original source and locator |
|---|---|---|---|
| F01 | 46% of teens had ever experienced at least one of Pew’s six behaviors; 28% had experienced multiple types. Definition: Ever experienced the six specified online/cellphone behaviors. Qualification: Not a past-year or repeated-bullying prevalence. | Ages 13–17 living with parents United States 2022-04-14 to 2022-05-04; ever experienced Overall report n=1,316. Published input bases: 1,316. Overall report size is not the valid base for every item. | Pew Research Center Published 2022-12-15 Article opening for combined estimates; Topline physical p.2, printed p.22, TOH3 lists component items. Study methods and limitations |
| F02 | Reported behaviors included name-calling 32%, rumors 22%, unsolicited explicit images 17%, persistent questioning 15%, threats 10% and nonconsensual image sharing 7%. Definition: Six separately asked experiences. Qualification: Responses overlap; do not sum them. | Ages 13–17 living with parents United States 2022-04-14 to 2022-05-04; ever experienced Overall report n=1,316. Published input bases: 1,316. Overall report size is not the valid base for every item. | Pew Research Center Published 2022-12-15 Topline physical p.2, printed p.22, TOH3a–f. Study methods and limitations |
| F03 | Any measured harassment was reported by 54% of girls ages 15–17, 44% of boys ages 15–17 and 41% of both younger groups. Definition: Ever experienced any of the six behaviors; younger ages 13–14. Qualification: Cross-sectional age/gender groups, not individual growth. | Ages 13–17 living with parents United States 2022-04-14 to 2022-05-04; ever experienced Overall report n=1,316. Item/subgroup bases are not provided alongside these estimates. Overall report size is not the valid base for every item. | Pew Research Center Published 2022-12-15 Article Age and gender; original report demographic chart. Study methods and limitations |
| F04 | Online physical threats were reported by 16% below $30,000 household income versus 8% at $75,000 or more. Definition: Annual household income bands; US dollars. Qualification: Not an adjusted effect of income. | Ages 13–17 living with parents United States 2022-04-14 to 2022-05-04; ever experienced Overall report n=1,316. Item/subgroup bases are not provided alongside these estimates. Overall report size is not the valid base for every item. | Pew Research Center Published 2022-12-15 Article Age and gender, income paragraph. Study methods and limitations |
| F05 | Any harassment was reported by 53% of almost-constant internet users versus 40% of less-frequent users; multiple types were 37% versus 21%. Definition: Internet-use frequency, not social-media-only frequency. Qualification: Association, not evidence that additional screen time caused harassment. | Ages 13–17 living with parents United States 2022-04-14 to 2022-05-04; ever experienced Overall report n=1,316. Item/subgroup bases are not provided alongside these estimates. Overall report size is not the valid base for every item. | Pew Research Center Published 2022-12-15 Article internet-intensity paragraph. Study methods and limitations |
| F06 | Appearance was a perceived reason for harassment for 15% of all teens, compared with 31% when the base was harassment targets. Definition: Respondents’ attribution, not an independently verified perpetrator motive. Qualification: Different denominators; 31% is not a share of all teens. | Ages 13–17 living with parents United States 2022-04-14 to 2022-05-04; ever experienced Overall report n=1,316. Published input bases: 621, 1,316. Overall report size is not the valid base for every item. | Pew Research Center Published 2022-12-15 Article Reasons for being targeted; Topline physical p.2 TIDENTITYb (targets n=621) and physical p.3 all-teen rebasing. Study methods and limitations |
What does the May 2025 US student survey add?
The Cyberbullying Research Center provides a newer student survey using its own repeated, intentional-mistreatment definition. Its public page reports rounded approximations and limited design information, so we retain both those qualifications.
| ID | Finding and qualification | Population, actual period and base | Original source and locator |
|---|---|---|---|
| F58 | Approximately 58% of surveyed students reported lifetime cyberbullying and about 33% reported it in the preceding 30 days. Definition: Repeated, intentional digital mistreatment as defined by the researchers. Qualification: Published prose approximations retained. Representativeness not independently established from the methods disclosed on the page. | English/Spanish-speaking middle/high-school students ages 13–17 United States May 2025; lifetime and preceding 30 days Overall report n=3,466. Item/subgroup bases are not provided alongside these estimates. Overall report size is not the valid base for every item. | Cyberbullying Research Center / Patchin and Hinduja Published 2025-06-30 Original webpage Cyberbullying Victimization and Methodology. Study methods and limitations |
How is social-media frequency associated with electronic bullying?
The CDC analysis reports both raw prevalence and adjusted prevalence ratios. Overall, the raw frequent-use difference is 1.1 percentage points; the adjusted ratio is 1.54 after accounting for selected demographic variables. Those are different summaries of the same observational dataset and should not be substituted for one another.
| ID | Finding and qualification | Population, actual period and base | Original source and locator |
|---|---|---|---|
| F12 | 77.0% of high-school students reported social-media use at least several times daily (95% CI 73.5–80.1). Definition: Weighted frequent-use prevalence. Qualification: Not the fraction online almost constantly or a count of cyberbullying targets. Published uncertainty: Frequent social-media use: 73.5 to 80.1 (95% confidence interval). | Public/private high-school students in grades 9–12 United States, 50 states and District of Columbia 2023 YRBS; bullying in preceding 12 months Overall report n=20,103. Item/subgroup bases are not provided alongside these estimates. Overall report size is not the valid base for every item. | US Centers for Disease Control and Prevention Published 2024-10-10 Current corrected HTML Table 3, Overall. Study methods and limitations |
| F13 | For overall students, past-year electronic bullying was 17% with frequent social-media use versus 15.9% with less-frequent use; the adjusted prevalence ratio was 1.54. Definition: Frequent = at least several times a day; comparison includes nonusers and up-to-once-daily users. Qualification: Raw prevalence and adjusted ratio are different estimands. All original 95% CIs are retained. This observational association does not establish causation. Published uncertainty: overall: frequent use: 15.7 to 18.4 (95% confidence interval); overall: less-frequent use: 8.1 to 28.7 (95% confidence interval); overall: adjusted prevalence ratio: 1.26 to 1.88 (95% confidence interval). | Public/private high-school students in grades 9–12 United States, 50 states and District of Columbia 2023 YRBS; bullying in preceding 12 months Overall report n=20,103. Item/subgroup bases are not provided alongside these estimates. Overall report size is not the valid base for every item. | US Centers for Disease Control and Prevention Published 2024-10-10 Table 4, Electronically bullied row. Study methods and limitations |
| F14 | For female students, past-year electronic bullying was 21.5% with frequent social-media use versus 20% with less-frequent use; the adjusted prevalence ratio was 1.66. Definition: Frequent = at least several times a day; comparison includes nonusers and up-to-once-daily users. Qualification: Raw prevalence and adjusted ratio are different estimands. All original 95% CIs are retained. This observational association does not establish causation. Published uncertainty: female: frequent use: 19.7 to 23.5 (95% confidence interval); female: less-frequent use: 10 to 36.1 (95% confidence interval); female: adjusted prevalence ratio: 1.31 to 2.09 (95% confidence interval). | Public/private high-school students in grades 9–12 United States, 50 states and District of Columbia 2023 YRBS; bullying in preceding 12 months Overall report n=20,103. Item/subgroup bases are not provided alongside these estimates. Overall report size is not the valid base for every item. | US Centers for Disease Control and Prevention Published 2024-10-10 Table 5, Female, Electronically bullied row. Study methods and limitations |
| F15 | For male students, past-year electronic bullying was 12.2% with frequent social-media use versus 13% with less-frequent use; the adjusted prevalence ratio was 1.48. Definition: Frequent = at least several times a day; comparison includes nonusers and up-to-once-daily users. Qualification: Raw prevalence and adjusted ratio are different estimands. All original 95% CIs are retained. This observational association does not establish causation. Published uncertainty: male: frequent use: 10.7 to 13.8 (95% confidence interval); male: less-frequent use: 6.6 to 24 (95% confidence interval); male: adjusted prevalence ratio: 1.09 to 2 (95% confidence interval). | Public/private high-school students in grades 9–12 United States, 50 states and District of Columbia 2023 YRBS; bullying in preceding 12 months Overall report n=20,103. Item/subgroup bases are not provided alongside these estimates. Overall report size is not the valid base for every item. | US Centers for Disease Control and Prevention Published 2024-10-10 Table 5, Male, Electronically bullied row. Study methods and limitations |
| F16 | For LGBQ+ students, past-year electronic bullying was 25.5% with frequent social-media use versus 18.6% with less-frequent use; the adjusted prevalence ratio was 1.50. Definition: Frequent = at least several times a day; comparison includes nonusers and up-to-once-daily users. Qualification: Raw prevalence and adjusted ratio are different estimands. All original 95% CIs are retained. This observational association does not establish causation. Published uncertainty: LGBQ+: frequent use: 21.9 to 29.4 (95% confidence interval); LGBQ+: less-frequent use: 14.3 to 23.7 (95% confidence interval); LGBQ+: adjusted prevalence ratio: 1.14 to 1.99 (95% confidence interval). | Public/private high-school students in grades 9–12 United States, 50 states and District of Columbia 2023 YRBS; bullying in preceding 12 months Overall report n=20,103. Item/subgroup bases are not provided alongside these estimates. Overall report size is not the valid base for every item. | US Centers for Disease Control and Prevention Published 2024-10-10 Table 6, LGBQ+, Electronically bullied row. Study methods and limitations |
| F17 | For heterosexual students, past-year electronic bullying was 14.4% with frequent social-media use versus 8.6% with less-frequent use; the adjusted prevalence ratio was 1.55. Definition: Frequent = at least several times a day; comparison includes nonusers and up-to-once-daily users. Qualification: Raw prevalence and adjusted ratio are different estimands. All original 95% CIs are retained. This observational association does not establish causation. Published uncertainty: heterosexual: frequent use: 13.2 to 15.7 (95% confidence interval); heterosexual: less-frequent use: 6.8 to 10.8 (95% confidence interval); heterosexual: adjusted prevalence ratio: 1.24 to 1.94 (95% confidence interval). | Public/private high-school students in grades 9–12 United States, 50 states and District of Columbia 2023 YRBS; bullying in preceding 12 months Overall report n=20,103. Item/subgroup bases are not provided alongside these estimates. Overall report size is not the valid base for every item. | US Centers for Disease Control and Prevention Published 2024-10-10 Table 6, Heterosexual, Electronically bullied row. Study methods and limitations |
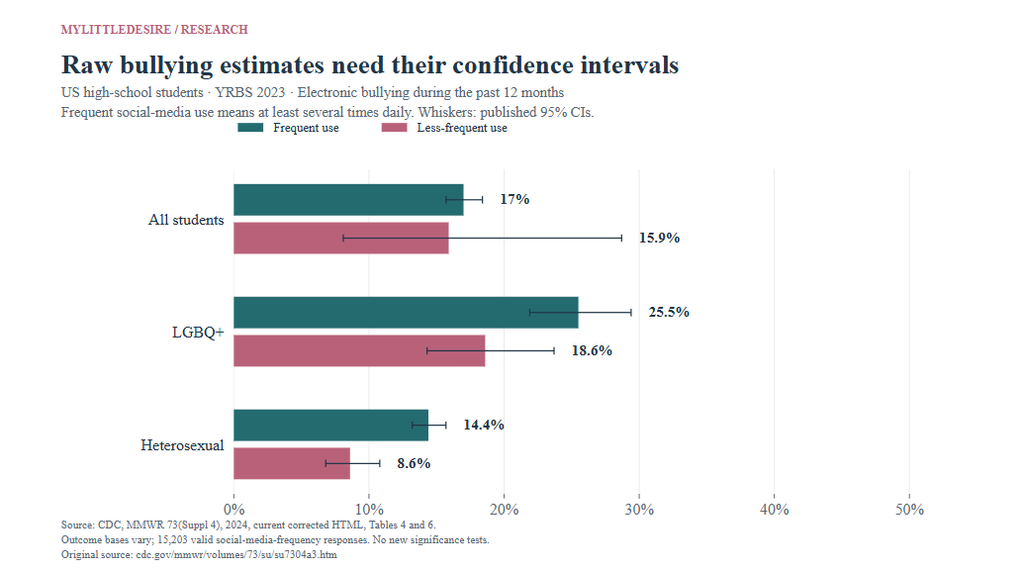
The raw male-student estimates run in the opposite direction from the adjusted association. That is a reason to retain adjustment details and confidence intervals, rather than select whichever figure sounds stronger. We do not calculate new significance tests or causal effects.
How does online bullying fit into school-related bullying?
NCES’s online-location results are conditional on students having reported school-related bullying. The family-and-friend impact estimates cover school-related bullying generally. Neither set can be quoted as a cyberbullying rate or effect for all US students.
| ID | Finding and qualification | Population, actual period and base | Original source and locator |
|---|---|---|---|
| F18 | 19% of students reported bullying during school; the estimates were 22% for female students and 17% for male students. Definition: Any school-related bullying during school year 2021–22. Qualification: Context only; not cyberbullying-only prevalence. | Students ages 12–18 in the School Crime Supplement; homeschool-only/virtual-only exclusions apply United States School year 2021–22; 2022 School Crime Supplement Item/subgroup bases are not provided alongside these estimates. Overall report size is not the valid base for every item. | US National Center for Education Statistics / Bureau of Justice Statistics Published 2024 Indicator Figure 1 and associated prose. Study methods and limitations |
| F19 | Among bullied students, 22% reported online/text bullying, compared with 39% in a classroom and 37% in hallways/stairwells. Definition: Locations among students who reported bullying. Qualification: Locations overlap; 22% is not a share of all students. | Students ages 12–18 in the School Crime Supplement; homeschool-only/virtual-only exclusions apply United States School year 2021–22; 2022 School Crime Supplement Item/subgroup bases are not provided alongside these estimates. Overall report size is not the valid base for every item. | US National Center for Education Statistics / Bureau of Justice Statistics Published 2024 Indicator Figure 4 and location paragraph. Study methods and limitations |
| F20 | Online/text bullying was reported by 28% of bullied female students versus 14% of bullied male students. Definition: Conditional on reported school-related bullying. Qualification: Cannot substitute these figures for all-female/all-male prevalence. | Students ages 12–18 in the School Crime Supplement; homeschool-only/virtual-only exclusions apply United States School year 2021–22; 2022 School Crime Supplement Item/subgroup bases are not provided alongside these estimates. Overall report size is not the valid base for every item. | US National Center for Education Statistics / Bureau of Justice Statistics Published 2024 Indicator Figure 5 and sex-comparison prose. Study methods and limitations |
| F21 | Among bullied students, 18% reported negative effects on family/friend relationships; the estimates were 23% female and 13% male. Definition: Reported effects somewhat or a lot. Qualification: All school-related bullying, not effects attributable solely to cyberbullying. | Students ages 12–18 in the School Crime Supplement; homeschool-only/virtual-only exclusions apply United States School year 2021–22; 2022 School Crime Supplement Item/subgroup bases are not provided alongside these estimates. Overall report size is not the valid base for every item. | US National Center for Education Statistics / Bureau of Justice Statistics Published 2024 Indicator Negative Effects; SCS Table 2.7. Study methods and limitations |
What can the international HBSC evidence tell us?
The WHO/HBSC study covers school students aged 11, 13 and 15 across participating European, central Asian and Canadian settings. We retain consistent sex-specific cybervictimization estimates. The report gives conflicting overall percentages, which we withhold. Its school-bullying measures use a stricter repetition threshold than its cyberbullying measures.
| ID | Finding and qualification | Population, actual period and base | Original source and locator |
|---|---|---|---|
| F22 | Cyberbullying victimization was reported by 15% of boys and 16% of girls across the HBSC participating settings. Definition: At least once/twice in the past couple of months. Qualification: Sex-specific estimates agree; the inconsistent overall percentage is withheld. Not a worldwide rate. | School students aged 11, 13 and 15 44 countries and regions in Europe, central Asia and Canada HBSC 2021/2022 cycle; national collection extends into 2023 Item/subgroup bases are not provided alongside these estimates. Overall report size is not the valid base for every item. | WHO Regional Office for Europe / HBSC Published 2024-03-27 Original PDF physical pp.8 and17, printed pp.vii and9. Study methods and limitations |
| F23 | Cyberbullying perpetration averaged 12% overall, including 14% of boys and 9% of girls. Definition: At least once/twice in the past couple of months. Qualification: A perpetration measure, not a victimization rate. | School students aged 11, 13 and 15 44 countries and regions in Europe, central Asia and Canada HBSC 2021/2022 cycle; national collection extends into 2023 Item/subgroup bases are not provided alongside these estimates. Overall report size is not the valid base for every item. | WHO Regional Office for Europe / HBSC Published 2024-03-27 Original PDF physical p.13, printed p.5. Study methods and limitations |
| F24 | 11% of boys and girls reported repeated school bullying victimization. Definition: School victimization at least two/three times a month. Qualification: Stricter repetition threshold than cyberbullying; no direct magnitude comparison. | School students aged 11, 13 and 15 44 countries and regions in Europe, central Asia and Canada HBSC 2021/2022 cycle; national collection extends into 2023 Item/subgroup bases are not provided alongside these estimates. Overall report size is not the valid base for every item. | WHO Regional Office for Europe / HBSC Published 2024-03-27 Original PDF physical p.8, printed p.vii. Study methods and limitations |
| F25 | Repeated school-bullying perpetration averaged 6% overall, including 8% of boys and 5% of girls. Definition: At least two/three times monthly in preceding couple of months. Qualification: Offline/school context; not a cyberbullying prevention-effect estimate. | School students aged 11, 13 and 15 44 countries and regions in Europe, central Asia and Canada HBSC 2021/2022 cycle; national collection extends into 2023 Item/subgroup bases are not provided alongside these estimates. Overall report size is not the valid base for every item. | WHO Regional Office for Europe / HBSC Published 2024-03-27 Original PDF physical p.11, printed p.3. Study methods and limitations |
How do friendship difficulties and parental awareness relate to cyberbullying?
Statistics Canada’s 2019 findings connect online victimization with friendship-making difficulty and parental awareness. These are unadjusted associations in historical survey data, not proof that monitoring or making friends will prevent abuse.
| ID | Finding and qualification | Population, actual period and base | Original source and locator |
|---|---|---|---|
| F26 | In 2019, 25% of ages 12–17 reported preceding-year cyberbullying: threats/insults 16%, exclusion 13% and hurtful information 9%. Definition: Any of three specified cybervictimization items. Qualification: Historical survey; overlapping experiences. | Ages 12–17; attraction questions only ages 15–17 Canada 2019 Canadian Health Survey on Children and Youth; preceding-year experiences Item/subgroup bases are not provided alongside these estimates. Overall report size is not the valid base for every item. | Statistics Canada / Darcy Hango Published 2023-02-21 Article One-quarter of teens; Chart 1 data table. Study methods and limitations |
| F27 | Past-year cybervictimization was reported by 52% of nonbinary youth, 25% of girls and 24% of boys. Definition: Gender categories as reported in the original analysis. Qualification: No inference about identity causing victimization; subgroup bases unavailable. | Ages 12–17; attraction questions only ages 15–17 Canada 2019 Canadian Health Survey on Children and Youth; preceding-year experiences Item/subgroup bases are not provided alongside these estimates. Overall report size is not the valid base for every item. | Statistics Canada / Darcy Hango Published 2023-02-21 Article One-quarter of teens; Table 1. Study methods and limitations |
| F28 | Among ages 15–17, cyberbullying was reported by 33% with same-gender attraction versus 26% exclusively attracted to a different gender. Definition: Attraction question only ages 15–17. Qualification: Do not apply to all ages 12–17 or treat attraction and gender identity as identical. | Ages 12–17; attraction questions only ages 15–17 Canada 2019 Canadian Health Survey on Children and Youth; preceding-year experiences Item/subgroup bases are not provided alongside these estimates. Overall report size is not the valid base for every item. | Statistics Canada / Darcy Hango Published 2023-02-21 Article paragraph following gender comparison; Table 1. Study methods and limitations |
| F29 | Cyberbullying was reported by 34% of First Nations youth living off reserve versus 24% of non-Indigenous youth. Definition: Selected youth covered by CHSCY. Qualification: Reserves/other Indigenous settlements excluded; not a figure for every Indigenous population. | Ages 12–17; attraction questions only ages 15–17 Canada 2019 Canadian Health Survey on Children and Youth; preceding-year experiences Item/subgroup bases are not provided alongside these estimates. Overall report size is not the valid base for every item. | Statistics Canada / Darcy Hango Published 2023-02-21 Article First Nations youth; Table 1. Study methods and limitations |
| F30 | Cyberbullying prevalence was 22% when parents were always/often aware of online activity versus 29% when sometimes/never aware. Definition: Youth prevalence grouped by parental awareness. Qualification: Observational association, not proof that monitoring prevents bullying. | Ages 12–17; attraction questions only ages 15–17 Canada 2019 Canadian Health Survey on Children and Youth; preceding-year experiences Item/subgroup bases are not provided alongside these estimates. Overall report size is not the valid base for every item. | Statistics Canada / Darcy Hango Published 2023-02-21 Article Potential protective factors; agency infographic Table 3. Study methods and limitations |
| F31 | Cyberbullying was reported by 23% with no friendship-making difficulty, 32% with some difficulty and 35% with a lot of difficulty/cannot make friends. Definition: Difficulty making friends as reported by parents. Qualification: Direction and confounding unresolved; not evidence that friendship difficulty causes online abuse. | Ages 12–17; attraction questions only ages 15–17 Canada 2019 Canadian Health Survey on Children and Youth; preceding-year experiences Item/subgroup bases are not provided alongside these estimates. Overall report size is not the valid base for every item. | Statistics Canada / Darcy Hango Published 2023-02-21 Article Youth who have difficulty making friends; agency infographic Table 4. Study methods and limitations |
What do Canadian youth say about online social life and safety?
Public Safety Canada surveyed youth aged 14–24 and a separate parent sample in 2024. The original report is essential: its online-safety headline counts those feeling very safe, and its positivity tables exclude respondents to whom an activity did not apply.
| ID | Finding and qualification | Population, actual period and base | Original source and locator |
|---|---|---|---|
| F32 | 35% of youth respondents used the internet for social interaction hourly or more often, and 55% several times daily. Definition: Canadian respondents ages 14–24; broad online social interaction. Qualification: Distinct frequency categories; not a teen-only sample. | Youth respondents ages 14–24; separate parents of children ages 10–24 Canada 2024-09-30 to 2024-10-14; selected comparable 2019/2022 waves Overall report n=801. Item/subgroup bases are not provided alongside these estimates. Overall report size is not the valid base for every item. | Public Safety Canada / Environics Research Published 2024-12-05 Original report I.3, Q3; government summary Table 1. Study methods and limitations |
| F33 | Totally/mostly positive experiences were 82% for messaging, 69% gaming and 60% social media; gaming was 57% in 2022. Definition: Positivity among respondents to whom each activity applied. Qualification: Does-not-apply responses excluded; activity bases differ. 2022/2024 are separate samples. | Youth respondents ages 14–24; separate parents of children ages 10–24 Canada 2024-09-30 to 2024-10-14; selected comparable 2019/2022 waves Overall report n=801. Item/subgroup bases are not provided alongside these estimates. Overall report size is not the valid base for every item. | Public Safety Canada / Environics Research Published 2024-12-05 Original report I.5, Q5, Experience of online social activities. Study methods and limitations |
| F34 | 29% of youth felt very safe online versus 33% in 2019; parent estimates were 14% versus 19%. Definition: Very safe, excluding does-not-apply; parents discuss children ages 10–24, youth respondents are 14–24. Qualification: The agency summary shortens this to safe, but original response intensity is essential. Separate populations; not matched disagreement. | Youth respondents ages 14–24; separate parents of children ages 10–24 Canada 2024-09-30 to 2024-10-14; selected comparable 2019/2022 waves Overall report n=801. Item/subgroup bases are not provided alongside these estimates. Overall report size is not the valid base for every item. | Public Safety Canada / Environics Research Published 2024-12-05 Original report I.1, Q1, Percent who say very safe. Study methods and limitations |
| F35 | 65% of youth and 51% of parents described themselves as very aware of cyberbullying. Definition: Awareness self-report. Qualification: Knowledge is not demonstrated competence; youth/parent samples have different eligibility. | Youth respondents ages 14–24; separate parents of children ages 10–24 Canada 2024-09-30 to 2024-10-14; selected comparable 2019/2022 waves Overall report n=801. Item/subgroup bases are not provided alongside these estimates. Overall report size is not the valid base for every item. | Public Safety Canada / Environics Research Published 2024-12-05 Original report II.1, Q6 youth/Q4 parents. Study methods and limitations |
| F36 | 69% learned about cyberbullying through school/teachers, 39% through affected friends/online contacts and 25% through personal experience. Definition: Reported sources of awareness; multiple answers. Qualification: Not a school-intervention success rate or current victimization estimate. | Youth respondents ages 14–24; separate parents of children ages 10–24 Canada 2024-09-30 to 2024-10-14; selected comparable 2019/2022 waves Overall report n=801. Item/subgroup bases are not provided alongside these estimates. Overall report size is not the valid base for every item. | Public Safety Canada / Environics Research Published 2024-12-05 Original report II.2, Q7; government summary Table 6. Study methods and limitations |
| F37 | 15% answered yes to having done something online that could be considered cyberbullying or where they were accused of it, versus 8% in 2019. Definition: Question includes respondents’ own behavior and accusations of cyberbullying; not independently established perpetration. Qualification: Not confirmed perpetration, a past-month rate or criminal offending. Recall and willingness to disclose can differ by wave. | Youth respondents ages 14–24; separate parents of children ages 10–24 Canada 2024-09-30 to 2024-10-14; selected comparable 2019/2022 waves Overall report n=801. Item/subgroup bases are not provided alongside these estimates. Overall report size is not the valid base for every item. | Public Safety Canada / Environics Research Published 2024-12-05 Original report V.1, Q24; government summary Table 7. Study methods and limitations |
Can online connection and exclusion occur together?
Pew’s 2024 survey, published in 2025, describes both feeling connected and feeling excluded. These experience questions overlap and do not all meet a cyberbullying definition. Our broader friendship resource covers friend counts and support networks in more depth.
| ID | Finding and qualification | Population, actual period and base | Original source and locator |
|---|---|---|---|
| F52 | 74% said social media made them feel more connected to friends’ lives. Definition: All-teen base, including nonusers, as published. Qualification: A subjective benefit item, not proof of clinical improvement. | Ages 13–17 living with parents United States 2024-09-18 to 2024-10-10; selected 2022 repeated cross-section Overall report n=1,391. Item/subgroup bases are not provided alongside these estimates. Overall report size is not the valid base for every item. | Pew Research Center Published 2025-04-22 Article Social media offers connection; SOC2POS. Study methods and limitations |
| F53 | 52% said social media provided support in tough times, down from 67% in the 2022 survey. Definition: Agreement with the support-experience item. Qualification: Different samples; not individual decline or evidence of causation. | Ages 13–17 living with parents United States 2024-09-18 to 2024-10-10; selected 2022 repeated cross-section Overall report n=1,391. Item/subgroup bases are not provided alongside these estimates. Overall report size is not the valid base for every item. | Pew Research Center Published 2025-04-22 Article Social media offers connection; SOC2POS. Study methods and limitations |
| F54 | 31% said social media made them feel excluded by friends; 39% felt overwhelmed by drama. Definition: Separate reported negative experiences. Qualification: Exclusion/drama does not automatically meet a cyberbullying definition. | Ages 13–17 living with parents United States 2024-09-18 to 2024-10-10; selected 2022 repeated cross-section Overall report n=1,391. Item/subgroup bases are not provided alongside these estimates. Overall report size is not the valid base for every item. | Pew Research Center Published 2025-04-22 Article Social media can also lead to…; SOC2NEG. Study methods and limitations |
For friend counts, friendship quality and support networks, see our friendship statistics resource. For prevalence and measurement of feeling lonely, see our loneliness statistics resource.
What does historical US adult research show?
Online harassment also affects adults. The following findings were collected in 2020 and are kept in a separate historical section. They are not measurements of current teen experience or 2027 prevalence.
| ID | Finding and qualification | Population, actual period and base | Original source and locator |
|---|---|---|---|
| F55 | 41% of US adults reported ever experiencing online harassment in 2020; 25% reported a more-severe form. Definition: Severe includes threats, stalking, sustained or sexual harassment. Qualification: Historical adult results, not teen or 2027 prevalence. | Adults age 18+ United States 2020-09-08 to 2020-09-13; ever experienced Overall report n=10,093. Item/subgroup bases are not provided alongside these estimates. Overall report size is not the valid base for every item. | Pew Research Center Published 2021-01-13 Article opening and Defining online harassment. |
| F56 | 64% of adults under 30 reported any online harassment, compared with 26% at age 50 or older. Definition: Ever experienced the report’s six behaviors. Qualification: Age comparison among adults; do not compare directly with a teen survey. | Adults age 18+ United States 2020-09-08 to 2020-09-13; ever experienced Overall report n=10,093. Item/subgroup bases are not provided alongside these estimates. Overall report size is not the valid base for every item. | Pew Research Center Published 2021-01-13 Article A majority of younger adults… |
| F57 | 75% of harassment targets said their most recent incident occurred on social media; Pew reported the equivalent as 31% of all adults. Definition: Most-recent-incident venue. Qualification: Different denominators; 75% does not mean three-quarters of all adults were harassed there. | Adults age 18+ United States 2020-09-08 to 2020-09-13; ever experienced Overall report n=10,093. Item/subgroup bases are not provided alongside these estimates. Overall report size is not the valid base for every item. | Pew Research Center Published 2021-01-13 Article opening, harassment venue paragraph. |
What comparisons does MyLittleDesire contribute?
These calculations put selected published aggregates into a reusable format. The contribution is arithmetic, curation and presentation. Some underlying contrasts are already discussed by the researchers; these are not 20 new scientific discoveries.
| ID | Comparison | Arithmetic | Result | Findings | Interpretation limit |
|---|---|---|---|---|---|
| C01 | Overall online-versus-in-person confidence gap | 79 − 65 | 14.0 percentage points | F38 / F38 | Same survey and confidence item, different settings. Descriptive difference; no new significance test or proof of online safety. |
| C02 | Boys: online-versus-in-person confidence gap | 81 − 66 | 15.0 percentage points | F39 / F39 | Same survey and confidence item, different settings. Descriptive difference; no new significance test or proof of online safety. |
| C03 | Girls: online-versus-in-person confidence gap | 75 − 63 | 12.0 percentage points | F39 / F39 | Same survey and confidence item, different settings. Descriptive difference; no new significance test or proof of online safety. |
| C04 | LGBTQ+: online-versus-in-person confidence gap | 67 − 49 | 18.0 percentage points | F40 / F40 | Same survey and confidence item, different settings. Descriptive difference; no new significance test or proof of online safety. |
| C05 | Platform harassment gap: Snapchat minus Instagram | 27 − 19 | 8.0 percentage points | F07 / F07 | Overlapping, differently composed platform-user samples; uncontrolled descriptive contrast, not a causal platform effect. |
| C06 | Platform harassment gap: Snapchat minus TikTok | 27 − 18 | 9.0 percentage points | F07 / F07 | Overlapping, differently composed platform-user samples; uncontrolled descriptive contrast, not a causal platform effect. |
| C07 | Perceived friendship-benefit gap: Snapchat minus TikTok | 44 − 24 | 20.0 percentage points | F09 / F09 | Overlapping, differently composed platform-user samples; uncontrolled descriptive contrast, not a causal platform effect. |
| C08 | Overall: lifetime minus past-year cyberbullying | 53 − 38 | 15.0 percentage points | F46 / F46 | Nested recall windows in one cross-sectional survey. Not a decline, recovery rate or measure of cessation. |
| C09 | Ages10–12: lifetime minus past-year cyberbullying | 46 − 34 | 12.0 percentage points | F48 / F48 | Nested recall windows in one cross-sectional survey. Not a decline, recovery rate or measure of cessation. |
| C10 | Ages13–15: lifetime minus past-year cyberbullying | 57 − 42 | 15.0 percentage points | F48 / F48 | Nested recall windows in one cross-sectional survey. Not a decline, recovery rate or measure of cessation. |
| C11 | Ages16–17: lifetime minus past-year cyberbullying | 59 − 39 | 20.0 percentage points | F48 / F48 | Nested recall windows in one cross-sectional survey. Not a decline, recovery rate or measure of cessation. |
| C12 | Past-year Australian gender gap: girls minus boys | 40 − 35 | 5.0 percentage points | F47 / F47 | Same survey; rounded estimates. No new significance test. |
| C13 | Overall: raw bullying-prevalence gap, frequent minus less-frequent use | 17 − 15.9 | 1.1 percentage points | F13 / F13 | Raw weighted percentage-point contrast. Not an adjusted effect; use the source’s separately reported adjusted ratio and original confidence intervals. |
| C14 | Female students: raw bullying-prevalence gap, frequent minus less-frequent use | 21.5 − 20 | 1.5 percentage points | F14 / F14 | Raw weighted percentage-point contrast. Not an adjusted effect; use the source’s separately reported adjusted ratio and original confidence intervals. |
| C15 | Male students: raw bullying-prevalence gap, frequent minus less-frequent use | 12.2 − 13 | -0.8 percentage points | F15 / F15 | Raw weighted percentage-point contrast. Not an adjusted effect; use the source’s separately reported adjusted ratio and original confidence intervals. |
| C16 | LGBQ+ students: raw bullying-prevalence gap, frequent minus less-frequent use | 25.5 − 18.6 | 6.9 percentage points | F16 / F16 | Raw weighted percentage-point contrast. Not an adjusted effect; use the source’s separately reported adjusted ratio and original confidence intervals. |
| C17 | Heterosexual students: raw bullying-prevalence gap, frequent minus less-frequent use | 14.4 − 8.6 | 5.8 percentage points | F17 / F17 | Raw weighted percentage-point contrast. Not an adjusted effect; use the source’s separately reported adjusted ratio and original confidence intervals. |
| C18 | Canadian gaming positivity: 2024 minus 2022 | 69 − 57 | 12.0 percentage points | F33 / F33 | Different weighted nonprobability samples. Does-not-apply answers excluded; not individual improvement. |
| C19 | Canadian youth feeling very safe online: 2024 minus 2019 | 29 − 33 | -4.0 percentage points | F34 / F34 | Very-safe response only; different survey samples and excluded does-not-apply responses. Not all safety responses combined. |
| C20 | Canadian messaging minus social-media positivity | 82 − 60 | 22.0 percentage points | F33 / F33 | Respondents to whom each activity applies; bases differ. Descriptive response-rate contrast, not an individual net-benefit estimate. |
How was this research assembled and checked?
We selected original survey publications and government statistical resources relevant to cyberbullying and online social relationships in the US, UK, Canada and Australia. WHO/HBSC adds a wider school-age context. We checked source definitions, dates, populations, original tables and accessible study methods. PDF references use physical page numbers when needed to locate a table.
The 60 entries are grouped findings. A response distribution, related age comparison or set of platform estimates remains one finding. The 170 numeric inputs support those entries and do not represent 170 independent studies. S09 and S13 describe the same Australian core survey; agency summaries are not counted as additional fieldwork.
MyLittleDesire conducted no new survey or microdata analysis. We calculated 20 differences from published aggregates, rounded results to one decimal percentage point, and retained original confidence intervals for the CDC estimates. We did not invent missing subgroup bases, fit new adjusted models or test new differences for statistical significance.
ESafety’s original webpages and methodology were accessible through public web retrieval, while direct local downloads returned 503 responses. Tracker release was identified, but its item-level data were not reanalyzed for this resource. The bibliography is a selected evidence inventory, not a census of every relevant publication.
What source discrepancies were withheld or clarified?
WHO’s report gives inconsistent overall cybervictimization percentages in its summary and main text. We withhold that total while retaining the consistent sex-specific estimates. Public Safety Canada’s summary simplifies a very-safe response to safe; we use the original wording and original survey age range. We also avoid Ofcom’s inconsistent displayed in-person-shyness total and an acceptance-factor base discrepancy.
What limits the conclusions?
- Self-report, recall, survey nonresponse and social-desirability bias can affect estimates.
- Weighted online-panel samples remain nonprobability samples where the methods say so. Demographic balance does not eliminate selection bias.
- Unknown or small item/subgroup bases limit precision. The original Australian trans/gender-diverse subgroup contains 83 respondents.
- Different countries, age groups, questions and recall periods cannot be combined into a defensible global league table.
- Association, perceived benefit and reported aftermath do not establish causal effects or clinical diagnoses.
- Actual study dates travel with the statistic. An edition title does not turn older findings into 2027 measurements.
What should publishers check before citing?
What percentage of teens experience cyberbullying?
There is no single interchangeable figure. Pew’s 2022 all-teen six-behavior measure, Pew’s newer three-platform-user measure and the Australian lifetime/past-year measures use different questions and populations.
Does Snapchat’s comparison establish that it causes more harassment?
No. Its users differ from other platform users, exposure intensity differs, and users overlap. The comparison is descriptive, even though the original researchers report platform differences.
Can online friendship benefits cancel out cyberbullying?
No. Benefits and harm can affect the same person. Separate marginal percentages do not identify individual overlap or an acceptable level of harm.
Does a lifetime-minus-year gap show recovery?
No. Different nested recall windows are not a longitudinal recovery study or a before-and-after intervention.
Why can raw and adjusted CDC results differ?
The adjusted model accounts for selected demographic differences, whereas raw percentages summarize observed weighted groups. Their estimands differ. Both retain uncertainty and neither proves causation.
Does NCES’s online-location percentage apply to all students?
No. It applies to students who already reported school-related bullying. Keep that conditional denominator in the quoted sentence.
Where should readers verify a statistic?
Use the linked original source and the locator beside the finding. The downloadable research data retain definitions, dates, samples, uncertainty and caveats.
Complete original-source bibliography
- S01 · Teens and Cyberbullying 2022Pew Research Center · Published 2022-12-15 · Actual period: 2022-04-14 to 2022-05-04; ever experienced. Population: Ages 13–17 living with parents. Overall report sample: 1,316.Method: Ipsos KnowledgePanel probability-panel recruitment through parents; English/Spanish online survey, weighted to US teens living with parents.Limits: Six-behavior ever measure includes harassment. No frequency threshold for the combined prevalence. Not directly comparable with Pew 2018 or the three-item, platform-user 2025 survey. Subgroup bases not attached to the selected prose estimates.Supporting original document 1 · Supporting original document 2
- S02 · Teens’ Experiences on TikTok, Instagram and SnapchatPew Research Center · Published 2026-04-15 · Actual period: 2025-09-25 to 2025-10-09. Population: Ages 13–17 living with parents; each platform’s own teen users. Overall report sample: 1,458.Method: Ipsos KnowledgePanel probability-based parent–teen survey. Platform-user bases: Snapchat 772, Instagram 908, TikTok 996. Overall teen margin of error ±3.3 points, platform margins ±4.5/4.2/4.0 respectively.Limits: Platform users overlap and are not randomized or matched exposure groups. Harassment asks ever experienced three behaviors on each platform; different from S01. Benefits, overall experience and victimization are separate questions. Combined estimates use the publisher’s chart rather than sums of independently rounded categories.Supporting original document 1 · Supporting original document 2
- S03 · Frequent Social Media Use and Experiences with Bullying Victimization, Persistent Feelings of Sadness or Hopelessness, and Suicide Risk Among High School Students — Youth Risk Behavior Survey, United States, 2023US Centers for Disease Control and Prevention · Published 2024-10-10 · Actual period: 2023 YRBS; bullying in preceding 12 months. Population: Public/private high-school students in grades 9–12. Overall report sample: 20,103.Method: Weighted complex school sample. Frequent use = at least several times a day. Taylor-linearized confidence intervals; predicted-marginal adjusted prevalence ratios account for age, race/ethnicity, sex and sexual identity, except the stratifying variable. Current corrected HTML tables were checked.Limits: 4,900 missing social-media answers; 15,203 valid frequency answers (11,872 frequent, 3,331 less frequent). Outcome-specific bases vary. Cross-sectional associations cannot show causation. LGBQ+ is sexual identity, not a combined transgender category. Raw proportions and adjusted ratios answer different questions.Supporting original document 1
- S04 · Condition of Education: Student BullyingUS National Center for Education Statistics / Bureau of Justice Statistics · Published 2024 · Actual period: School year 2021–22; 2022 School Crime Supplement. Population: Students ages 12–18 in the School Crime Supplement; homeschool-only/virtual-only exclusions apply. Overall report sample: Not supplied for the selected analysis/items.Method: National Crime Victimization Survey School Crime Supplement, weighted estimates. The indicator combines overall school-related bullying, locations and reported negative effects.Limits: Online-location and impact estimates are conditional on having been bullied during school, not percentages of all students or cyberbullying-only victims. Missing location answers excluded. Selected item bases are not given alongside indicator prose.Supporting original document 1 · Supporting original document 2 · Supporting original document 3
- S05 · A focus on adolescent peer violence and bullying in Europe, central Asia and Canada. Health Behaviour in School-aged Children international report from the 2021/2022 survey. Volume 2WHO Regional Office for Europe / HBSC · Published 2024-03-27 · Actual period: HBSC 2021/2022 cycle; national collection extends into 2023. Population: School students aged 11, 13 and 15. Overall report sample: Not supplied for the selected analysis/items.Method: School-based HBSC surveys; international report and original measures table checked. Cyberbullying uses at least once/twice in the past couple of months; school bullying uses at least two/three times a month.Limits: More than 279,000 respondents across the cycle, not a worldwide all-age sample. Exact item bases not supplied next to selected summaries. Overall victimization conflicts: 15% on physical p.8 versus 16% on physical p.17; withheld. Sex-specific 15% boys/16% girls agree. Different repetition thresholds prevent a direct cyber-versus-school prevalence comparison.Supporting original document 1
- S06 · Online harms faced by youth and young adults: The prevalence and nature of cybervictimization Statistics Canada / Darcy Hango · Published 2023-02-21 · Actual period: 2019 Canadian Health Survey on Children and Youth; preceding-year experiences. Population: Ages 12–17; attraction questions only ages 15–17. Overall report sample: Not supplied for the selected analysis/items.Method: Original Statistics Canada analysis of population survey data. Only the CHSCY youth results are used here; its separate young-adult survey results are not pooled with them.Limits: Historical 2019 measurements. Three-item cybervictimization definition. Unadjusted group comparisons do not show causal effects. First Nations findings exclude reserves/other Indigenous settlements. Exact selected analytic/subgroup bases not supplied with the cited summaries.Supporting original document 1
- S07 · Cyberbullying Public Awareness Research 2024, final reportPublic Safety Canada / Environics Research · Published 2024-12-05 · Actual period: 2024-09-30 to 2024-10-14; selected comparable 2019/2022 waves. Population: Youth respondents ages 14–24; separate parents of children ages 10–24. Overall report sample: 801.Method: Two weighted nonprobability online surveys: 801 youth and 604 parents, with age/gender/region quotas. No probability-sampling margin of error. Original report and questionnaires checked through the archive’s ordinary Continue destination.Limits: Individual valid bases vary; the government summary reports youth n=790–801 and parents n=600–604 for selected items. Activity-positivity and safety tables exclude does-not-apply responses. Safety means very safe, not any feeling of safety. Separate youth and parent samples have different age eligibility. Cross-sections are not individual change.Supporting original document 1
- S08 · Understanding Online Communications Among Children 2026Ofcom / Savanta · Published 2026-09-09 · Actual period: 2026-02-13 to 2026-03-19. Population: Ages 11–17. Overall report sample: 4,097.Method: Online panel survey, 94% recruited through parents and 6% directly aged 16–17. Quotas and weights for age/gender/nation/region/ethnicity/socioeconomic grade. Original report pp.6–9 and technical report checked.Limits: Nonprobability panel; 2023/2026 methods and questions differ, so no clean time trend. Gaming excluded from the report’s platform scope. Confidence all-child base n=4,097; other questions use n=3,836 or n=4,065. Potentially uncomfortable contact is broader than cyberbullying and does not establish crime or harm in every case.Supporting original document 1 · Supporting original document 2
- S09 · How common is cyberbullying among children in Australia? Keeping Kids Safe Online snapshotAustralian eSafety Commissioner · Published 2026-09-18 · Actual period: 2024-12 to 2025-02; lifetime and preceding 12 months. Population: Ages 10–17; sexually diverse subgroup ages 13–17 only. Overall report sample: 3,454.Method: Weighted nonprobability Octopus Group/Pure Profile panels, recruited through parents, with demographic quotas. Core n=3,454; a selected incident-follow-up subset n=696. Original snapshot text and April-2026-updated methodology verified via public web retrieval.Limits: Publisher describes demographic representativeness; this is not probability sampling. Cross-sectional self-report, before social-media age restrictions took effect. Lifetime and past-year are nested periods, not a trend or recovery measure. Selected incident-follow-up group is not all children. Trans/gender-diverse n=83 is small. Direct local requests returned 503; original public web extraction succeeded.Supporting original document 1
- S10 · Teens, Social Media and Mental HealthPew Research Center · Published 2025-04-22 · Actual period: 2024-09-18 to 2024-10-10; selected 2022 repeated cross-section. Population: Ages 13–17 living with parents. Overall report sample: 1,391.Method: Ipsos KnowledgePanel probability-panel parent–teen survey, weighted. The social-media experience items are reported on an all-teen base that includes nonusers.Limits: Same 2024 poll used in the Teen Friendship hub; retained here for online connection/exclusion only. Perceived experiences can overlap. 2022/2024 trend uses different respondents. Not a measure of clinical benefit or a current-2027 poll.Supporting original document 1
- S11 · The State of Online HarassmentPew Research Center · Published 2021-01-13 · Actual period: 2020-09-08 to 2020-09-13; ever experienced. Population: Adults age 18+. Overall report sample: 10,093.Method: American Trends Panel probability-based address recruitment, weighted adult survey. Six behaviors; severe = stalking, threats, sustained harassment or sexual harassment.Limits: Historical 2020 adult context, not teen cyberbullying or 2027 prevalence. Most-recent-incident venue is conditional on having experienced harassment. Younger-adult estimates are not estimates for all adults.Supporting original document 1
- S12 · 2025 Cyberbullying Data Cyberbullying Research Center / Patchin and Hinduja · Published 2025-06-30 · Actual period: May 2025; lifetime and preceding 30 days. Population: English/Spanish-speaking middle/high-school students ages 13–17. Overall report sample: 3,466.Method: Original survey commissioned from an online research firm; reported response rate 20%, attention/age consistency checks. Definition includes repeated, intentional mistreatment online or through devices. Limits: Publisher calls the sample nationally representative, but this page does not disclose the recruitment frame, weighting detail or precision needed to independently establish that claim. Its prose gives approximately 58% and about 33%; those approximations are retained, with no precision invented.Supporting original document 1
- S13 · Connected, curious, cautious: Children’s engagement in the digital world Australian eSafety Commissioner · Published 2026-06-17 · Actual period: 2024-12 to 2025-02. Population: Ages 10–17. Overall report sample: 3,454.Method: Same weighted nonprobability Keeping Kids Safe Online core survey as S09. Original agency webpage and methodology consulted. Limits: Not an independent survey from S09. Key findings describe reported uses/benefits and safety practices, not intervention effectiveness. The demographic weighting does not remove all selection bias. Original web text accessible; local download returned 503.Supporting original document 1
How to cite this resource
Consult and cite the original study when verifying its underlying estimate. Credit MyLittleDesire for this synthesis, a clearly labeled descriptive comparison, or a reused MyLittleDesire chart.
MyLittleDesire. Cyberbullying & Online Social Relationships Statistics 2027.https://mylittledesire.com/cyberbullying-statistics/. Add your access date when appropriate.