
The Knot reports that 17% of its 2025 US wedding cohort described their event as a destination wedding. That category can include travel within the US. Easy Weddings’ 2026 Australian report, by contrast, separates home-state, interstate and overseas weddings. Definitions and respondent origins matter before comparing the percentages. The Knot / The Knot Worldwide [S01]; Easy Weddings [S03].
This resource contains 71 published numerical observations in 20 grouped findings, four charts and ten reproducible comparisons. Eight numerical source records represent four publisher labels and several survey cohorts. Response categories, annual points and repeated research coverage are not 71 independent studies. The collection covers adoption, event costs, planners, locations considered, guest counts, attendance spending and gift expectations.
17%
US$39,000
Self-identified destination weddings.The Knot’s 2025 US wedding cohort; exact item n unavailable. The Knot / The Knot Worldwide [S01]
Reported destination-wedding mean.2025-edition guide on 2024 weddings; not a 2027 quote. The Knot [S02]
55 guests
30%
Published Australian destination mean.Easy Weddings 2026 report; exact subgroup n/date unavailable. Easy Weddings [S03]
Engaged couples contemplated a destination wedding.Bridebook’s 2026 UK report; consideration, not booking. Bridebook [S08]
What counts as a destination wedding?
The Knot’s cost guide describes a destination as somewhere other than where the couple currently lives or grew up. This includes domestic locations. Zola’s older questionnaire instead separates local driving, longer domestic travel and international destinations. Australian state boundaries and UK overseas consideration add further definitions. A country label describes the respondent audience unless the table specifically says event location. The Knot [S02]; Zola [S06].
| Measure | What it describes | Essential qualification |
|---|---|---|
| Self-identified destination wedding | How respondents describe their event | Can include domestic travel |
| Overseas or international wedding | A wedding outside the respondent’s country | Narrower than all destination weddings |
| Destination considered | A planning option respondents explored | Does not establish a booking or completed event |
| Mean event spending | A source-defined average for an event group | Inclusions, guest mix and subgroup n may differ |
| Guest attendance spending | What a guest reports spending in total | Different unit and population from the couple’s wedding budget |
How common are destination weddings in US research?
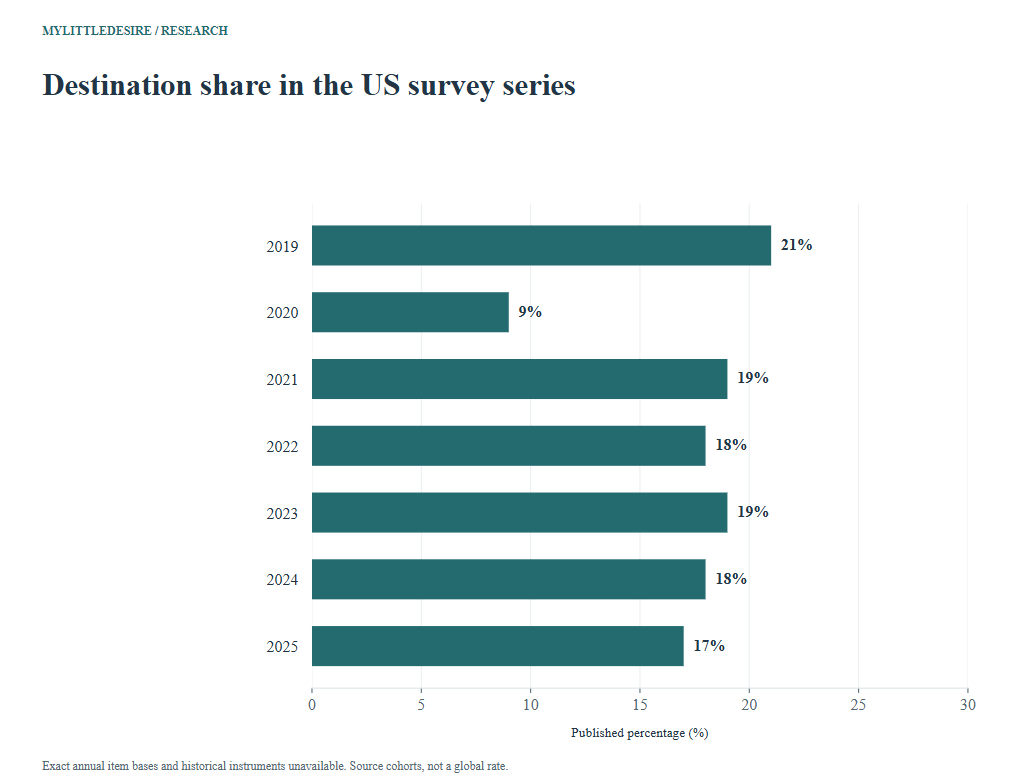
F01 Seven annual self-identified destination-wedding percentages. Latest full main n=10,474 belongs only to the 2025 cohort. Exact yearly item bases and historical instruments unavailable. Domestic destinations included; no national/international-only rate or causal trend.
| Measure / group | Published result | Actual cohort or report period | Source |
|---|---|---|---|
| 2019 wedding cohort | 21% | 2019 US wedding cohort; source historical row in 2026 report | Original source [S01] PDF printed p.3 / physical p.5, destination row |
| 2020 wedding cohort | 9% | 2020 US wedding cohort; source historical row in 2026 report | Original source [S01] PDF printed p.3 / physical p.5, destination row |
| 2021 wedding cohort | 19% | 2021 US wedding cohort; source historical row in 2026 report | Original source [S01] PDF printed p.3 / physical p.5, destination row |
| 2022 wedding cohort | 18% | 2022 US wedding cohort; source historical row in 2026 report | Original source [S01] PDF printed p.3 / physical p.5, destination row |
| 2023 wedding cohort | 19% | 2023 US wedding cohort; source historical row in 2026 report | Original source [S01] PDF printed p.3 / physical p.5, destination row |
| 2024 wedding cohort | 18% | 2024 US wedding cohort; source historical row in 2026 report | Original source [S01] PDF printed p.3 / physical p.5, destination row |
| 2025 wedding cohort | 17% | 2025 US wedding cohort; source historical row in 2026 report | Original source [S01] PDF printed p.3 / physical p.5, destination row |
Also Read:-
AI Wedding Planning Statistics 2027
Engagement Ring Buying Statistics 2027
Wedding Guest Count Statistics 2027
Premarital Counseling Statistics 2027
Relationship Arguments And Conflict Statistics 2027
How much do destination weddings cost?
The cost guide below was updated in April 2025 and cites the 2025 Real Weddings Study. It says the surveyed couples married the previous year; the original study methods identify the 2024 wedding cohort. The guide’s in-2025 headline wording therefore stays separate from the actual wedding period. The Knot [S02].
F02 Five source-reported mean spending totals, keeping event groups distinct. 2025-edition guide on the 2024 wedding cohort, despite in-2025 headline wording. Nominal US dollars; exact subgroup n/inclusions unavailable. Means are not required budgets or quotes for comparable events.
| Measure / group | Published result | Actual cohort or report period | Source |
|---|---|---|---|
| Destination weddings, overall | US$39,000 | 2025 report edition on weddings held in 2024; page calls cost figures in 2025 | Original source [S02] At a glance; domestic/international versus hometown cost list |
| Domestic destination weddings | US$39,000 | 2025 report edition on weddings held in 2024; page calls cost figures in 2025 | Original source [S02] At a glance; domestic/international versus hometown cost list |
| International destination weddings | US$41,000 | 2025 report edition on weddings held in 2024; page calls cost figures in 2025 | Original source [S02] At a glance; domestic/international versus hometown cost list |
| Hometown weddings | US$32,000 | 2025 report edition on weddings held in 2024; page calls cost figures in 2025 | Original source [S02] At a glance; domestic/international versus hometown cost list |
| All weddings, comparison mean | US$33,000 | 2025 report edition on weddings held in 2024; page calls cost figures in 2025 | Original source [S02] At a glance; domestic/international versus hometown cost list |
A difference between group means can reflect event mix, guests and inclusions as well as location. It is not the extra bill caused by travelling. For wider context, see our wedding cost and budget statistics.
How often do destination couples hire planners?
F03 Three planner-hiring rates for source-defined event groups. Different selected groups, not an experiment. Unknown exact subgroup n; no causal benefit or planner replacement/cost-effectiveness inferred.
| Measure / group | Published result | Actual cohort or report period | Source |
|---|---|---|---|
| Domestic destination wedding | 52% | 2025 report edition on weddings held in 2024; page calls cost figures in 2025 | Original source [S02] Destination wedding budget variables, planner paragraph |
| International destination wedding | 74% | 2025 report edition on weddings held in 2024; page calls cost figures in 2025 | Original source [S02] Destination wedding budget variables, planner paragraph |
| Hometown wedding | 32% | 2025 report edition on weddings held in 2024; page calls cost figures in 2025 | Original source [S02] Destination wedding budget variables, planner paragraph |
Hiring prevalence does not establish whether a planner saved money, improved the wedding or was required. The groups can differ in many ways beyond their travel arrangements.
What do the published vendor amounts include?
The following selected amounts appear under the guide’s international vendor heading. Its surrounding prose discusses both destination markets without publishing the item bases or full inclusions. Preserve that scope qualification. These optional component means are not an additive wedding package. The Knot [S02].
F05 Nine selected event-vendor mean amounts from the international-labelled section. The section heading says international, while surrounding prose discusses both markets; exact item scope/bases and inclusions not detailed. Selected components cannot be summed into a destination total; not everyone buys every service.
| Measure / group | Published result | Actual cohort or report period | Source |
|---|---|---|---|
| Reception venue | US$13,030 | 2025 report edition on weddings held in 2024; page calls cost figures in 2025 | Original source [S02] International destination wedding vendor cost breakdown, selected items |
| Photographer | US$3,015 | 2025 report edition on weddings held in 2024; page calls cost figures in 2025 | Original source [S02] International destination wedding vendor cost breakdown, selected items |
| Wedding planner | US$2,972 | 2025 report edition on weddings held in 2024; page calls cost figures in 2025 | Original source [S02] International destination wedding vendor cost breakdown, selected items |
| Florist | US$2,833 | 2025 report edition on weddings held in 2024; page calls cost figures in 2025 | Original source [S02] International destination wedding vendor cost breakdown, selected items |
| Rehearsal dinner | US$4,184 | 2025 report edition on weddings held in 2024; page calls cost figures in 2025 | Original source [S02] International destination wedding vendor cost breakdown, selected items |
| Videographer | US$2,552 | 2025 report edition on weddings held in 2024; page calls cost figures in 2025 | Original source [S02] International destination wedding vendor cost breakdown, selected items |
| Event rentals | US$2,689 | 2025 report edition on weddings held in 2024; page calls cost figures in 2025 | Original source [S02] International destination wedding vendor cost breakdown, selected items |
| Lighting and décor | US$3,303 | 2025 report edition on weddings held in 2024; page calls cost figures in 2025 | Original source [S02] International destination wedding vendor cost breakdown, selected items |
| DJ | US$1,898 | 2025 report edition on weddings held in 2024; page calls cost figures in 2025 | Original source [S02] International destination wedding vendor cost breakdown, selected items |
F06 Catering is explicitly priced per person in the selected vendor list. Different unit from wedding/event totals. Exact eligible base and inclusions unavailable; do not add this per-person amount directly to event totals.
| Measure / group | Published result | Actual cohort or report period | Source |
|---|---|---|---|
| Catering, per person | US$114 per person | 2025 report edition on weddings held in 2024; page calls cost figures in 2025 | Original source [S02] International-labelled vendor breakdown, catering line |
Where did US couples hold international destination weddings?
F04 Three published region/country shares within international destination weddings. Selected categories, not full world distribution or local market shares. Exact international base unavailable; do not compare actual US-couple event locations with UK places merely considered.
| Measure / group | Published result | Actual cohort or report period | Source |
|---|---|---|---|
| Mexico | 34% | 2025 report edition on weddings held in 2024; page calls cost figures in 2025 | Original source [S02] Domestic/international locations section, location shares |
| Europe | 26% | 2025 report edition on weddings held in 2024; page calls cost figures in 2025 | Original source [S02] Domestic/international locations section, location shares |
| Caribbean | 21% | 2025 report edition on weddings held in 2024; page calls cost figures in 2025 | Original source [S02] Domestic/international locations section, location shares |
These percentages describe selected locations of international events in a US-couple survey. They are not the proportion of all weddings taking place in those countries or the places UK respondents merely considered.
Which overseas places did UK couples consider?
F18 Share of engaged couples contemplating a destination wedding. 2026 report edition; exact fieldwork and engaged item n not supplied. Consideration is not booking or a conversion funnel. Conflicting actual-overseas percentages elsewhere in report are excluded.
| Measure / group | Published result | Actual cohort or report period | Source |
|---|---|---|---|
| Engaged couples who contemplated a destination wedding | 30% | 2026 report edition; mixed engaged/newly married audience, exact consideration-item fieldwork unavailable | Original source [S08] PDF physical/printed p.65, consideration headline |
F19 Six region percentages in the overseas-consideration panel. Conditional willingness-to-look-overseas context. Exact profile base and response design unavailable. These are not actual wedding locations or shares of all UK couples; no respondent counts inferred.
| Measure / group | Published result | Actual cohort or report period | Source |
|---|---|---|---|
| Europe | 83% | 2026 report edition; mixed engaged/newly married audience, exact consideration-item fieldwork unavailable | Original source [S08] PDF physical/printed p.65, overseas region map |
| North America | 10% | 2026 report edition; mixed engaged/newly married audience, exact consideration-item fieldwork unavailable | Original source [S08] PDF physical/printed p.65, overseas region map |
| Asia | 3% | 2026 report edition; mixed engaged/newly married audience, exact consideration-item fieldwork unavailable | Original source [S08] PDF physical/printed p.65, overseas region map |
| South America | 1% | 2026 report edition; mixed engaged/newly married audience, exact consideration-item fieldwork unavailable | Original source [S08] PDF physical/printed p.65, overseas region map |
| Africa | 2% | 2026 report edition; mixed engaged/newly married audience, exact consideration-item fieldwork unavailable | Original source [S08] PDF physical/printed p.65, overseas region map |
| Oceania | 1% | 2026 report edition; mixed engaged/newly married audience, exact consideration-item fieldwork unavailable | Original source [S08] PDF physical/printed p.65, overseas region map |
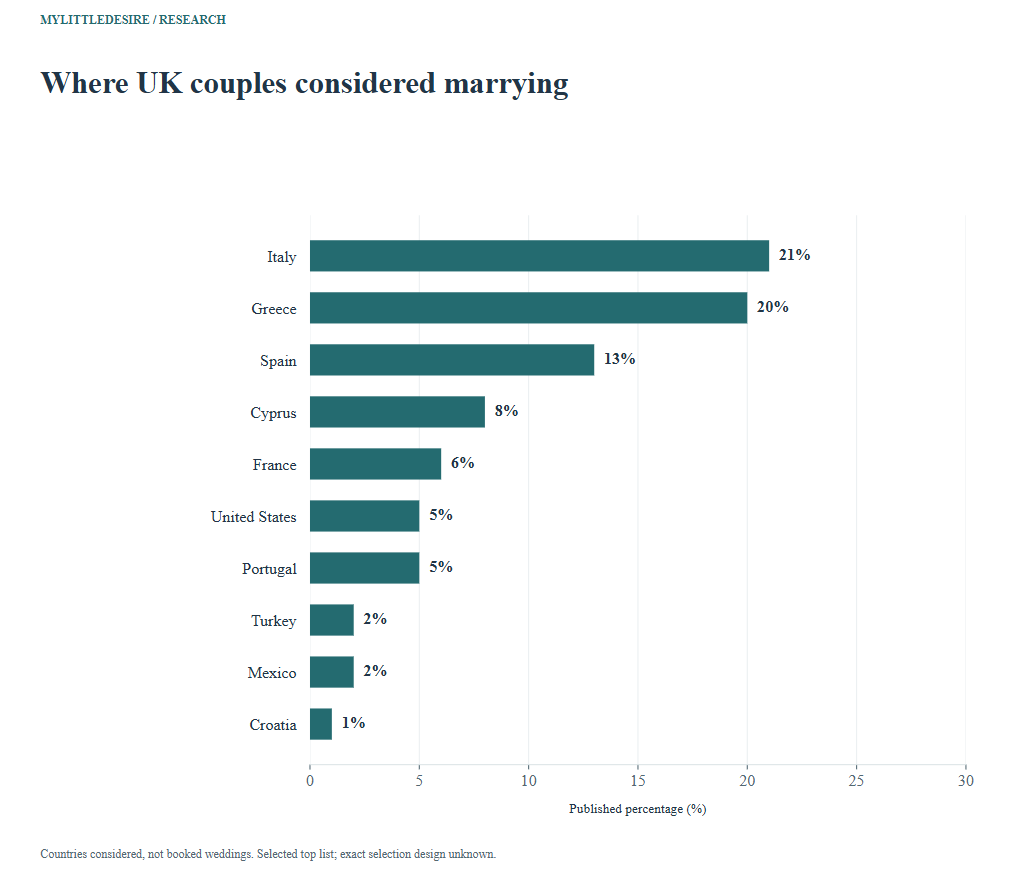
F20 Ten country-consideration percentages from the same overseas panel. Not completed bookings, national wedding shares or a recommendation ranking. Exact country-question denominator/selection design unavailable. Selected top list, not a full distribution; do not invent other countries’ shares.
| Measure / group | Published result | Actual cohort or report period | Source |
|---|---|---|---|
| Italy | 21% | 2026 report edition; mixed engaged/newly married audience, exact consideration-item fieldwork unavailable | Original source [S08] PDF physical/printed p.65, top ten destinations considered |
| Greece | 20% | 2026 report edition; mixed engaged/newly married audience, exact consideration-item fieldwork unavailable | Original source [S08] PDF physical/printed p.65, top ten destinations considered |
| Spain | 13% | 2026 report edition; mixed engaged/newly married audience, exact consideration-item fieldwork unavailable | Original source [S08] PDF physical/printed p.65, top ten destinations considered |
| Cyprus | 8% | 2026 report edition; mixed engaged/newly married audience, exact consideration-item fieldwork unavailable | Original source [S08] PDF physical/printed p.65, top ten destinations considered |
| France | 6% | 2026 report edition; mixed engaged/newly married audience, exact consideration-item fieldwork unavailable | Original source [S08] PDF physical/printed p.65, top ten destinations considered |
| United States | 5% | 2026 report edition; mixed engaged/newly married audience, exact consideration-item fieldwork unavailable | Original source [S08] PDF physical/printed p.65, top ten destinations considered |
| Portugal | 5% | 2026 report edition; mixed engaged/newly married audience, exact consideration-item fieldwork unavailable | Original source [S08] PDF physical/printed p.65, top ten destinations considered |
| Turkey | 2% | 2026 report edition; mixed engaged/newly married audience, exact consideration-item fieldwork unavailable | Original source [S08] PDF physical/printed p.65, top ten destinations considered |
| Mexico | 2% | 2026 report edition; mixed engaged/newly married audience, exact consideration-item fieldwork unavailable | Original source [S08] PDF physical/printed p.65, top ten destinations considered |
| Croatia | 1% | 2026 report edition; mixed engaged/newly married audience, exact consideration-item fieldwork unavailable | Original source [S08] PDF physical/printed p.65, top ten destinations considered |
Why no UK actual-overseas rate? The original Bridebook PDF shows 4% on its location chart on page 63 and 3% in the page-65 narrative, without explaining the difference in eligible bases. Both actual-overseas values are excluded from the numerical database. The consideration panel remains clearly labelled; it does not become a booking-conversion funnel. Bridebook [S08].
What do Australian destination-wedding reports show?
Easy Weddings’ location panel is geographical, while its destination cost and guest means use a destination subgroup whose exact definition and answering n are not fully supplied. Treat these as report-edition results rather than completed calendar-year national estimates. Easy Weddings [S03]; Easy Weddings [S04].
F07 Three geographical categories printed beside the destination section. Report edition with mixed planning/past audience and unknown exact item dates/n. Home-state, interstate and overseas location boundaries are not a self-identified destination/local question.
| Measure / group | Published result | Actual cohort or report period | Source |
|---|---|---|---|
| Home state or territory | 89% | 2026 report edition; mixed engaged/recently married research, exact destination-item dates unavailable | Original source [S03] PDF physical/printed p.43, location panel |
| Another Australian state or territory | 7% | 2026 report edition; mixed engaged/recently married research, exact destination-item dates unavailable | Original source [S03] PDF physical/printed p.43, location panel |
| Overseas | 4% | 2026 report edition; mixed engaged/recently married research, exact destination-item dates unavailable | Original source [S03] PDF physical/printed p.43, location panel |
F10 Three geographical categories printed beside the destination section. Report edition with mixed planning/past audience and unknown exact item dates/n. Home-state, interstate and overseas location boundaries are not a self-identified destination/local question.
| Measure / group | Published result | Actual cohort or report period | Source |
|---|---|---|---|
| Home state or territory | 91% | 2025 report edition; planning/recent-wedding research, exact destination-item dates unavailable | Original source [S04] PDF physical/printed p.44, location panel |
| Another Australian state or territory | 7% | 2025 report edition; planning/recent-wedding research, exact destination-item dates unavailable | Original source [S04] PDF physical/printed p.44, location panel |
| Overseas | 2% | 2025 report edition; planning/recent-wedding research, exact destination-item dates unavailable | Original source [S04] PDF physical/printed p.44, location panel |
F08 Source destination-wedding mean in nominal Australian dollars. Exact destination subgroup, inclusions and item dates unavailable. Different annual report audiences; dollar difference is not a matched price index or proof of savings.
| Measure / group | Published result | Actual cohort or report period | Source |
|---|---|---|---|
| 2026 report destination mean | A$32,060 | 2026 report edition; mixed engaged/recently married research, exact destination-item dates unavailable | Original source [S03] PDF physical/printed p.43, destination cost |
F11 Source destination-wedding mean in nominal Australian dollars. Exact destination subgroup, inclusions and item dates unavailable. Different annual report audiences; dollar difference is not a matched price index or proof of savings.
| Measure / group | Published result | Actual cohort or report period | Source |
|---|---|---|---|
| 2025 report destination mean | A$29,391 | 2025 report edition; planning/recent-wedding research, exact destination-item dates unavailable | Original source [S04] PDF physical/printed p.44, destination cost |
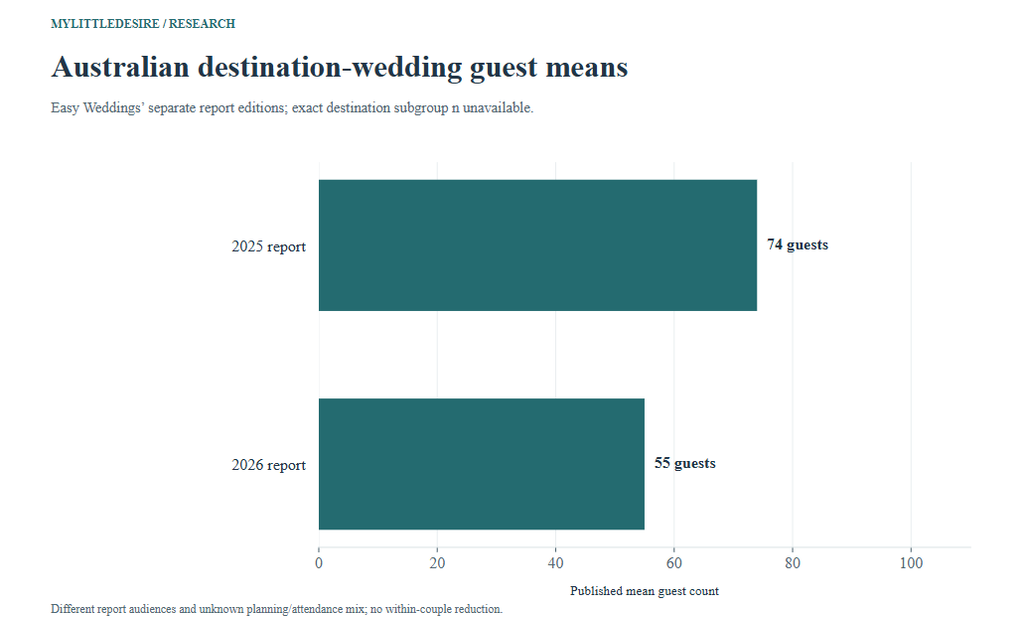
F09 Published destination-wedding guest-count mean. Unknown exact destination subgroup n and planning/attendance mix. Different report cohorts; not an individual couple cutting its list or a verified completed-calendar-year national count.
| Measure / group | Published result | Actual cohort or report period | Source |
|---|---|---|---|
| 2026 report destination guest mean | 55 guests | 2026 report edition; mixed engaged/recently married research, exact destination-item dates unavailable | Original source [S03] PDF physical/printed p.43, destination guest mean |
F12 Published destination-wedding guest-count mean. Unknown exact destination subgroup n and planning/attendance mix. Different report cohorts; not an individual couple cutting its list or a verified completed-calendar-year national count.
| Measure / group | Published result | Actual cohort or report period | Source |
|---|---|---|---|
| 2025 report destination guest mean | 74 guests | 2025 report edition; planning/recent-wedding research, exact destination-item dates unavailable | Original source [S04] PDF physical/printed p.44, destination guest mean |
The reports’ guest means describe different audiences. For planning, distinguish the intended list, accepted invitations and actual attendance; our wedding guest count statistics explains those measures in more detail.
What did Zola’s wedding-location planning questions measure?
These original Zola questions describe wedding plans. The two annual tables have different response structures, so their destination figures should not be subtracted to claim a measured adoption trend. Published rounding remains unchanged. Zola [S05]; Zola [S06].
F13 Two published wedding-type categories. Planning-stage self-description. Values total 99% as printed, not silently forced to 100%; exact item n unknown. No invented international share.
| Measure / group | Published result | Actual cohort or report period | Source |
|---|---|---|---|
| Destination wedding | 32% | Couples getting married in 2025; exact survey fieldwork dates unavailable | Original source [S05] The Big Day, wedding-location type question |
| Local wedding | 67% | Couples getting married in 2025; exact survey fieldwork dates unavailable | Original source [S05] The Big Day, wedding-location type question |
F15 Five source-defined levels of guest travel and location. Plans, not completed guest travel. Exact item n unknown. Original percentages total 99.99%; retain precision rather than add a residual or compare as a trend with different questions.
| Measure / group | Published result | Actual cohort or report period | Source |
|---|---|---|---|
| Very local; most guests live there | 8.84% | Couples getting married in 2024; exact survey fieldwork dates unavailable | Original source [S06] Wedding Planning Decisions, location question |
| Local; most guests can drive | 55.06% | Couples getting married in 2024; exact survey fieldwork dates unavailable | Original source [S06] Wedding Planning Decisions, location question |
| Domestic destination; longer travel for many | 28.27% | Couples getting married in 2024; exact survey fieldwork dates unavailable | Original source [S06] Wedding Planning Decisions, location question |
| International destination | 7.69% | Couples getting married in 2024; exact survey fieldwork dates unavailable | Original source [S06] Wedding Planning Decisions, location question |
| Not sure yet | 0.13% | Couples getting married in 2024; exact survey fieldwork dates unavailable | Original source [S06] Wedding Planning Decisions, location question |
How much do travelling wedding guests spend?
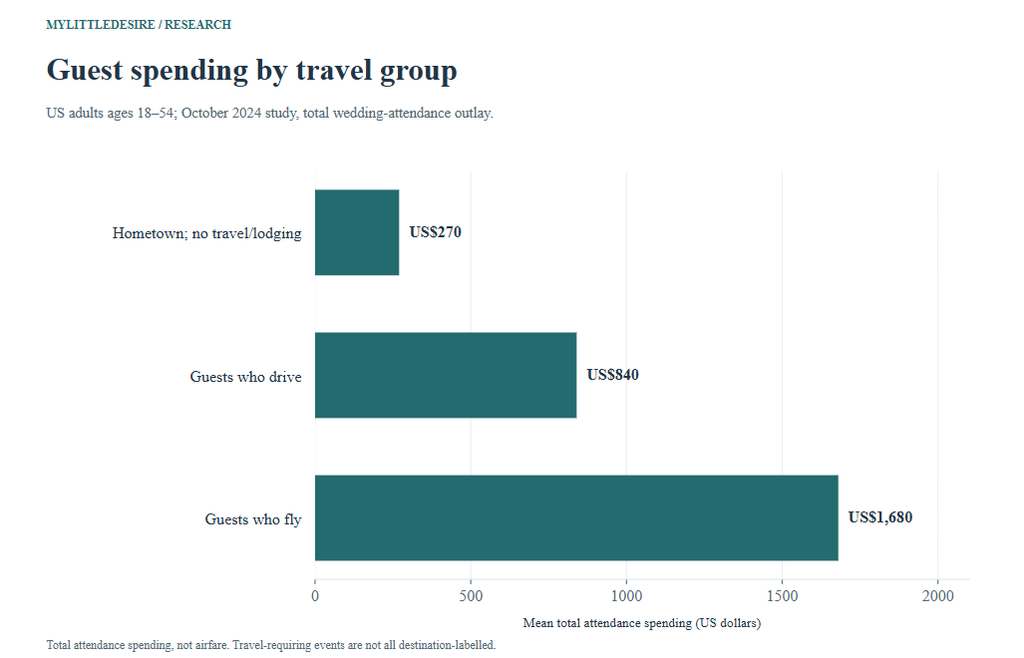
F16 Overall mean plus three source travel-mode/location group means. October 2024 adults age 18–54; exact item/subgroup n unknown. Total attendance outlay includes more than travel; flying amount is not airfare or an international-only price. Travel groups need not be destination-labelled weddings.
| Measure / group | Published result | Actual cohort or report period | Source |
|---|---|---|---|
| Overall guest total | US$610 | October 2024 guest survey; respondents attended at least one wedding in person in 2024 | Original source [S07] Average guest cost; Travel and Lodging Costs |
| Own hometown; no travel or lodging | US$270 | October 2024 guest survey; respondents attended at least one wedding in person in 2024 | Original source [S07] Average guest cost; Travel and Lodging Costs |
| Guests who drive | US$840 | October 2024 guest survey; respondents attended at least one wedding in person in 2024 | Original source [S07] Average guest cost; Travel and Lodging Costs |
| Guests who fly | US$1,680 | October 2024 guest survey; respondents attended at least one wedding in person in 2024 | Original source [S07] Average guest cost; Travel and Lodging Costs |
F17 Two distinct measures about price and paying for accommodation. Guest context, not destination-wedding adoption or couple spending. Exact item eligibility/bases unavailable; attitudes and reported payment cannot be subtracted as if one distribution.
| Measure / group | Published result | Actual cohort or report period | Source |
|---|---|---|---|
| Price is biggest accommodation decision factor | 79% | October 2024 guest survey; respondents attended at least one wedding in person in 2024 | Original source [S07] Travel and Lodging Costs, accommodation paragraph |
| Respondents who paid for accommodation | 65% | October 2024 guest survey; respondents attended at least one wedding in person in 2024 | Original source [S07] Travel and Lodging Costs, accommodation paragraph |
This is guest-travel context rather than a destination-only sample. The guest study’s age range and October 2024 fieldwork remain attached even though the guide was updated in 2026. The flying mean includes total attendance outlay; it is not an airfare estimate. The Knot [S07].
What gifts do destination couples expect from guests?
F14 What destination-planning couples expect relative to other wedding gifts. Conditional destination-planning subgroup with unknown exact n. Expectations, not guest intentions, actual gift values or a recommended minimum.
| Measure / group | Published result | Actual cohort or report period | Source |
|---|---|---|---|
| Expects guests to spend more | 4% | Couples getting married in 2025; exact survey fieldwork dates unavailable | Original source [S05] Destination-wedding gift-expectation question |
| Expects guests to spend less | 79% | Couples getting married in 2025; exact survey fieldwork dates unavailable | Original source [S05] Destination-wedding gift-expectation question |
| Expects the same amount | 17% | Couples getting married in 2025; exact survey fieldwork dates unavailable | Original source [S05] Destination-wedding gift-expectation question |
The answers describe what destination-planning couples expect. They do not report what guests intend to spend or what the couple ultimately receives, and they do not set a required gift amount.
How can couples and wedding businesses use the findings?
The following are editorial applications of the evidence, not measured intervention effects. Couples and wedding businesses can use the definitions to ask better budget and logistics questions before treating an average as a target.
| Decision | Useful evidence distinction | Question to resolve |
|---|---|---|
| Location shortlist | Considered locations differ from bookings | Which options remain feasible for this specific guest group? |
| Event budget | Whole-event and component means have different bases | What does the actual venue/vendor quote include? |
| Guest communication | Guest outlay differs from the wedding budget | Which travel and accommodation costs will guests need to cover? |
| Guest count | Plans differ from attendance | Which event and people does the current headcount include? |
| Gift expectations | Expectations differ from gifts received | How will the couple communicate its own preferences clearly? |
Ten reproducible descriptive comparisons
Each difference is first value minus second. Percentage differences use percentage points; US dollars, Australian dollars and guests keep separate units. The ten results reuse observations and are not additional studies. Workbook formulas require matching unit and measure type and return blanks for missing, duplicated, nonnumeric or mismatched inputs.
| Comparison | Inputs | Difference | Interpretation |
|---|---|---|---|
| Domestic destination minus hometown mean | US$39,000 − US$32,000 | 7000 USD | Different event groups and unknown inclusions/guest mix; not a causal travel surcharge. |
| International minus domestic destination mean | US$41,000 − US$39,000 | 2000 USD | 2024 cohort in 2025-edition guide; nominal means, not matched quotes. |
| International minus domestic planner use | 74% − 52% | 22 percentage points | Selected group prevalences with unknown subgroup n; not a causal planner effect. |
| Domestic destination minus hometown planner use | 52% − 32% | 20 percentage points | Source event groups, not repeated measures of the same couples. |
| Australian destination mean: 2026 minus 2025 report | A$32,060 − A$29,391 | 2669 AUD | Separate report editions and unknown destination mix; not inflation or a matched price index. |
| Australian destination guests: 2026 minus 2025 report | 55 guests − 74 guests | -19 guests | Different report audiences; not a within-couple reduction or national completed-year trend. |
| Guest flying minus driving total spending | US$1,680 − US$840 | 840 USD | Total attendance outlay, not the extra price of a flight or causal transport cost. |
| Expect smaller gifts minus same gifts | 79% − 17% | 62 percentage points | Conditional destination-planning audience; expectations, not gifts received. |
| UK Italy minus Greece consideration profile | 21% − 20% | 1 percentage points | Places considered, not actual event destinations or booking conversion. |
| Zola 2024 domestic minus international plans | 28.27% − 7.69% | 20.58 percentage points | Same historical planning question; no cross-year adoption trend. |
Common questions
Does a destination wedding have to be abroad?
No. The US source definition includes domestic destinations. Overseas is a narrower geographical category, and other surveys use their own location or guest-travel definitions. Retain the definition attached to the result.
Are destination weddings cheaper?
The selected means do not establish a universal answer. Event mix, guest counts, inclusions, currencies and survey populations differ. A source’s group-average difference is not a matched quote or causal saving for an individual couple.
Which overseas country is most popular?
The selected tables answer different versions of that question: actual international event locations among US respondents, and countries considered in a UK overseas panel. They should not be combined into one global ranking.
Research method and limitations
The collection has 71 published observations in 20 groups: 48 percentages, 18 US-dollar amounts, one US-dollar per-person catering amount, two Australian-dollar means and two guest-count means. Eight numerical source records come from four publisher labels. The Knot contributes 34 values across couple, guest and historical-cohort research, Bridebook 17 consideration values, Easy Weddings ten across two editions, and Zola ten across two cohorts. Categories and annual points are not independent studies.
Original question tables, publisher guides and report panels were checked. The Knot historical panel and both Australian destination pages were visually inspected in the original PDFs. Bridebook’s official support link led to its public document viewer and downloadable original report; the original methods/overview and pages 63 and 65 were checked. That report’s conflicting actual-overseas shares were documented and excluded.
Every selected exact valid question/subgroup n remains unavailable and is blank in the data and workbook. Known full sample totals stay separate from item bases. Approximate and lower-bound totals are not invented as precise counts. No private survey records were obtained, no respondent-level reanalysis or representative global estimate was conducted, and no causal experiment or statistical-significance test was performed. A Canada-specific original destination benchmark was not verified.
Excluded interpretations: Measured 2027 outcomes, a global destination rate, an international-only reading of US destination shares, conflicting UK actual-overseas values, conversion from consideration to booking, a repaired Zola total, ambiguous international-base wording, all-state wedding prices relabelled as destination prices, vendor sums, causal savings and unverified Canadian secondary numbers. Charts and calculations reuse published inputs.
Original sources and supporting records
- S01. The Knot / The Knot Worldwide. The Knot Real Weddings Study 2026, destination-wedding historical row. Actual period: Wedding cohorts 2019–2025; latest cohort married January–December 2025. Latest full main n=10,474, plus ad hoc research. Exact destination-question n unavailable for every year. Do not assign the latest n to all seven years. Method: Main 2025 sample recruited via email from The Knot/WeddingWire membership during 2025. Seven destination shares in the current report historical table, printed p.3 / physical p.5, visually checked; methods printed p.2. Self-identified destination events, not an international-only or nationally weighted registry measure. Historical instruments and annual item counts not harmonized here. Rounded levels describe source cohorts; no causal trend or statistical significance inferred. Supporting records: record 1.
- S02. The Knot. The Average Cost of a Destination Wedding, According to Our Data. Actual period: 2025 report edition on weddings held in 2024; page calls cost figures in 2025. Companion original study methods give full n=16,956. Exact domestic/international/hometown, planner-use, region and vendor valid n not printed in cost guide. Full sample is not any subgroup n. Method: Guide says nearly 17,000 married last year, cites 2025 Real Weddings Study and explicitly identifies 2024 weddings in its location discussion. Companion main-study methods confirm 2024 cohort and member email recruitment. Selected mean totals, planner use, international-location shares and ten vendor amounts checked. Headline year is not reassigned as fieldwork. Means, not quotes or medians; event inclusions/guest mix and exact subgroup bases unresolved. Selected vendor section is labelled international, but its prose discusses both markets; preserve heading and scope caveat. Catering is per person. Components are not additive; state-wide wedding prices are not destination-only prices and are excluded. Supporting records: record 1.
- S03. Easy Weddings. 2026 Australian Wedding Industry Report, Destination Weddings. Actual period: 2026 report edition; mixed engaged/recently married research, exact destination-item dates unavailable. Report-wide couple total is a lower bound, not exact destination-item n. Cost/guest subgroup counts and destination definition not fully supplied. Method: Original foreword p.2 read and physical/printed destination page p.43 visually checked: three location shares, destination mean cost and mean guest count. Report edition is not completed calendar-year fieldwork. Home state, interstate and overseas are different from self-identified destination/local categories in US research. Nominal Australian dollars. Separate annual report audiences; no matched price index or causal savings estimate.
- S04. Easy Weddings. 2025 Australian Wedding Industry Report, Destination Weddings. Actual period: 2025 report edition; planning/recent-wedding research, exact destination-item dates unavailable. Unknown exact location-item and destination cost/guest bases. Report-wide lower bound is not substituted as subgroup n. Method: Original foreword p.2 read; physical/printed destination page p.44 rendered and visually checked for five selected numbers. Report edition, not verified completed 2025 outcomes. Broad planning/past mix and exact dates not disclosed. Narrative close-to-home wording includes interstate events, so only explicit location panel retained. Source ratings and ranked desired locations are not counted as adoption percentages.
- S05. Zola. 2025 Wedding Trends: Zola’s First Look Report Data Deep Dive. Actual period: Couples getting married in 2025; exact survey fieldwork dates unavailable. Destination gift question is conditional on planning a destination wedding. Exact valid base not given; do not multiply the rounded destination share by a lower-bound full sample. Method: Original question tables checked: destination/local wedding type and destination couples’ expected guest gift amounts. Plans and stated expectations, not completed travel or gifts received. Type categories total 99% as published; no missing category invented. Narrative international wording is ambiguous about its base and is not adopted. Supporting records: record 1.
- S06. Zola. 2024 Wedding Trends: Zola’s First Look Report Data Deep Dive. Actual period: Couples getting married in 2024; exact survey fieldwork dates unavailable. Exact location-question valid n unavailable. Close-to-7,000 full sample is not an exact destination subgroup base. Method: Original five-category wedding-location question read. Distinguishes very local, car-accessible local, domestic destination, international destination and unsure. Planning-stage definitions differ from The Knot self-identification and Australian state boundaries. Two-decimal source precision retained; categories total 99.99% without adjustment. No cross-publisher trend or prediction inferred.
- S07. The Knot. The Average Wedding Guest Cost and How to Budget for It. Actual period: October 2024 guest survey; respondents attended at least one wedding in person in 2024. Full guest study n=1,000, recruited through a third-party research company. Exact valid travel-mode, accommodation and price-factor item n unavailable. Method: Original guide and guest-study methods checked for four total-attendance spending means, accommodation-price decision factor and accommodation-payment percentage. Guest total outlay includes more than transportation; flying amount is not an airfare quote or international-only mean. Not every travel-requiring wedding is labelled destination. Age 18–54 frame excludes older adults. Guest and couple samples are separate; later page update does not change fieldwork to 2026.
- S08. Bridebook. UK Wedding Report 2026, overseas consideration panel. Mixed engaged/newly married audience, exact consideration-item fieldwork unavailable. Report-wide sample wording is approximate/inconsistent in precision. Exact engaged, overseas-consideration, region and country item bases not supplied. Method: Original report publicly linked by Bridebook support page obtained through its public document viewer download. PDF foreword/overview pp.2/4 read; physical/printed p.65 visually checked. One consideration level, six geographic profile percentages and ten country-consideration values selected. Considered locations, not booked or completed weddings. Exact profile denominator and response design not printed; no all-UK-couple destination prevalence inferred. Actual overseas share conflicts: p.63 chart 4%, p.65 narrative 3%; both excluded. No conversion rate computed from consideration and an actual outcome. Supporting records: record 1, record 2.
Supporting and screened records without additional observations
- R01. The Knot. 2025 Real Weddings Study: 2024 wedding cohort and methods. Cost-guide cohort verification. Main study explicitly covers couples married in 2024; member-email recruitment and exact main n stated. No additional observation count; cost guide’s headline year is not treated as fieldwork. Item/subgroup bases remain unknown.
- R02. Bridebook. UK Wedding Report 2026 official access page. Original PDF access and source-quality cross-check. Publisher links its public document viewer. Original pp.63 and 65 have conflicting actual-overseas shares. Only clearly labelled consideration/profile results used; no actual UK overseas point or conversion rate selected.
- R03. Hyatt Inclusive Collection / TravelPulse Canada. Canadian destination-wedding survey coverage screened. Canada-specific original-source search. Secondary coverage attributes preferences to a commissioned survey. Original issuer questionnaire, eligible sample and release not verified. No Canada-specific numerical benchmark counted; unrelated travel-intention surveys also excluded.
How to cite this resource
MyLittleDesire. Destination Wedding Statistics 2027 https://mylittledesire.com/destination-wedding-statistics/