The Knot’s 2026 Registry Study reports that 82% created a registry over the past year, while 75% included a cash fund. Those measures describe registry choices. They do not tell us what share of gifts arrived as cash or how much money a couple received. The Knot / The Knot Worldwide [S01].
This resource contains 63 published numerical observations in 17 grouped findings, with four charts and ten reproducible comparisons. It covers registry creation, physical gifts, cash funds, attitudes, Australian gift preferences and related gift-spending context. Eight numerical source records come from four publisher labels. Several pages share research programs; 63 observations do not mean 63 independent studies.
82%
75%
Created a wedding registry over the past year.The Knot 2026 study; full survey n=1,759, exact item n unknown. The Knot / The Knot Worldwide [S01]
Included a cash fund on their registry.The Knot 2026 study; exact item eligibility/base not published. The Knot / The Knot Worldwide [S01]
87%
61%
Have or plan to have at least one cash fund.Zola 2026 planning research; exact item n unknown. Zola [S04]
Preferred a wishing well in the six-option chart.Easy Weddings 2026 report; not directly comparable with 2025. Easy Weddings [S06]
What do wedding registry statistics measure?
| Measure | What it describes | What it cannot establish |
|---|---|---|
| Registry creation | Couples who created a list or fund under the source’s question. | The share of guests buying gifts or the share of gifts fulfilled. |
| Category prevalence | People who list a category, often selecting several. | Sales share, value share or mutually exclusive market segments. |
| Cash-fund inclusion | Couples who include or plan a fund. | The share of wedding gifts or dollars received as cash. |
| Fund purpose | An intended use chosen by an eligible cash-fund user. | A final spending allocation or money already received. |
| Single most-wanted item | One top preference under a specific question. | Everything a couple wants or will accept. |
| Public attitudes | What respondents consider acceptable or appropriate. | What those people actually bought, paid or requested. |
| Gift-spend amount | A reported monetary benchmark with its own definition. | A compulsory gift, per-person rule or predictable registry income. |
Also Read:-
Wedding Guest Count Statistics 2027
Premarital Counseling Statistics 2027
Relationship Arguments And Conflict Statistics 2027
First Date Safety Statistics 2027
How Couples Meet Statistics 2027
How many couples create a wedding registry?
The Knot’s study surveyed 1,759 engaged and married members in May 2026, with wedding dates from April 2025 through December 2026. Exact question and subgroup bases are not published. The overall creation figure and subgroup values overlap; they are descriptive comparisons within one commercial sample. The Knot / The Knot Worldwide [S01].
F01 Published overall and subgroup registry-creation percentages. Subgroups overlap the overall sample; exact item n and large-wedding threshold unavailable. Not three independent surveys.
| Measure / group | Published result | Actual cohort or report period | Source |
|---|---|---|---|
| Created a registry over the past year | 82% | Survey in May 2026; member wedding dates April 2025–December 2026 | Original source [S01] Opening registry-adoption paragraph |
| Gen Z registry creation | 89% | Survey in May 2026; member wedding dates April 2025–December 2026 | Original source [S01] Opening registry-adoption paragraph |
| Large-wedding registry creation | 87% | Survey in May 2026; member wedding dates April 2025–December 2026 | Original source [S01] Opening registry-adoption paragraph |
F02 Publisher describes home upgrades as the primary reason to create a registry. Exact question eligibility and item n unavailable; this does not mean the registry paid for upgrades.
| Measure / group | Published result | Actual cohort or report period | Source |
|---|---|---|---|
| Home upgrades as primary reason | 51% | Survey in May 2026; member wedding dates April 2025–December 2026 | Original source [S01] Opening home-upgrades paragraph |
What physical gifts do couples register for?
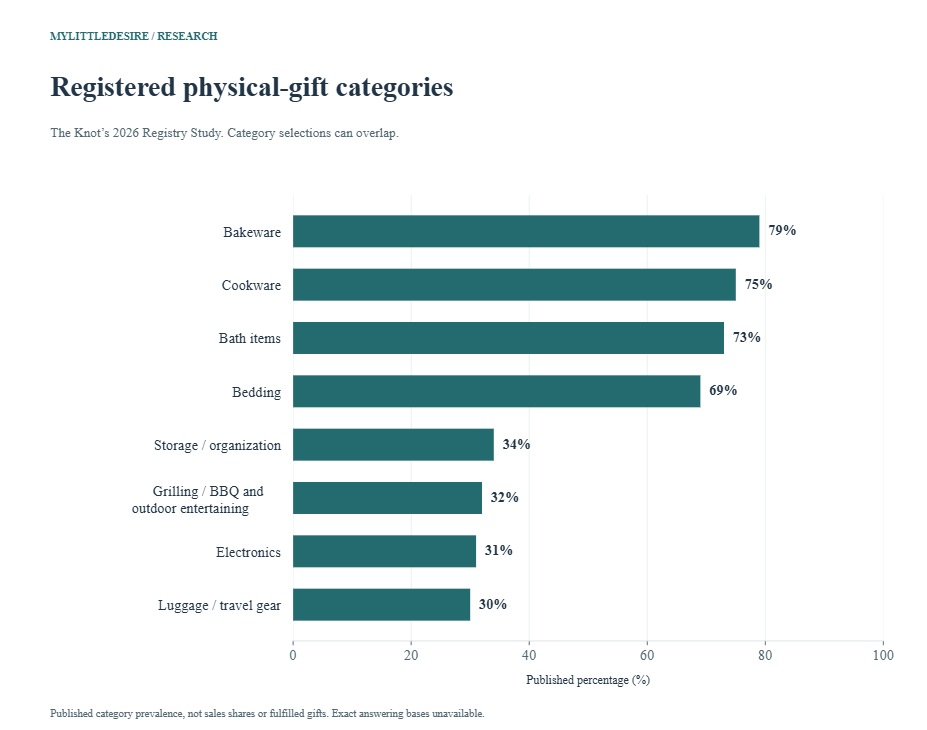
F03 Percentages reported as registered-for categories. Categories overlap; exact item n/eligibility unpublished. Values are selection prevalence, not sales shares or gift fulfillment.
| Measure / group | Published result | Actual cohort or report period | Source |
|---|---|---|---|
| Bakeware | 79% | Survey in May 2026; member wedding dates April 2025–December 2026 | Original source [S01] Physical-gift category paragraphs |
| Cookware | 75% | Survey in May 2026; member wedding dates April 2025–December 2026 | Original source [S01] Physical-gift category paragraphs |
| Bath items | 73% | Survey in May 2026; member wedding dates April 2025–December 2026 | Original source [S01] Physical-gift category paragraphs |
| Bedding | 69% | Survey in May 2026; member wedding dates April 2025–December 2026 | Original source [S01] Physical-gift category paragraphs |
| Storage and organization | 34% | Survey in May 2026; member wedding dates April 2025–December 2026 | Original source [S01] Physical-gift category paragraphs |
| Grilling / BBQ and outdoor entertaining | 32% | Survey in May 2026; member wedding dates April 2025–December 2026 | Original source [S01] Physical-gift category paragraphs |
| Electronics | 31% | Survey in May 2026; member wedding dates April 2025–December 2026 | Original source [S01] Physical-gift category paragraphs |
| Luggage and travel gear | 30% | Survey in May 2026; member wedding dates April 2025–December 2026 | Original source [S01] Physical-gift category paragraphs |
Zola’s separate category table explicitly identifies 555 active registry users. It combines bedding with bath linens and kitchen items with cookware, unlike The Knot’s narrower labels. Keep the categories in each publisher’s own terms. Zola [S02].
F06 Eight categories added by active registry users, n=555. Nonexclusive selections. Zola combines some categories that The Knot separates, so the two lists do not support a direct platform ranking.
| Measure / group | Published result | Actual cohort or report period | Source |
|---|---|---|---|
| Kitchen and cookware | 78% | 2026 Registry & Gifting Survey; exact fieldwork dates unavailable | Original source [S02] Registry category / Couples who added it table |
| Small kitchen appliances | 70% | 2026 Registry & Gifting Survey; exact fieldwork dates unavailable | Original source [S02] Registry category / Couples who added it table |
| Bedding and bath linens | 63% | 2026 Registry & Gifting Survey; exact fieldwork dates unavailable | Original source [S02] Registry category / Couples who added it table |
| Home décor and entertaining | 54% | 2026 Registry & Gifting Survey; exact fieldwork dates unavailable | Original source [S02] Registry category / Couples who added it table |
| Experiences | 36% | 2026 Registry & Gifting Survey; exact fieldwork dates unavailable | Original source [S02] Registry category / Couples who added it table |
| Luggage and travel accessories | 29% | 2026 Registry & Gifting Survey; exact fieldwork dates unavailable | Original source [S02] Registry category / Couples who added it table |
| Outdoor and garden | 29% | 2026 Registry & Gifting Survey; exact fieldwork dates unavailable | Original source [S02] Registry category / Couples who added it table |
| Tech and electronics | 25% | 2026 Registry & Gifting Survey; exact fieldwork dates unavailable | Original source [S02] Registry category / Couples who added it table |
How common are cash and hybrid registries?
F04 Three different registry/cash measures from the same release. Hybrid figure is explicitly for engaged couples. Exact item bases unavailable. Adoption, combining options and a single top preference are not interchangeable.
| Measure / group | Published result | Actual cohort or report period | Source |
|---|---|---|---|
| Engaged couples combining traditional gifts and cash | 56% | Survey in May 2026; member wedding dates April 2025–December 2026 | Original source [S01] Hybrid/cash registry paragraph |
| Cash is the gift wanted most | 41% | Survey in May 2026; member wedding dates April 2025–December 2026 | Original source [S01] Hybrid/cash registry paragraph |
| Including a cash fund on the registry | 75% | Survey in May 2026; member wedding dates April 2025–December 2026 | Original source [S01] Hybrid/cash registry paragraph |
F05 Importance of guest ease of use in the cash-fund context. Exact eligible base and item wording not published. An attitude, not a measured checkout completion rate.
| Measure / group | Published result | Actual cohort or report period | Source |
|---|---|---|---|
| Guest ease of use described as most important | 89% | Survey in May 2026; member wedding dates April 2025–December 2026 | Original source [S01] Cash-fund ease-of-use paragraph |
F08 Separate result attributed to Zola’s Registry & Gifting Survey. Exact eligible n unavailable. Do not assign n=555 from the different active-user category table or compare directly with The Knot’s 41% wording.
| Measure / group | Published result | Actual cohort or report period | Source |
|---|---|---|---|
| Cash fund named single most-wanted item | 24% | 2026 Registry & Gifting Survey; exact item dates unavailable | Original source [S03] FAQ 2, single most-wanted registry item paragraph |
F09 Have or plan to have at least one cash fund. Selected planning audience and unknown exact item base. A share of couples, not gifts or dollars; not a trend comparison with The Knot’s sample.
| Measure / group | Published result | Actual cohort or report period | Source |
|---|---|---|---|
| Have or plan at least one cash fund | 87% | 2026 planning cohort; exact item dates unavailable | Original source [S04] Zola-issued Jan.27 release, Cash remains king; cash guide clarification |
The Knot and Zola percentages should be read as separate findings. Their audiences, questions, periods and eligible groups differ. A gap between their figures does not show that one platform produces more gifts, nor does it establish a national trend.
What are wedding cash funds intended to pay for?
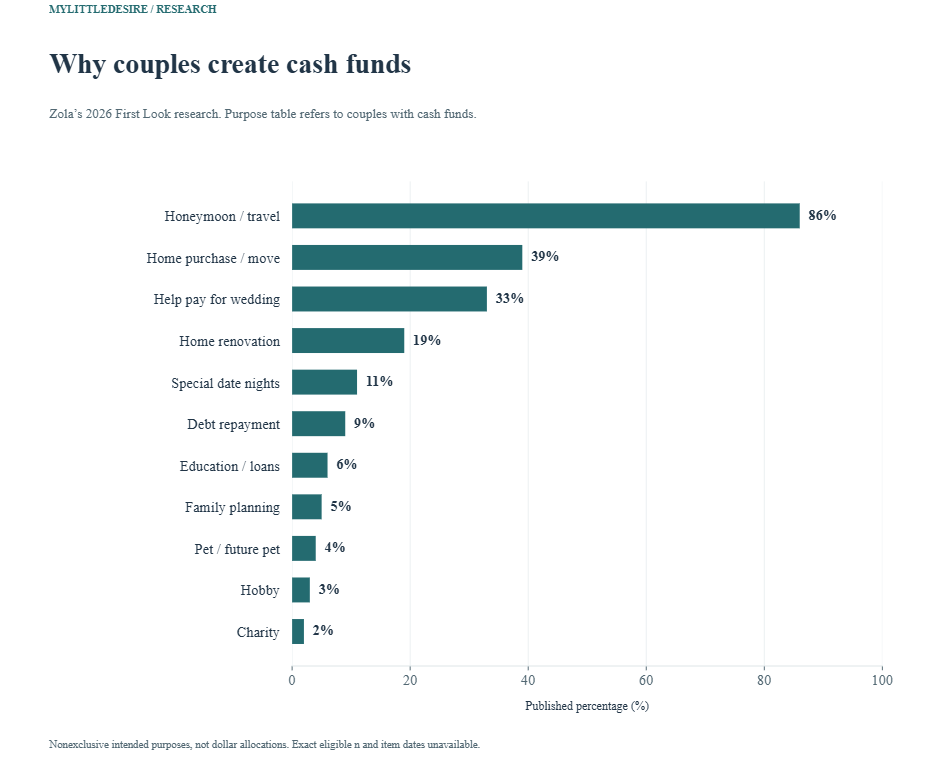
F07 Purpose table is introduced as uses chosen by couples with cash funds. Exact eligible n unavailable; multiple purposes possible. These are intended uses, not received-dollar allocations. Its 33% wedding-purpose row has a different stated context from the overall-planner 27%; no numerical reconciliation inferred.
| Measure / group | Published result | Actual cohort or report period | Source |
|---|---|---|---|
| Honeymoon / travel | 86% | 2026 First Look planning cohort; exact item dates unavailable | Original source [S03] FAQ 3: Cash fund purpose / Couples who chose it table |
| Home purchase or move | 39% | 2026 First Look planning cohort; exact item dates unavailable | Original source [S03] FAQ 3: Cash fund purpose / Couples who chose it table |
| Help pay for the wedding | 33% | 2026 First Look planning cohort; exact item dates unavailable | Original source [S03] FAQ 3: Cash fund purpose / Couples who chose it table |
| Home renovations / upgrades | 19% | 2026 First Look planning cohort; exact item dates unavailable | Original source [S03] FAQ 3: Cash fund purpose / Couples who chose it table |
| Special date nights | 11% | 2026 First Look planning cohort; exact item dates unavailable | Original source [S03] FAQ 3: Cash fund purpose / Couples who chose it table |
| Pay down debt | 9% | 2026 First Look planning cohort; exact item dates unavailable | Original source [S03] FAQ 3: Cash fund purpose / Couples who chose it table |
| Education or student loans | 6% | 2026 First Look planning cohort; exact item dates unavailable | Original source [S03] FAQ 3: Cash fund purpose / Couples who chose it table |
| Family planning | 5% | 2026 First Look planning cohort; exact item dates unavailable | Original source [S03] FAQ 3: Cash fund purpose / Couples who chose it table |
| Pet or future pet | 4% | 2026 First Look planning cohort; exact item dates unavailable | Original source [S03] FAQ 3: Cash fund purpose / Couples who chose it table |
| Hobby | 3% | 2026 First Look planning cohort; exact item dates unavailable | Original source [S03] FAQ 3: Cash fund purpose / Couples who chose it table |
| Charity | 2% | 2026 First Look planning cohort; exact item dates unavailable | Original source [S03] FAQ 3: Cash fund purpose / Couples who chose it table |
Several funds can serve the same couple. Adding these percentages would double-count people, and assigning the percentages to a money pot would change the measured unit. No amount raised, funding success rate or final allocation is inferred from the purpose list.
Do couples use registry funds to help pay for the wedding?
F10 Original narrative’s overall-planner summary and historical comparator. Different annual cohorts; exact matching item bases unavailable. Published 27% and historical 16% are not the conditional 33% purpose-table statistic.
| Measure / group | Published result | Actual cohort or report period | Source |
|---|---|---|---|
| 2026 planners: wedding-cost cash fund | 27% | 2026 wedding planners; exact interview dates unavailable | Original source [S04] Funding celebrations bullet: 27% versus 16% in 2025 |
| Published 2025 comparison: wedding-cost cash fund | 16% | 2025 comparison as reported in 2026 narrative; exact original n/dates unavailable | Original source [S04] Funding celebrations bullet: 27% versus 16% in 2025 |
The overall-planner narrative gives 27% for a wedding-cost fund in the 2026 cohort and 16% for its published 2025 comparator. The purpose table separately gives 33% in a cash-fund-user context. Exact question bases are unavailable, so both remain attached to their stated contexts. This resource does not multiply adoption by purpose rates to reconstruct an unreported total. Zola [S04]; Zola [S03].
For broader spending context, see our wedding cost and budget statistics. A registry request is a plan; a gift that has arrived is a receipt. Keep those amounts separate when building a wedding budget.
How do couples feel about asking for cash?
F11 Selected acceptability and concern statements from Zola’s original narrative. Exact item n/eligibility unavailable. Statements are not a complete distribution and do not measure guest payment behavior.
| Measure / group | Published result | Actual cohort or report period | Source |
|---|---|---|---|
| Asking for cash considered totally acceptable | 91% | 2026 publisher research; precise attitude-item fieldwork window unavailable | Original source [S05] The Verdict: 91%; How to Ask for Cash concern paragraph |
| Wanted to ask for cash but worried about judgment | 4% | 2026 publisher research; precise attitude-item fieldwork window unavailable | Original source [S05] The Verdict: 91%; How to Ask for Cash concern paragraph |
These two statements are not treated as a yes/no partition. Exact eligibility is unpublished, and concern about judgment can coexist with thinking that cash requests are acceptable. Neither statement tells us how guests actually pay.
What do Australian gift-option reports show?
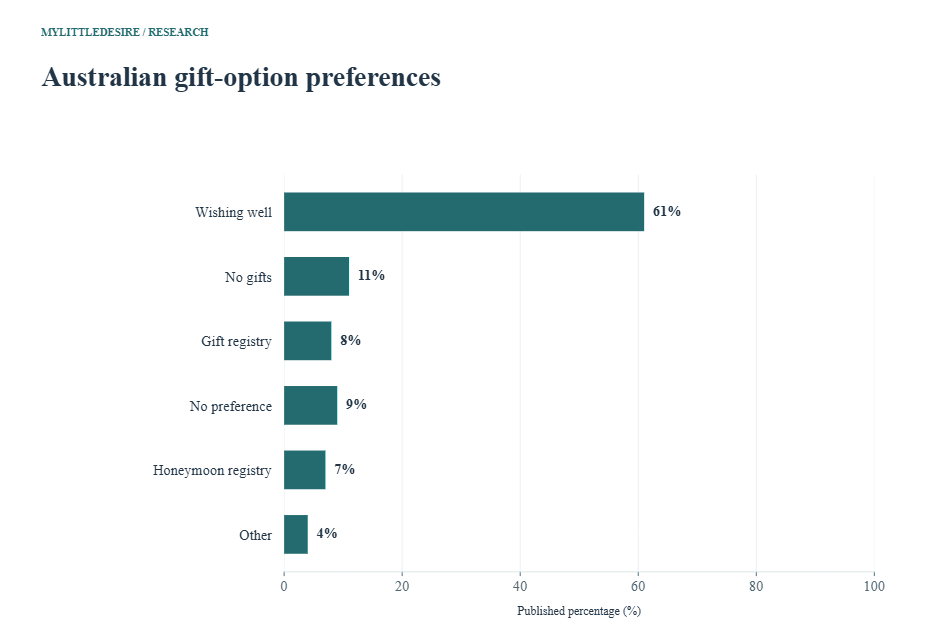
F12 Six source-defined gift-option categories. Unknown exact item n/window. Includes no gifts, no preference and other; 2025 asks a different three-option question. Not a harmonized trend.
| Measure / group | Published result | Actual cohort or report period | Source |
|---|---|---|---|
| Wishing well | 61% | 2026 report edition; engaged/recently married research, exact gift-item windows unavailable | Original source [S06] PDF physical/printed p.7, Gift Options Preferred by Couples |
| No gifts | 11% | 2026 report edition; engaged/recently married research, exact gift-item windows unavailable | Original source [S06] PDF physical/printed p.7, Gift Options Preferred by Couples |
| Gift registry | 8% | 2026 report edition; engaged/recently married research, exact gift-item windows unavailable | Original source [S06] PDF physical/printed p.7, Gift Options Preferred by Couples |
| No preference | 9% | 2026 report edition; engaged/recently married research, exact gift-item windows unavailable | Original source [S06] PDF physical/printed p.7, Gift Options Preferred by Couples |
| Honeymoon registry | 7% | 2026 report edition; engaged/recently married research, exact gift-item windows unavailable | Original source [S06] PDF physical/printed p.7, Gift Options Preferred by Couples |
| Other | 4% | 2026 report edition; engaged/recently married research, exact gift-item windows unavailable | Original source [S06] PDF physical/printed p.7, Gift Options Preferred by Couples |
F13 Three-option chart for the main gift option preferred. Exact item n/window unavailable. Narrower response options than 2026, including no explicit no-gifts category. No year-over-year adoption change inferred.
| Measure / group | Published result | Actual cohort or report period | Source |
|---|---|---|---|
| Wishing well | 90% | 2025 report edition, planning/spending research for 2025 and beyond; exact gift-item dates unavailable | Original source [S07] PDF physical/printed p.8, The Main Gift Option Preferred by Couples |
| Gift registry | 1% | 2025 report edition, planning/spending research for 2025 and beyond; exact gift-item dates unavailable | Original source [S07] PDF physical/printed p.8, The Main Gift Option Preferred by Couples |
| Honeymoon registry | 9% | 2025 report edition, planning/spending research for 2025 and beyond; exact gift-item dates unavailable | Original source [S07] PDF physical/printed p.8, The Main Gift Option Preferred by Couples |
The 2026 chart offers six options, including no gifts, no preference and other. The 2025 chart asks for a main option among three categories. The apparent 90% versus 61% wishing-well difference cannot establish a harmonized decline in cash gifting.
How much do Australian reports say is spent on gifts?
F14 Amounts printed for close friends/family and other relationships. Nominal Australian dollars. The panel does not specify mean/median, exact spend period, answering n or per-person versus household unit. Related gift-spend context, not registry receipts or a required contribution.
| Measure / group | Published result | Actual cohort or report period | Source |
|---|---|---|---|
| Close friends / family | A$380 | 2026 report edition; engaged/recently married research, exact gift-item windows unavailable | Original source [S06] PDF physical/printed p.7, What’s Being Spent on Wedding Gifts? |
| Other | A$203 | 2026 report edition; engaged/recently married research, exact gift-item windows unavailable | Original source [S06] PDF physical/printed p.7, What’s Being Spent on Wedding Gifts? |
F15 Amounts printed for close friends/family and other relationships. Nominal Australian dollars. The panel does not specify mean/median, exact spend period, answering n or per-person versus household unit. Related gift-spend context, not registry receipts or a required contribution.
| Measure / group | Published result | Actual cohort or report period | Source |
|---|---|---|---|
| Close friends / family | A$288 | 2025 report edition, planning/spending research for 2025 and beyond; exact gift-item dates unavailable | Original source [S07] PDF physical/printed p.8, What’s Being Spent on Wedding Gifts? |
| Other | A$159 | 2025 report edition, planning/spending research for 2025 and beyond; exact gift-item dates unavailable | Original source [S07] PDF physical/printed p.8, What’s Being Spent on Wedding Gifts? |
These are the report panels’ published Australian-dollar amounts. The panels do not identify a mean or median, the precise spend window, or whether the gift unit is one person or a household. They remain related context with those limits visible. No per-guest spending requirement or registry-revenue forecast is derived.
What does the UK public think about cash and gift amounts?
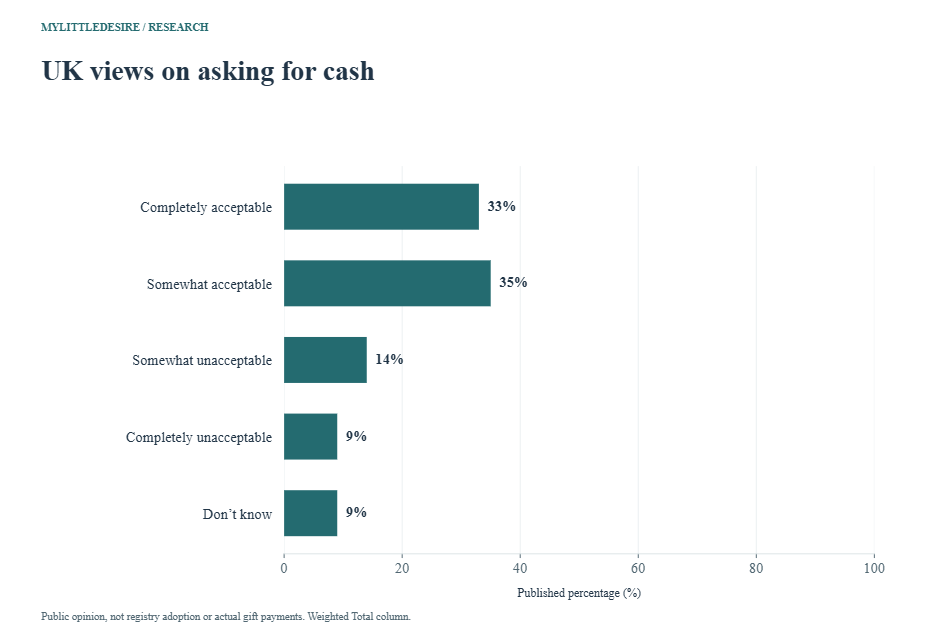
F16 Response distribution to asking for cash instead of gifts; weighted Total column. All UK adults n=1,784, not only engaged couples or wedding guests. Attitudes are not behavior or registry usage.
| Measure / group | Published result | Actual cohort or report period | Source |
|---|---|---|---|
| Completely acceptable | 33% | Fieldwork August 7–9, 2026 | Original source [S08] PDF physical/printed p.6, CoupleEtiquette_1a, Total |
| Somewhat acceptable | 35% | Fieldwork August 7–9, 2026 | Original source [S08] PDF physical/printed p.6, CoupleEtiquette_1a, Total |
| Somewhat unacceptable | 14% | Fieldwork August 7–9, 2026 | Original source [S08] PDF physical/printed p.6, CoupleEtiquette_1a, Total |
| Completely unacceptable | 9% | Fieldwork August 7–9, 2026 | Original source [S08] PDF physical/printed p.6, CoupleEtiquette_1a, Total |
| Don’t know | 9% | Fieldwork August 7–9, 2026 | Original source [S08] PDF physical/printed p.6, CoupleEtiquette_1a, Total |
F17 Shares selecting two spending brackets for very-close and not-so-close relationships. Opinion about the right gift amount, not actual spending. Four selected rows are not the full response distribution. Pounds describe the answer bands; values are percentages.
| Measure / group | Published result | Actual cohort or report period | Source |
|---|---|---|---|
| Very close: £26–50 | 17% | Fieldwork August 7–9, 2026 | Original source [S08] PDF physical/printed p.10, GiftSpend_1 / GiftSpend_2, Total |
| Very close: £76–100 | 22% | Fieldwork August 7–9, 2026 | Original source [S08] PDF physical/printed p.10, GiftSpend_1 / GiftSpend_2, Total |
| Not so close: £26–50 | 38% | Fieldwork August 7–9, 2026 | Original source [S08] PDF physical/printed p.10, GiftSpend_1 / GiftSpend_2, Total |
| Not so close: £76–100 | 5% | Fieldwork August 7–9, 2026 | Original source [S08] PDF physical/printed p.10, GiftSpend_1 / GiftSpend_2, Total |
YouGov’s selected questions use all UK adults, with a weighted and unweighted total base of 1,784. Fieldwork ran August 7–9, 2026. The gift-spending question asks what amount is right for a relationship category. The response bands are in pounds, but the table values are percentages of respondents choosing those bands. YouGov [S08].
How can couples use these findings?
Start with what you will use: household items, experiences and optional funds can serve different needs. Offer a range of gift prices or contribution amounts, describe a fund’s purpose clearly and let guests decide what fits their budget. These are planning suggestions, not tested claims that particular wording increases contributions.
Track requested items, purchases reported by the platform, gifts actually received and thank-you messages separately. A list can contain an unpurchased item; a funded experience can still be a cash transfer. Build essential wedding payments around money available by their due dates, and update records when a gift actually arrives.
Ten reproducible descriptive comparisons
The workbook calculates these ten differences from stable observation IDs. Each requires matching units and measure types. Percentage-point differences retain the underlying question context. The arithmetic reuses observations and adds no independent evidence.
| Comparison | First | Second | Difference | Qualification |
|---|---|---|---|---|
| The Knot: Gen Z minus overall registry creation | 89% | 82% | +7 percentage points | Subgroup versus overlapping overall sample; exact subgroup n unknown. |
| The Knot: large-wedding minus overall registry creation | 87% | 82% | +5 percentage points | Large-wedding threshold/base unavailable; descriptive contrast. |
| The Knot: bakeware minus cookware selections | 79% | 75% | +4 percentage points | Overlapping categories; not a sales-share difference. |
| The Knot: bath minus bedding selections | 73% | 69% | +4 percentage points | Same release; exact answering bases unknown. |
| Zola: kitchen/cookware minus tech selections | 78% | 25% | +53 percentage points | Same active-user table, n=555; nonexclusive choices. |
| Zola cash-fund users: travel minus home purpose | 86% | 39% | +47 percentage points | Intended purpose selections; not allocation of received money. |
| Zola wedding-cost funds: 2026 minus 2025 comparator | 27% | 16% | +11 percentage points | Two annual cohorts; exact item n unknown. No causal effect. |
| Australia 2026: wishing well minus gift registry preference | 61% | 8% | +53 percentage points | Within one six-option question; no 2025/2026 trend. |
| Australia 2026: close-circle minus other gift amount | A$380 | A$203 | +177 AUD | Two published amounts; mean/median and person/household unit unspecified. |
| UK cash requests: somewhat minus completely acceptable | 35% | 33% | +2 percentage points | Same public-opinion item; n=1,784; no guest behavior inferred. |
Common questions
Does 75% cash-fund inclusion mean 75% of gifts are cash?
No. It is a percentage of couples under the publisher’s registry question. Gifts, purchased items and received dollars require their own counts and denominators.
Are traditional gifts disappearing?
The selected studies report substantial physical-category selection alongside cash-fund inclusion. Different measures can coexist. These tables do not establish a universal shift away from every physical gift.
Why do Zola’s wedding-cost funds appear as both 27% and 33%?
The 27% comes from an overall-planner summary; the purpose table introduces couples with cash funds before reporting 33%. Exact item wording and bases are unpublished. Keep the stated contexts rather than treating the figures as the same rate.
Did Australian wishing-well use drop from 90% to 61%?
The annual reports use different response categories. The earlier three-option chart and later six-option chart do not establish a harmonized adoption trend.
How much should a guest spend?
These observations describe selected reports and public opinions, not a required gift. Decide based on your circumstances and relationship. The Australian panels also leave the per-person versus household unit unspecified.
Can gift amounts predict how much the wedding registry will raise?
No reliable forecast follows from these summaries. Household gifting, fulfillment, noncash items and receipt timing are not measured together. Multiplying guest count by a published amount would add unsupported assumptions.
Is there a Canadian national registry rate in this resource?
No original Canadian registry-specific national benchmark was verified in this selection. US-facing platform audiences and UK or Australian data are not relabelled as Canadian.
Research method and limitations
MyLittleDesire compiled selected original publisher releases, guides and survey tables. AI assisted retrieval, organization and drafting. This is a dated editorial compilation. It includes no original survey, respondent-level reanalysis, private transaction audit, exhaustive systematic review, pooled global estimate or causal gifting experiment. Selected Australian and UK PDF tables were visually checked.
The 63 observations comprise 59 percentages and four Australian-dollar gift-spend amounts, grouped into 17 findings. Eight numerical records represent four publisher labels: The Knot, Zola, Easy Weddings and YouGov. Zola contributes 25 observations across several pages and two named programs; The Knot contributes 16 from one study, Easy Weddings 13 across two editions, and YouGov nine from one survey. Documents and response categories are not independent studies.
- Eligibility: n=555 applies only to Zola’s active-user category table. The selected YouGov questions have n=1,784. Unknown exact question bases remain blank; full-study totals are not substituted.
- Timing: planning cohorts, report editions and measured fieldwork stay separate. A page update does not create new fieldwork.
- Comparability: overall samples, subgroups, conditional purpose selections, top preferences and public attitudes are distinct. No cross-platform league table or Australian preference trend is inferred.
- Definitions: Australian gift-spend panels lack mean/median and gift-unit definitions. Their amounts are not promoted to precise per-person means.
- Exclusions: ambiguous cash-allocation units, duplicate rounded figures, product prices, expert ranges and mutable service fees do not pad the observation count.
Original sources and supporting records
- S01. The Knot / The Knot Worldwide. The Knot Worldwide Releases 2026 Annual Registry Study. Publication: 2026-07-29. Actual period: Survey in May 2026; member wedding dates April 2025–December 2026. Full survey n=1,759. Exact registry-item, Gen Z, large-wedding and engaged-only bases not published. Large-wedding threshold not specified in this release. Method: First-party quantitative survey emailed to TKWW members. May 2026 collection confirmed in original companion cash-gift article. Selected adoption, household categories, hybrid/cash preferences and ease-of-use percentages read in the release. Commercial member sample, not a probability estimate of all US couples. Adoption, conditional registry selections and single top preference are different measures. Categories may overlap. Exact question wording and item bases unavailable. Cash-allocation figures excluded because respondent-versus-money weighting is unclear. Supporting records: record 1.
- S02. Zola. Wedding Registry Checklist. Publication: Updated 2026-06-05. Actual period: 2026 Registry & Gifting Survey; exact fieldwork dates unavailable. Published category table explicitly gives n=555 active registry users. Full survey total, selection details and interview dates not supplied here. Method: Original publisher table lists eight categories added by active registry users. Selected table values checked directly. Commercial selected audience. Category selections are nonexclusive and need not total 100%. Broad combined categories differ from The Knot’s narrower categories; do not compare platform performance from the percentages.
- S03. Zola. All You Need to Know About Creating a Wedding Registry for Money. Publication: Updated 2026-06-05. Actual period: 2026 First Look planning research for purposes; 2026 Registry & Gifting Survey for most-wanted item; exact fieldwork dates unavailable. Purpose table introduced as couples with cash funds, with exact eligible n unavailable. Separate 24% most-wanted result has no item base on the page. Do not assign the checklist’s n=555 to either. Method: Original publisher guide explicitly attributes cash-fund purposes to its 2026 First Look Report and the most-wanted cash-fund result to the 2026 Registry & Gifting Survey. Eleven purpose values transcribed, including wedding-cost help. Purpose selections overlap and measure intended uses, not money received or spent. Table’s conditional 33% wedding-cost purpose differs from the overall-planner 27% summary; exact item wording/bases unavailable, so no reconciliation, multiplication or contradiction test is claimed. Published rounded home-purpose 39% retained once, not again as press-release 38.9%. Supporting records: record 1.
- S04. Zola. 2026 Wedding Trends: Zola’s First Look Report. Publication: Report announced 2026-01-27; narrative updated 2026-10-16. Actual period: Planning-stage 2026 wedding cohort; one explicitly labelled 2025 comparison; exact interview dates unavailable. More than 11,500 couples planning 2026 weddings. Exact cash-fund question n and original 2025 comparison n unavailable. Method: Original narrative gives 27% wedding-cost cash funds and explicitly compares with 16% in 2025. Original Zola-issued January 27 press release confirms 87% include at least one cash fund; publisher cash guide clarifies have or plan to have. Intentions and current setup are combined, not final 2026 receipts or a national census. The 2025 point is a published historical comparator, not a newly verified 2025 microdata analysis. Do not equate 87% with share of gifts or dollars, or compare against The Knot as a time trend. Supporting records: record 1, record 2.
- S05. Zola. The New Wedding Registry: Why Couples Want Cash, in Addition to Traditional Gifts. Publication: Updated 2026-05-21. Actual period: 2026 publisher research; precise attitude-item fieldwork window unavailable. Page refers generally to First Look research/latest research; exact eligibility and base for the selected 91% and 4% not published. Method: Original narrative checked for cash-request acceptability and wanting to ask but worrying about judgment. Only those two selected attitudes counted; overlapping 87%, 27% and 16% appear elsewhere and are not counted again. Attitudes are not guests’ actual behavior, money received or a universal etiquette rule. The 91% and 4% are different statements and are not assumed to be a complete partition. Full planning sample not assigned to these items.
- S06. Easy Weddings. 2026 Australian Wedding Industry Report. Publication: 2026 report edition; exact release day not specified in PDF. Actual period: 2026 report edition; engaged/recently married research, exact gift-item windows unavailable. Report-wide more than 4,200 couples plus 540 businesses, marketplace data and community input. Exact gift-option/spend item n and respondent eligibility unavailable. Method: Original PDF foreword p.2 and physical/printed p.7 checked. Six gift-option categories and two published gift-spend amounts visually verified on the page. Commercial audience and report edition, not a completed-year national census. Six-option preference distribution differs from 2025 three-option question. Spend panel does not specify mean/median, exact time window or per-person versus household gift unit; values are labelled published amounts without filling those gaps.
- S07. Easy Weddings. 2025 Australian Wedding Industry Report. Publication: 2025 edition; exact PDF release day not stated. Actual period: 2025 report edition, planning/spending research for 2025 and beyond; exact gift-item dates unavailable. Report-wide more than 4,000 couples and 800 businesses plus spending/community input. Exact gift-option/spend question n unavailable. Method: Original PDF foreword p.2 and physical/printed p.8 checked. Three-color gift-option legend and two gift-spend figures visually verified. Preference options differ from 2026; no 90% to 61% harmonized trend inferred. Gift-spend amounts lack exact mean/median, dates and per-person/household unit. Not a registry transaction ledger or national estimate.
- S08. YouGov. Big Survey: Weddings — UK results tables. Publication: Results articles published 2026-08-27; table file dated August 2026. Actual period: Fieldwork August 7–9, 2026. Exact selected question base: all UK adults, n=1,784. Weighted and unweighted totals printed in each table. Subgroup bases not used. Method: Original YouGov tables: physical/printed p.6, CoupleEtiquette_1a; p.10, GiftSpend_1 and GiftSpend_2. Weighted Total column read and visually checked. Overview confirms dates and adult sample. Public opinion about acceptable requests and appropriate gift spending, not observed registry choices or paid amounts. Four selected spending brackets do not form the full distribution. Rounding applies; no income-subgroup or band-midpoint mean reconstructed. Supporting records: record 1, record 2.
Supporting records without additional observations
- R01. The Knot. The Best Ways to Give Money as a Wedding Gift. Updated July 9, 2026. Original methods cross-check. Footnote states May 2026 data collection, email recruitment and n=1,759 with wedding dates April 2025–December 2026. No duplicate count for the repeated 75% cash-fund value; no current processing-fee statistic adopted.
- R02. Zola. Zola-issued 2026 First Look announcement. January 27, 2026. Original issuer release distributed by PR Newswire. Confirms more than 11,500 surveyed couples and 87% including at least one cash fund. Home-fund figure 38.9% not counted again beside rounded 39%; no independent replication.
- R03. YouGov. The YouGov Big Survey on Weddings. August 27, 2026. Original overview and link to full tables. Identifies UK adults aged 18+, n=1,784 and fieldwork August 7–9, 2026. Selected exact table percentages used instead of invented band-midpoint averages.
- R04. YouGov. How should guests behave at a wedding?. August 27, 2026. Original narrative context for gift-spending opinions. Discusses relationship-specific ideas about appropriate gift spending. No reported income-subgroup percentages or derived cumulative shares added to observation count.
How to cite this resource
MyLittleDesire. Wedding Gift Registry Statistics 2027. https://mylittledesire.com/wedding-gift-registry-statistics/.