
Couples meet through friends, work, school, shared activities and many kinds of online contact. Which route appears most common depends on whose relationships a survey counts and when those relationships began.
What are the key findings about how couples meet?
32%
10%
of US partnered adults met their current partner through friends or family.October 2019 · All existing relationships.
of US partnered adults met their current partner through a dating site or app.July 2022 · Dating sites/apps only
39%
19%
was the smoothed online-meeting estimate for US different-sex couples meeting in 2017.Historical meeting-year endpoint · Overlapping routes. Source [S01]
of relationship-experienced British adults met their current or most recent partner at work.July 2026 · Current or most recent partner. Source [S04]
22%
11.7%
of British relationship-experienced adults ages 30–39 met their current or most recent partner through a dating app.July 2026 · Age at interview. Source [S04]
met through a dating website/app in the Australian partner-as-most-important subset.June 2022 · Restricted eligibility. Source [S05]
About one-third
50%
of The Knot’s responding 2025 newlyweds met through dating sites/apps.2025 wedding cohort · Commercial survey. Source [S07]
of US dating-site/app ever-users had ever formed a committed relationship with an online match.January 2026 · Lifetime experience among ever-users. Source [S09]
Which “how couples meet” statistic should you use?
| Question | Suitable measure | What to retain |
|---|---|---|
| How did people in existing relationships first meet? | Current-partner meeting survey | Survey date; inclusion of long-established relationships |
| How did relationships forming around a particular year start? | Meeting-year cohort estimate | Smoothing; retrospective sampling; overlapping routes |
| How did recently married respondents meet? | Newlywed survey | Wedding cohort; voluntary membership recruitment |
| Have dating-app users ever formed a relationship with a match? | Lifetime experience among ever-users | Ever-user denominator; no per-match success inference |
| Does “online” mean a dating app? | Check the question wording | Social media, forums and gaming can be included in broad online contact |
People who are currently single can report how they met a previous partner. People in long-standing relationships may describe introductions that happened before dating apps existed. For relationship-status definitions, see our singles and singlehood research.
How do couples in the United States meet?
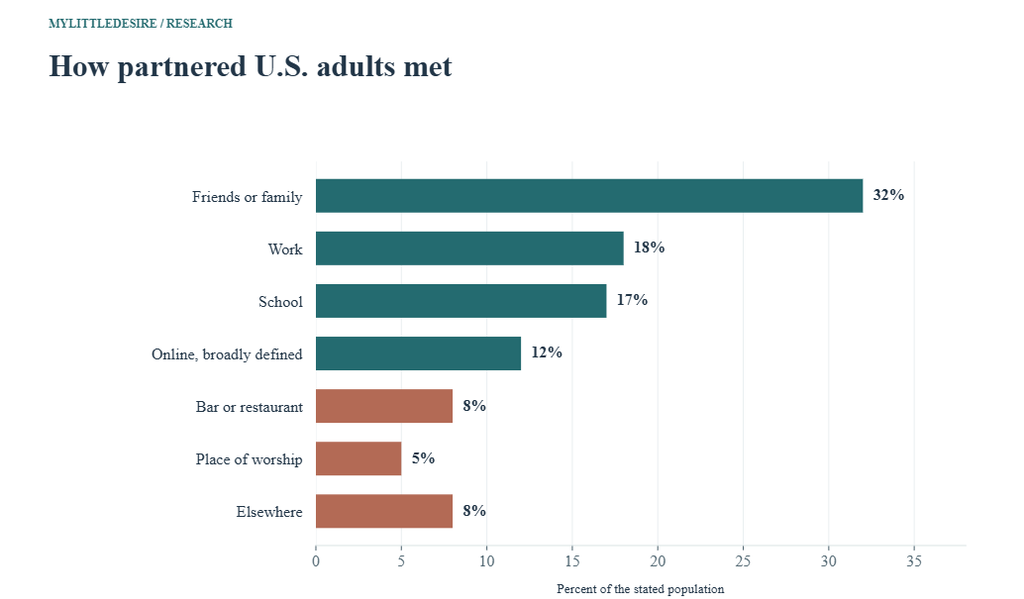
In Pew’s October 2019 survey, introductions through friends or family led the responses from partnered adults. That snapshot covers relationships of many durations. It should not be described as a ranking of new relationships beginning today.
F01 First meeting with the current partner; one route per respondent. A dated snapshot of existing relationships, including long-standing couples.
| Measure / group | Reported result | Actual period | Source |
|---|---|---|---|
| Friends or family | 32% | 2019-10-16 to 2019-10-28 | Original source [S02] |
| Work | 18% | 2019-10-16 to 2019-10-28 | Original source [S02] |
| School | 17% | 2019-10-16 to 2019-10-28 | Original source [S02] |
| Online, broadly defined | 12% | 2019-10-16 to 2019-10-28 | Original source [S02] |
| Bar or restaurant | 8% | 2019-10-16 to 2019-10-28 | Original source [S02] |
| Place of worship | 5% | 2019-10-16 to 2019-10-28 | Original source [S02] |
| Elsewhere | 8% | 2019-10-16 to 2019-10-28 | Original source [S02] |
On smaller screens, scroll charts and tables sideways to read their labels.
Introductions are one role that social networks can play. Our friendship statistics resource covers friendship size, contact and support, which are separate measures.
Where online do couples first connect?
The internet is a collection of settings. Pew asked people who had met their current partner online where the first contact occurred. The resulting shares describe that online-meeting subset.
F07 Setting of first online contact, conditional on having met the current partner online. These percentages use the online-meeting subset, not all partnered adults. Selected categories omit email and residual responses.
| Measure / group | Reported result | Actual period | Source |
|---|---|---|---|
| Dating site or app | 61% | 2019-10-16 to 2019-10-28 | Original source [S02] |
| Social media | 21% | 2019-10-16 to 2019-10-28 | Original source [S02] |
| Discussion forum | 10% | 2019-10-16 to 2019-10-28 | Original source [S02] |
| Texting or messaging app | 3% | 2019-10-16 to 2019-10-28 | Original source [S02] |
| Online gaming | 3% | 2019-10-16 to 2019-10-28 | Original source [S02] |
Trying an app, using one currently and meeting a partner through it are separate outcomes. Our online dating and dating app statistics hub focuses on platform use and users’ experiences.
How do age and community relate to online introductions?
Younger partnered respondents were more likely to report online first contact in the 2019 Pew survey. These are comparisons between age groups at interview. Current place of residence also need not be the place where someone first met a partner.
F03 Share who first met their current partner online; age at interview. Cross-sectional age differences, not evidence of change as individuals age.
| Measure / group | Reported result | Actual period | Source |
|---|---|---|---|
| Ages 18–29 | 21% | 2019-10-16 to 2019-10-28 | Original source [S02] |
| Ages 30–49 | 15% | 2019-10-16 to 2019-10-28 | Original source [S02] |
| Ages 50–64 | 8% | 2019-10-16 to 2019-10-28 | Original source [S02] |
| Ages 65+ | 5% | 2019-10-16 to 2019-10-28 | Original source [S02] |
F04 Share who met online, grouped by current place of residence. Residence is measured at interview and may differ from where the relationship began.
| Measure / group | Reported result | Actual period | Source |
|---|---|---|---|
| Urban residents | 14% | 2019-10-16 to 2019-10-28 | Original source [S02] |
| Suburban residents | 14% | 2019-10-16 to 2019-10-28 | Original source [S02] |
| Rural residents | 8% | 2019-10-16 to 2019-10-28 | Original source [S02] |
How do meeting patterns differ for LGB adults?
Pew reports respondent sexual orientation. A partnered bisexual respondent may have a different-sex partner, so these results do not describe only same-sex couples.
F05 Current-partner meeting routes by respondent sexual orientation. LGB identity is not the same as being in a same-sex relationship.
| Measure / group | Reported result | Actual period | Source |
|---|---|---|---|
| LGB respondents: online | 28% | 2019-10-16 to 2019-10-28 | Original source [S02] |
| LGB respondents: friends/family | 24% | 2019-10-16 to 2019-10-28 | Original source [S02] |
| Straight respondents: online | 11% | 2019-10-16 to 2019-10-28 | Original source [S02] |
F06 Current partner first met online within orientation and age groups. Historical respondent-identity subgroups; eligible n and intervals not supplied.
| Measure / group | Reported result | Actual period | Source |
|---|---|---|---|
| LGB adults under 40 | 32% | 2019-10-16 to 2019-10-28 | Original source [S02] |
| Straight adults under 40 | 17% | 2019-10-16 to 2019-10-28 | Original source [S02] |
What share of current partners met through dating sites or apps?
Pew’s July 2022 survey asked specifically about dating sites and apps. Its narrower question should retain its own wording when compared with the broader 2019 online-contact question.
F08 Dating-site/app first contact with current partner. App/site measure is narrower than any online setting. Each subgroup has its own denominator.
| Measure / group | Reported result | Actual period | Source |
|---|---|---|---|
| All partnered adults | 10% | 2022-07-05 to 2022-07-17 | Original source [S03] |
| Partnered adults ages 18–29 | 20% | 2022-07-05 to 2022-07-17 | Original source [S03] |
| Partnered LGB adults | 24% | 2022-07-05 to 2022-07-17 | Original source [S03] |
| Partnered straight adults | 9% | 2022-07-05 to 2022-07-17 | Original source [S03] |
Do newer relationships have different meeting patterns?
Relationship duration changes the population being described. In Pew’s 2019 survey, online introductions and friends/family introductions were close among respondents whose current relationship had lasted under three years.
F02 First-meeting routes within the relationship-duration subset. The 1-point difference between rounded values is not evidence of a significant lead.
| Measure / group | Reported result | Actual period | Source |
|---|---|---|---|
| Online | 28% | 2019-10-16 to 2019-10-28 | Original source [S02] |
| Friends or family | 27% | 2019-10-16 to 2019-10-28 | Original source [S02] |
How have meeting routes changed in the United States?
Rosenfeld, Thomas and Hausen combined HCMST survey accounts to examine the year partners met. Their historical endpoints are smoothed estimates. Multiple codes can describe one meeting story.
| Route | 1995 | 2017 | Source |
|---|---|---|---|
| F09 Online | 2% | 39% | Table 1 [S01] |
| F10 Friends | 33% | 20% | Table 1 [S01] |
| F11 Family | 15% | 7% | Table 1 [S01] |
| F12 Coworkers / work | 19% | 11% | Table 1 [S01] |
| F13 Bar or restaurant | 19% | 27% | Table 1 [S01] |
| F14 Primary / secondary school | 10% | 5% | Table 1 [S01] |
| F15 Church | 7% | 4% | Table 1 [S01] |
| F16 Neighbors | 8% | 3% | Table 1 [S01] |
| F17 College | 9% | 4% | Table 1 [S01] |
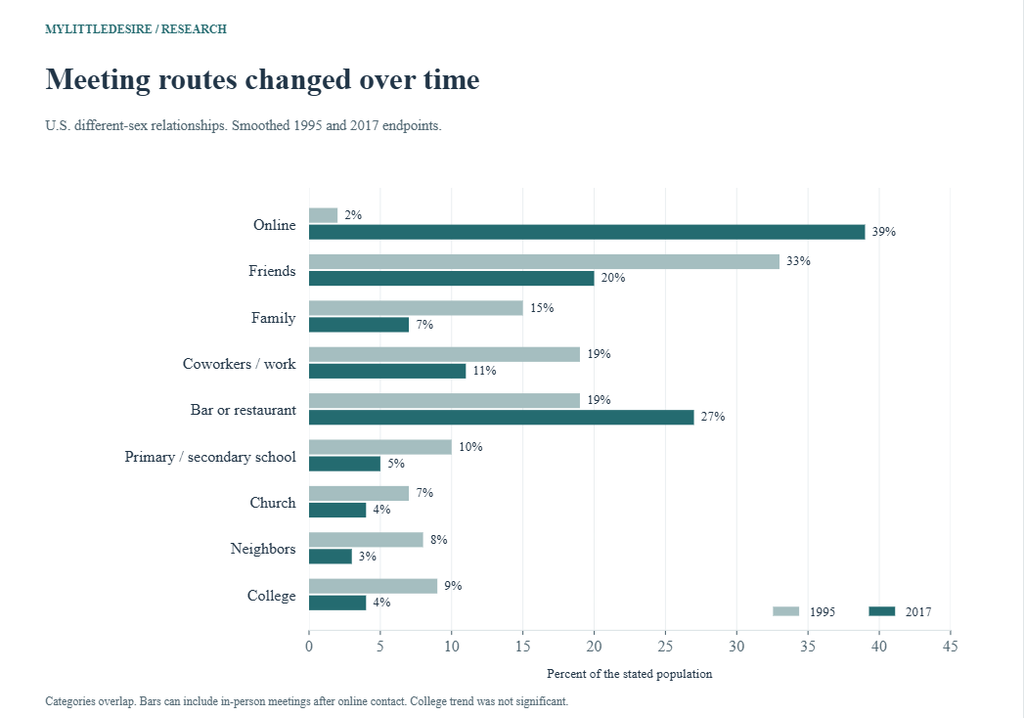
The widely shared updated HCMST graph also needs its meeting-year definition and sampling notes. This report does not convert its visual endpoint into a universal current or 2027 percentage.
How do British couples meet?
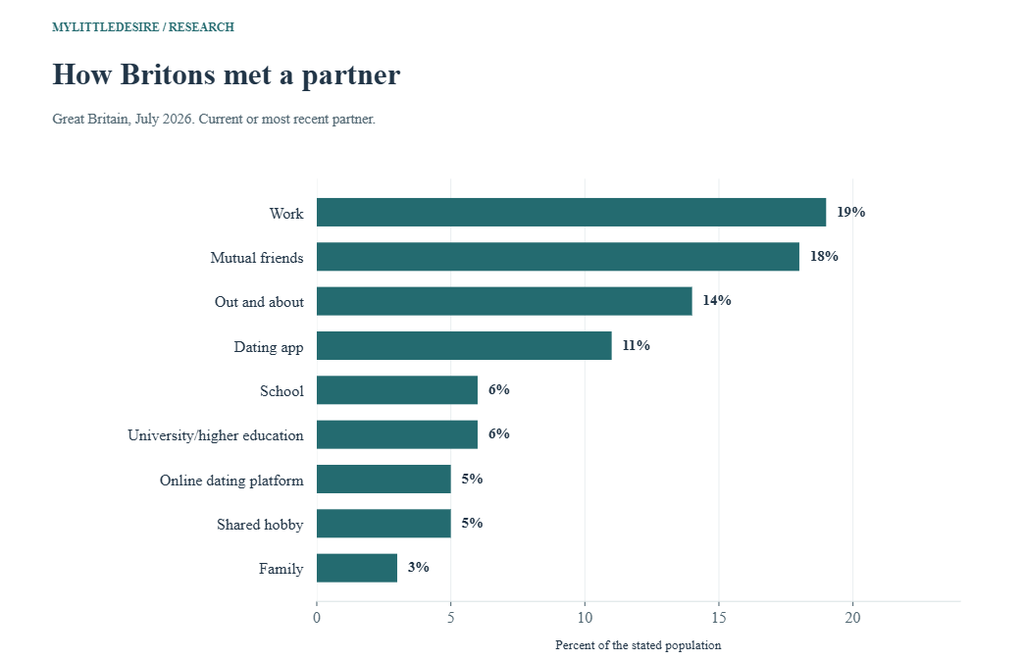
YouGov’s July 2026 poll asked relationship-experienced adults in Great Britain about their current or most recent partner. Work and mutual friends were the largest listed routes. This population includes some people who were single when surveyed.
F18 Best-fitting single first-meeting route for current or most recent partner. Rounded percentages can miss 100%; a published 0% is not proof of no respondents.
| Measure / group | Reported result | Actual period | Source |
|---|---|---|---|
| Work | 19% | 2026-07-09 to 2026-07-10 | Original source [S04] |
| Mutual friends | 18% | 2026-07-09 to 2026-07-10 | Original source [S04] |
| Out and about | 14% | 2026-07-09 to 2026-07-10 | Original source [S04] |
| Dating app | 11% | 2026-07-09 to 2026-07-10 | Original source [S04] |
| School | 6% | 2026-07-09 to 2026-07-10 | Original source [S04] |
| University/higher education | 6% | 2026-07-09 to 2026-07-10 | Original source [S04] |
| Online dating platform | 5% | 2026-07-09 to 2026-07-10 | Original source [S04] |
| Shared hobby | 5% | 2026-07-09 to 2026-07-10 | Original source [S04] |
| Family | 3% | 2026-07-09 to 2026-07-10 | Original source [S04] |
| In-person dating event | 0% | 2026-07-09 to 2026-07-10 | Original source [S04] |
| Other | 10% | 2026-07-09 to 2026-07-10 | Original source [S04] |
| Cannot recall / prefer not to say | 3% | 2026-07-09 to 2026-07-10 | Original source [S04] |
F19 Share first meeting current/most recent partner through an app, within age group. Age at interview, not meeting age; cohort and relationship duration are not held constant.
| Measure / group | Reported result | Actual period | Source |
|---|---|---|---|
| Ages 18–29 | 16% | 2026-07-09 to 2026-07-10 | Original source [S04] |
| Ages 30–39 | 22% | 2026-07-09 to 2026-07-10 | Original source [S04] |
| Ages 40–49 | 14% | 2026-07-09 to 2026-07-10 | Original source [S04] |
| Ages 50–59 | 9% | 2026-07-09 to 2026-07-10 | Original source [S04] |
| Ages 60+ | 3% | 2026-07-09 to 2026-07-10 | Original source [S04] |

What does Australian research show about meeting a partner?
Relationships Australia’s 2022 fact sheet specifies that the meeting question went only to respondents who named their partner as their most important relationship. Retaining that restriction avoids presenting the chart as a result for every Australian or every partnered Australian.
F20 Selected values from the fact sheet’s meeting-setting chart. Eligibility is narrower than all partnered adults. Friends/family value is withheld because the chart and headline disagree. Routes must not be summed.
| Measure / group | Reported result | Actual period | Source |
|---|---|---|---|
| Social event/venue | 18.8% | 2022-06-14 to 2022-06-27 | Original source [S05] |
| Work | 15.7% | 2022-06-14 to 2022-06-27 | Original source [S05] |
| Educational setting | 14% | 2022-06-14 to 2022-06-27 | Original source [S05] |
| Dating website/app | 11.7% | 2022-06-14 to 2022-06-27 | Original source [S05] |
The original fact sheet gives inconsistent friends/family figures in its chart and headline. That route is excluded here pending clarification. The selected figures above come from the chart; the 2024 report does not supply a verified replacement for them in this compilation.
What does the Canadian study tell us?
Qian and Hu analyzed a selected sample from a 2018 Canadian survey. The study restricted relationship dates and types, excluded some migration histories and oversampled immigrants. Its descriptive figures are useful for understanding that study sample.
F21 Table 1 descriptives for the selected 795-respondent sample. Immigrants were oversampled; these are sample descriptives, not national prevalence. Offline total contains the three offline subcategories.
| Measure / group | Reported result | Actual period | Source |
|---|---|---|---|
| All offline routes | 82.5% | 2018 survey; selected relationships formed in 1996–2018 | Original source [S06] |
| Offline formal institutions | 38% | 2018 survey; selected relationships formed in 1996–2018 | Original source [S06] |
| Offline social ties | 29.8% | 2018 survey; selected relationships formed in 1996–2018 | Original source [S06] |
| Other offline routes | 14.7% | 2018 survey; selected relationships formed in 1996–2018 | Original source [S06] |
| Online | 17.5% | 2018 survey; selected relationships formed in 1996–2018 | Original source [S06] |
F22 Breakdown within the 139 online-meeting respondents. Not a percentage of all Canadian couples or all 795 eligible study participants.
| Measure / group | Reported result | Actual period | Source |
|---|---|---|---|
| Dating sites/apps | 68% | 2018 survey; selected relationships formed in 1996–2018 | Original source [S06] |
| Other online venues | 32% | 2018 survey; selected relationships formed in 1996–2018 | Original source [S06] |
The offline total includes the three offline subcategories. Adding those rows to the total would count the same respondents again. The study sample does not establish a national online-meeting prevalence for all Canadians.
How did recently married couples meet?
Newlywed surveys start with people who married. Their results describe how those responding couples first met, often years before the wedding. They cannot show what proportion of all dating-app users will marry.
F23 How responding 2025 newlyweds first met their partner. Wedding year is not meeting year. Voluntary commercial membership sample. Approximate fraction retained as published.
| Measure / group | Reported result | Actual period | Source |
|---|---|---|---|
| Dating sites/apps | About one-third | Couples married 2025-01-01 to 2025-12-31 | Original source [S07] |
| Friends | 14% | Couples married 2025-01-01 to 2025-12-31 | Original source [S07] |
| School | 12% | Couples married 2025-01-01 to 2025-12-31 | Original source [S07] |
F24 Selected country-specific first-meeting routes in the 2024 newlywed cohort. Commercial, self-selected country samples with different route categories. No global mean or country ranking is calculated.
| Measure / group | Reported result | Actual period | Source |
|---|---|---|---|
| US: dating app | 27% | Couples married 2024-01-01 to 2024-12-31 | Original source [S08] |
| UK: dating app | 33% | Couples married 2024-01-01 to 2024-12-31 | Original source [S08] |
| Mexico: work connections | 23% | Couples married 2024-01-01 to 2024-12-31 | Original source [S08] |
| India: arranged marriage | 24% | Couples married 2024-01-01 to 2024-12-31 | Original source [S08] |
The Knot Worldwide recruited these respondents through membership platforms and social media. Its UK newlywed app share and YouGov’s British current/most-recent-partner app share concern different populations and periods.
Have dating-app users ever formed committed relationships with a match?
SSRS measured a lifetime experience among people who had ever used dating sites/apps. A respondent could have had such a relationship years earlier and be single at interview.
F25 Lifetime experience, not a current-couple share or per-attempt success rate. 2024 and 2026 are separate cross-sectional samples; no new significance test.
| Measure / group | Reported result | Actual period | Source |
|---|---|---|---|
| 2026 ever-users | 50% | 2026-01-02 to 2026-01-04 and 2026-01-16 to 2026-01-20 | Original source [S09] |
| 2024 ever-users | 42% | 2024-01-05 to 2024-01-07 and 2024-01-19 to 2024-01-21 | Original source [S09] |
F26 Ever forming a committed relationship with an online match, among ever-users in each income group. Descriptive association. Income-specific bases/intervals unavailable; not proof that income causes relationship formation.
| Measure / group | Reported result | Actual period | Source |
|---|---|---|---|
| Household income $75,000+ | 58% | 2026-01-02 to 2026-01-04 and 2026-01-16 to 2026-01-20 | Original source [S09] |
| Household income under $50,000 | 44% | 2026-01-02 to 2026-01-04 and 2026-01-16 to 2026-01-20 | Original source [S09] |
These results do not establish a success rate per message, match or date, and the income comparison does not identify a causal effect.
Which comparisons can readers reproduce?
Each calculation below subtracts compatible published percentages within a source. The unit is percentage points. Differences between rounded or smoothed estimates are descriptive; this report adds no significance tests.
| Comparison | First value | Second value | Difference | Interpretation |
|---|---|---|---|---|
| Online: 2017 minus 1995 | 39% | 2% | +37 points | Smoothed descriptive endpoints; not a new significance test. |
| Friends: 2017 minus 1995 | 20% | 33% | -13 points | Smoothed descriptive endpoints; not a new significance test. |
| Family: 2017 minus 1995 | 7% | 15% | -8 points | Smoothed descriptive endpoints; not a new significance test. |
| Coworkers/work: 2017 minus 1995 | 11% | 19% | -8 points | Smoothed descriptive endpoints; not a new significance test. |
| Bar or restaurant: 2017 minus 1995 | 27% | 19% | +8 points | Overlapping online/venue coding; not evidence of initial offline bar growth. |
| Primary/secondary school: 2017 minus 1995 | 5% | 10% | -5 points | Smoothed descriptive endpoints; not a new significance test. |
| Church: 2017 minus 1995 | 4% | 7% | -3 points | Smoothed descriptive endpoints; not a new significance test. |
| Neighbors: 2017 minus 1995 | 3% | 8% | -5 points | Smoothed descriptive endpoints; not a new significance test. |
| College: 2017 minus 1995 | 4% | 9% | -5 points | Arithmetic only; published trend was not statistically significant. |
| US online meeting: ages 18–29 minus 65+ (2019) | 21% | 5% | +16 points | Different age groups at interview; no causal/aging interpretation. |
| GB dating-app meeting: ages 30–39 minus 60+ (2026) | 22% | 3% | +19 points | Different age groups at interview; not a within-person trend. |
| US ever-user committed-relationship experience: 2026 minus 2024 | 50% | 42% | +8 points | Separate cross-sectional samples; no new significance test. |
Common questions about how couples meet
What is the most common way couples meet?
The answer depends on the survey population. Historical meeting-year studies, surveys of current relationships and newlywed surveys answer different questions. Choose the source that matches the relationship stage you are describing.
Does “met online” always mean a dating app?
No. Depending on the study, online contact can include social media, discussion forums, messaging and gaming. Keep the source’s category wording.
Can several meeting routes describe the same couple?
Yes in some studies. HCMST can code online contact, a social introduction and a later physical venue in the same meeting story. Other surveys ask for a single best-fitting route.
Does meeting through an app mean the relationship is more likely to last?
Meeting-route prevalence alone cannot answer that. Comparing relationship durability requires outcome studies with appropriate follow-up, controls and definitions.
Are these measurements from 2027?
The title identifies the editorial edition prepared in November 2026. The displayed surveys and relationship cohorts retain their actual historical dates; no future observations were created.
Methodology and limitations
MyLittleDesire selected original survey releases, questionnaires, methods and research tables that report where partners first met. The compilation is a focused editorial synthesis, not a systematic review or newly fielded survey. AI assisted source retrieval, organization and drafting; selected published aggregates were checked against the original records. Respondent microdata were not independently reanalyzed.
The 87 observations are organized into 26 findings from nine contributing source records. Category values, subgroup values and dated comparisons count as observations. Key cards, charts and the 12 derived differences repeat evidence and do not increase that count. The Knot’s verbal one-third result remains approximate, with no invented exact percentage.
- Sampling: probability-based surveys, a weighted YouGov poll, a restricted Canadian analytic sample and voluntary wedding-platform surveys are identified separately.
- Dates: a publication year, survey year, meeting year and wedding year can all differ.
- Eligible bases: full-sample totals are not subgroup sample sizes. Missing item bases and intervals remain unspecified.
- Categories: overlapping routes are never normalized into a pie chart. Offline subtotals are not added to their total.
- Interpretation: no pooled world estimate, causal claim, personal success probability or statistically tested country ranking was calculated.
- Coverage: the main evidence concerns the US, Great Britain, Australia and a selected Canadian sample; additional commercial wedding context includes the UK, Mexico and India.
Original sources and research notes
- S01. Rosenfeld, Thomas & Hausen / PNAS. Disintermediating your friends: How online dating in the United States displaces other ways of meeting. Publication: 2019-08-20. Actual period: HCMST 2009 and 2017; smoothed meeting-year endpoints 1995 and 2017. Overall study n=5,421. Two national HCMST surveys; coded retrospective meeting accounts. Table 1 reports unweighted smoothed point estimates, not raw annual prevalence. Routes overlap. Online includes more than apps. Bar/restaurant coding can include the first in-person encounter following online contact. Pooled N is not a 2017-year base. College trend was not statistically significant. Contributes 18 observations. Supporting records: record 1, record 2.
- S02. Pew Research Center. A profile of single Americans. Publication: 2020-08-20. Actual period: 2019-10-16 to 2019-10-28. Overall study n=4,860. Selected overall eligible base=2,932; subgroup eligibility may differ. Weighted probability-based panel survey, with LGB oversampling. PARTNERMEET n=2,932; conditional ONMEET n=506. All current relationships include long-established couples. Subgroup bases and intervals are not supplied beside selected estimates. LGB is respondent identity and includes people with different-sex partners. Contributes 26 observations. Supporting records: record 1, record 2.
- S03. Pew Research Center. The who, where and why of online dating in the U.S.. Publication: 2023-02-02. Actual period: 2022-07-05 to 2022-07-17. Overall study n=6,034. Weighted ATP/KnowledgePanel probability-based sample, including 1,038 LGB oversample respondents. Full-sample margin is ±2.0 percentage points. Question concerns dating sites/apps, unlike the broader online category in S02. Exact partnered and selected subgroup bases were not recovered. Overall sample size/margin must not be assigned to these subsets. Contributes 4 observations. Supporting records: record 1.
- S04. YouGov. The YouGov Big Survey on Relationships. Publication: 2026-08-17. Actual period: 2026-07-09 to 2026-07-10. Overall study n=1,882. Selected overall eligible base=1,684; subgroup eligibility may differ. Published weighted YouGov survey. Meeting question asks respondents to choose the best-fitting single option. PDF physical pages 7–8. Includes previous partners of unpartnered respondents. Age is age at interview, not age when meeting. Age-specific eligible bases are not printed. Whole percentages, including 0%, are rounded. Probability recruitment was not established for this survey. Contributes 17 observations. Supporting records: record 1, record 2.
- S05. Relationships Australia / Social Research Centre. Relationship Indicators 2022: Partnered relationships. Publication: 2022 (report edition). Actual period: 2022-06-14 to 2022-06-27. Overall study n=3,140. Life in Australia probability-based panel, online/phone, weighted to national adult benchmarks. The fact sheet expressly limits the meeting question to the partner-as-most-important subset. Not all Australian adults or all partnered adults. Item base unavailable. The friends/family graph (28%) conflicts with the headline (28.8%); that figure is withheld. Selected values are taken from the graph. Response exclusivity was not established; do not sum routes. Contributes 4 observations. Supporting records: record 1, record 2.
- S06. Yue Qian & Yang Hu / Journal of Marriage and Family. How couples meet and assortative mating in Canada. Publication: Online 2024-02-12; 2025 journal issue. Actual period: 2018 survey; selected relationships formed in 1996–2018. Overall study n=1,700. Selected overall eligible base=795; subgroup eligibility may differ. Random-digit-dial national phone survey with immigrant oversampling. Table 1 descriptives use 795 eligible respondents; the online-meeting subgroup has 139. Descriptive percentages refer to the selected sample, which is 50.6% immigrant, and are not population estimates for all Canadians. Excludes relationships formed before migration to Canada and missing covariates. Table 1 base precedes outcome-specific deletions. Contributes 7 observations.
- S07. The Knot. The Knot Real Weddings Study 2026. Publication: 2026 (report edition). Actual period: Couples married 2025-01-01 to 2025-12-31. Overall study n=10,474. Voluntary membership-based annual survey; methodology on report page 02 and meeting findings in Dating & Pre-Engagement. Commercial survey of respondents, not a probability sample of all couples or singles. Meeting generally occurred before the wedding year. The leading result is published as one-third; no exact percentage is supplied. The report also uses ad hoc research; item-specific n is not stated. Contributes 3 observations.
- S08. The Knot Worldwide. 2025 Global Wedding Report. Publication: 2025-08-13. Actual period: Couples married 2024-01-01 to 2024-12-31. Overall study n=33,174. Report covers 33,174 respondents across eight countries: 16,956 US and 16,218 international. Selected country-specific meeting routes are from the original publisher release. Country bases except the US total are not supplied here. Nonprobability commercial sample. Different countries’ top routes are not a comparable global ranking. UK newlyweds differ from the GB current/most-recent-partner population. Contributes 4 observations.
- S09. SSRS. The Public and Online Dating 2026. Publication: 2026-02-02. Actual period: 2026-01-02 to 2026-01-04 and 2026-01-16 to 2026-01-20; selected January 2024 comparison. Overall study n=2,012. Selected overall eligible base=772; subgroup eligibility may differ. Probability-based SSRS Opinion Panel Omnibus, online/phone. SPOT13 asks about ever having a committed relationship with someone met on a site/app. The 2024 comparison has overall n=2,011 and eligible n=772. Lifetime experience among ever-users, not the share of all current couples or success per match. Separate cross-sectional samples. Income-specific bases/intervals are unavailable. No new significance or causal test. Contributes 4 observations. Supporting records: record 1, record 2.
How to cite this resource
MyLittleDesire. How Couples Meet Statistics 2027. 2027 editorial edition https://mylittledesire.com/how-couples-meet-statistics/.