
Casual dating statistics are easy to misquote. Being in a casual relationship, wanting casual dates, having casual sex and being open to commitment describe different things. This resource brings original studies together with their actual dates, populations and definitions, then explains what can be compared.
What does a casual-dating statistic actually measure?
Check the question, eligible population, reference period, response format and denominator before comparing percentages. The distinctions below explain why a headline number alone is insufficient.
| Term | What it measures | Interpretation |
|---|---|---|
| Casual dating | A study’s wording for dating without an identified committed partnership. | May involve sex, several partners or neither. Do not impose one universal definition. |
| Casual sex / hookup | A source-defined sexual connection without a committed romantic relationship. | Different from merely going on casual dates; retain the behavior and reference period asked. |
| Friends with benefits | A sexual connection with someone known, without romantic attachment in Q114. | Not identical to strangers, one-night stands or all casual dating. |
| Nonexclusive committed relationship | A committed relationship that permits other partners by agreement. | Commitment and exclusivity are separate dimensions; this is not automatically casual. |
| Current behavior / preferred arrangement | What someone reports doing now versus what they are seeking or consider ideal. | Being open to commitment does not mean a current casual connection has become committed. |
| Main / major / minor reason | One principal answer versus intensity ratings for several possible motives. | Do not compare unlike formats as a trend or treat multiple major motives as exclusive classes. |
| Normality / approval / justifiability | Different attitude questions and response thresholds. | Opinions do not measure behavior, consent, safety, relationship success or personal hypocrisy. |
| All cases / nonmissing cases | All survey records versus cases with a recorded answer to a selected module. | System-missing is not no. A denominator change can change a percentage while counts stay fixed. |
| Enriched sample | Recruitment deliberately increases the representation of a target subgroup. | Its final percentage cannot be presented as a national rate or growth from the prescreen. |
| Percentage points / scale points / rho | Different units for percentage gaps, questionnaire means and correlations. | Keep their units, denominators and uncertainty; scale means and correlations are not percentages. |
Key casual dating findings
4%
7% / 22%
Selected a current casual relationship.YouGov May 2026; US adult citizens; n=1,107
YouGov America ·
Singles wanted casual-only dates / were open to either casual dates or commitment.Pew July 2022; singles n=2,231; preferences, not behavior
Pew Research Center ·
40% / 24%
19%
Past-year users rated casual dates / casual sex a major app-use reason.Pew July 2022; n=951; multiple motives allowed
Pew Research Center
Rated both casual dates and a long-term partner as major reasons.Pew’s measured joint response; no inferred overlap
Pew Research Center ·
10.6%
26.2%
Sought casual dating without a committed relationship.2026 US opt-in codebook; n=4,952
Match / Kinsey Institute ·
Selected known casual/FWB partners among nonmissing sexual-module cases.Calculation C13: 932 / 3,560; printed all-case share 18.8%
Match / Kinsey Institute ·
8%
82.3% / 16.8%
Named casual sex as their one main app-use reason.SSRS January 2026; ever-users n=772; differs from major reason
SSRS ·
Current daters sought long-term partnership / a one-night or sexual relationship.Nanos December 2025; only n=77; multiple choices
Nanos Research / The Globe and Mail ·
87% / 77%
26.1% / 42.9%
Saw the male life-path scenario as normal / approved of it.C16/C18: sums of rounded categories; US citizens, May 2026
YouGov America ·
Study 2 prescreen / deliberately enriched final sample sexually active.March 2023 convenience study; not a national trend
Amarakoon, Latimer, MacDonald and Dawson / Personal Relationships ·
66% / 19%
41% / 42%
UK adults 18–24 / 65+ rated casual sex justifiable.2022 WVS; scores 8–10; unweighted subgroup n=199 / 835
King’s College London Policy Institute / World Values Survey / Ipsos ·
UK cross-section / Great Britain trend endpoint met that threshold.Different geography in the same 2022 analysis; not a rounding correction
King’s College London Policy Institute / World Values Survey / Ipsos
How common is casual dating, and who is looking for it?
There is no single interchangeable casual-dating percentage. YouGov’s May 2026 citizen poll found 4% currently in a casual relationship. Pew’s October 2019 question found 13% among study-defined singles, a narrower population. Neither is the share who want only casual dates: Pew’s July 2022 single-population figure for that preference was 7%, with another 22% open to either casual dates or commitment. Those different bases and questions prevent a simple time-trend claim.
| ID | Finding and qualification | Population, actual period and base | Original source and locator |
|---|---|---|---|
| F33 | 4% selected being in a casual relationship currently; 48% reported a past casual relationship excluding their current one. Definition: Q4 current status versus Q5 prior adult-life history, different time windows. Qualification: Different questions and windows; do not subtract these into a transition, failure or retention rate. Citizens only; the poll does not define every respondent’s meaning of casual. | US adult CITIZENS; full poll n=1,107 United States 2026-05-22 to 2026-05-25 Published eligible item/group base(s): 1,107. An overall report n is not a subgroup base. | YouGov America Published 2026 original release; exact publication day not established Original tables physical pp.1–2, Q4–5 Study methods and limits |
| F01 | Among singles, 7% wanted casual dates only, 22% either casual dates or a committed relationship, 13% a committed relationship only and 57% neither. Definition: SEEKING; single means neither married, cohabiting nor in a committed relationship. Qualification: July 2022 fieldwork. Several motives can apply to one person; major reason is not the one main reason or actual casual behavior. | US study-defined singles, n=2,231 United States 2022-07-05 to 2022-07-17 Published eligible item/group base(s): 2,231. An overall report n is not a subgroup base. | Pew Research Center Published 2023-02-02; singles analysis 2023-02-08 Singles topline physical p.1, SEEKING Study methods and limits |
| F09 | 13% of study-defined singles were currently casually dating someone. Definition: CASUAL; current self-reported dating behavior. Qualification: Historical October 2019 data, not a current or 2027 rate. Keep behavior, seeking preferences and opinions separate. | US singles, CASUAL base n=1,918 United States 2019-10-16 to 2019-10-28 Published eligible item/group base(s): 1,918. An overall report n is not a subgroup base. | Pew Research Center Published 2020-08-20 Topline physical p.1, CASUAL Study methods and limits |
| F10 | Among those currently casually dating, 52% were open to either arrangement, 24% wanted a committed relationship only, 19% casual dates only and 5% neither. Definition: SEEKING within the current-casual-dater subset. Qualification: Historical October 2019 data, not a current or 2027 rate. Keep behavior, seeking preferences and opinions separate. | US singles currently casually dating; exact subgroup n not supplied United States 2019-10-16 to 2019-10-28 Exact item/subgroup valid n is not printed beside these selected figures. An overall report n is not a subgroup base. | Pew Research Center Published 2020-08-20 Original profile section, paragraph about currently casually dating Study methods and limits |
| F11 | Among singles looking for dates or a relationship, 53% were open to either, 28% wanted commitment only and 20% casual dates only. Definition: Conditional looking-only population, rather than all singles. Qualification: Historical October 2019 data, not a current or 2027 rate. Keep behavior, seeking preferences and opinions separate. | US single-and-looking adults; exact subgroup n unavailable United States 2019-10-16 to 2019-10-28 Exact item/subgroup valid n is not printed beside these selected figures. An overall report n is not a subgroup base. | Pew Research Center Published 2020-08-20 Original profile section: singles on the dating market Study methods and limits |
| F12 | Casual-only interest was 24% among daters 40+ versus 15% below 40; openness to either was 47% versus 58%. Definition: Age groups within single-and-looking adults. Qualification: Historical October 2019 data, not a current or 2027 rate. Keep behavior, seeking preferences and opinions separate. | US single-and-looking adults; age bases unavailable United States 2019-10-16 to 2019-10-28 Exact item/subgroup valid n is not printed beside these selected figures. An overall report n is not a subgroup base. | Pew Research Center Published 2020-08-20 Original profile section, age comparison Study methods and limits |
| F13 | 25% of divorced, separated or widowed daters sought casual dates only, compared with 17% of never-married daters. Definition: Marital-history groups within the dating market. Qualification: The researchers say age and gender largely explain these differences; marital history is not established as a cause. | US single-and-looking adults; group bases unavailable United States 2019-10-16 to 2019-10-28 Exact item/subgroup valid n is not printed beside these selected figures. An overall report n is not a subgroup base. | Pew Research Center Published 2020-08-20 Original profile, marital-history paragraph Study methods and limits |
Are app users looking for casual dates, casual sex or commitment?
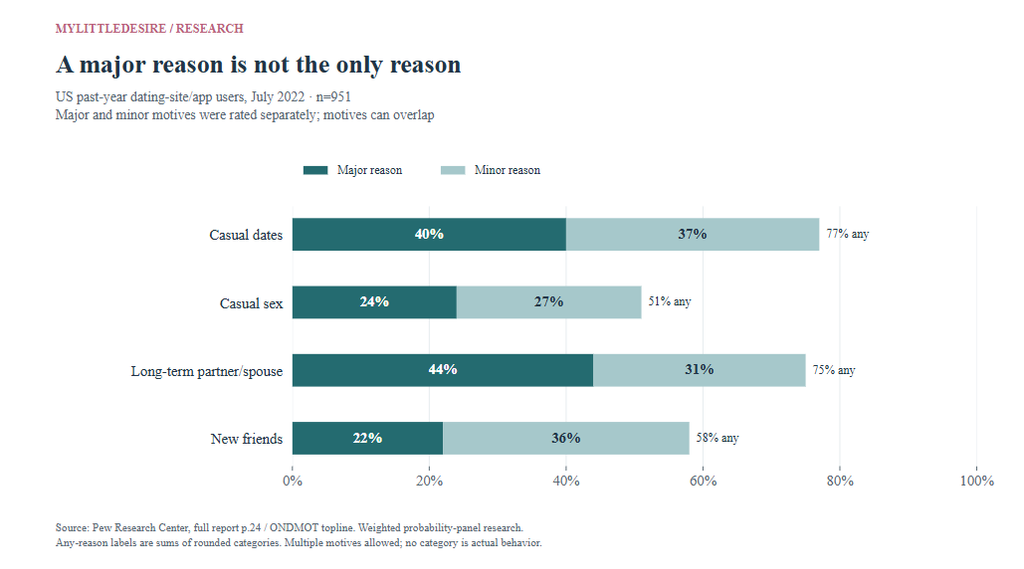
They can be looking for more than one thing. In Pew’s July 2022 past-year users, casual dates were a major reason for 40% and casual sex for 24%; long-term partnership was a major reason for 44%. The report directly measured overlap: 19% rated both casual dates and a long-term partner as major reasons. Casual dating therefore cannot be presented as the opposite of hoping for commitment.
| ID | Finding and qualification | Population, actual period and base | Original source and locator |
|---|---|---|---|
| F02 | Casual dates was a major app-use reason for 40%, a minor reason for 37% and not a reason for 22%. Definition: ONDMOT; intensity of each separate past-year motive. Qualification: July 2022 fieldwork. Several motives can apply to one person; major reason is not the one main reason or actual casual behavior. | US past-year dating-site/app users, n=951 United States 2022-07-05 to 2022-07-17 Published eligible item/group base(s): 951. An overall report n is not a subgroup base. | Pew Research Center Published 2023-02-02; singles analysis 2023-02-08 Full report printed p.24; topline ONDMOT, physical p.8 Study methods and limits |
| F03 | Casual sex was a major app-use reason for 24%, a minor reason for 27% and not a reason for 48%. Definition: ONDMOT; intensity of each separate past-year motive. Qualification: July 2022 fieldwork. Several motives can apply to one person; major reason is not the one main reason or actual casual behavior. | US past-year dating-site/app users, n=951 United States 2022-07-05 to 2022-07-17 Published eligible item/group base(s): 951. An overall report n is not a subgroup base. | Pew Research Center Published 2023-02-02; singles analysis 2023-02-08 Full report printed p.24; topline ONDMOT, physical p.8 Study methods and limits |
| F04 | Long-term partner/spouse was a major app-use reason for 44%, a minor reason for 31% and not a reason for 24%. Definition: ONDMOT; intensity of each separate past-year motive. Qualification: July 2022 fieldwork. Several motives can apply to one person; major reason is not the one main reason or actual casual behavior. | US past-year dating-site/app users, n=951 United States 2022-07-05 to 2022-07-17 Published eligible item/group base(s): 951. An overall report n is not a subgroup base. | Pew Research Center Published 2023-02-02; singles analysis 2023-02-08 Full report printed p.24; topline ONDMOT, physical p.8 Study methods and limits |
| F05 | New friends was a major app-use reason for 22%, a minor reason for 36% and not a reason for 42%. Definition: ONDMOT; intensity of each separate past-year motive. Qualification: July 2022 fieldwork. Several motives can apply to one person; major reason is not the one main reason or actual casual behavior. | US past-year dating-site/app users, n=951 United States 2022-07-05 to 2022-07-17 Published eligible item/group base(s): 951. An overall report n is not a subgroup base. | Pew Research Center Published 2023-02-02; singles analysis 2023-02-08 Full report printed p.24; topline ONDMOT, physical p.8 Study methods and limits |
| F06 | 19% rated both casual dating and a long-term partner as major reasons; 6% rated both casual sex and a long-term partner as major reasons. Definition: Published joint responses, unlike an overlap inferred from separate margins. Qualification: July 2022 fieldwork. Several motives can apply to one person; major reason is not the one main reason or actual casual behavior. | US past-year dating-site/app users, n=951 United States 2022-07-05 to 2022-07-17 Published eligible item/group base(s): 951. An overall report n is not a subgroup base. | Pew Research Center Published 2023-02-02; singles analysis 2023-02-08 Full report printed p.24, narrative Study methods and limits |
| F07 | 31% of men and 13% of women cited casual sex as a major app-use reason. Definition: Same major-reason item, gender groups. Qualification: July 2022 fieldwork. Several motives can apply to one person; major reason is not the one main reason or actual casual behavior. | US past-year app/site users; gender valid n unavailable United States 2022-07-05 to 2022-07-17 Exact item/subgroup valid n is not printed beside these selected figures. An overall report n is not a subgroup base. | Pew Research Center Published 2023-02-02; singles analysis 2023-02-08 Full report printed pp.24–26; gender chart p.26 Study methods and limits |
| F08 | Casual sex was a major reason for 46% of LGB men versus 28% of straight men, and 19% of LGB women versus 10% of straight women. Definition: Pew-defined sexual orientation and gender groups. Qualification: Historical subgroup descriptions, not individual predictions. LGB combines lesbian, gay and bisexual groups; no new subgroup significance tests. | US past-year app/site users; orientation/gender valid n unavailable United States 2022-07-05 to 2022-07-17 Exact item/subgroup valid n is not printed beside these selected figures. An overall report n is not a subgroup base. | Pew Research Center Published 2023-02-02; singles analysis 2023-02-08 Full report printed p.26, visually checked chart Study methods and limits |
What do the 2026 sexual-preference tables actually measure?
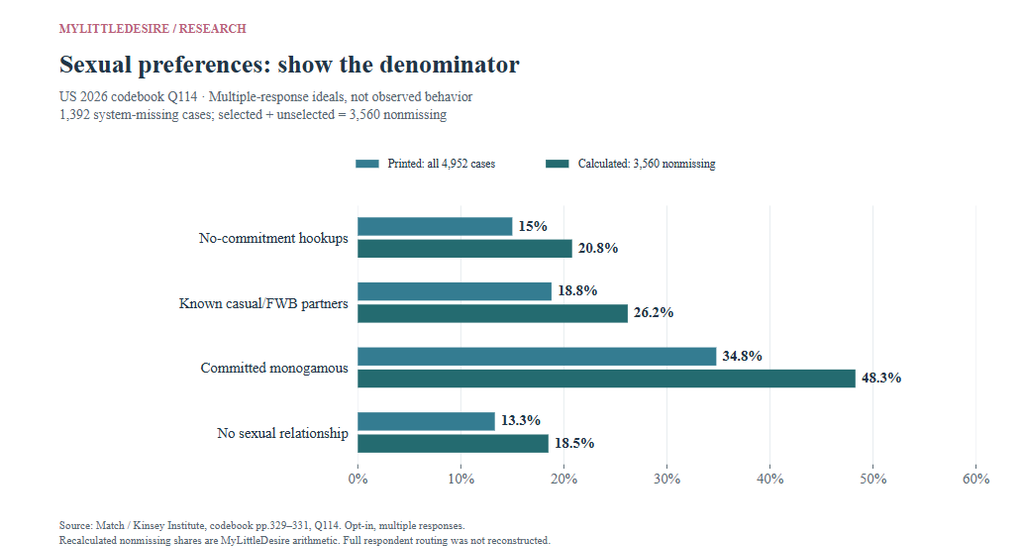
The Singles in America codebook distinguishes general relationship intentions from ideal sexual relationships. Q114’s preferences are multiple-response ideals, and its printed percentages include 1,392 system-missing cases. Among 3,560 nonmissing cases, MyLittleDesire calculates 20.8% selecting no-commitment hookups and 26.2% selecting known casual/FWB partners. The printed all-case shares are 15.0% and 18.8%. This is a denominator difference, not a rise in casual behavior.
| ID | Finding and qualification | Population, actual period and base | Original source and locator |
|---|---|---|---|
| F18 | 10.6% sought casual dating without commitment, 16.3% actively sought commitment, 44.7% were not actively looking but open, and 24.1% preferred remaining unattached. Definition: Q11 single best description; another 2.6% already dated someone without looking elsewhere and 1.7% wanted to open their relationship. Qualification: Opt-in frequency table, not a probability estimate or directly comparable wording to Pew SEEKING. | Study-defined single adults 18+; all codebook cases n=4,952; sexual module nonmissing n=3,560 United States March–April 2026 Published eligible item/group base(s): 4,952. An overall report n is not a subgroup base. | Match / Kinsey Institute Published University release 2026-09-14; Match release 2026-09-10 Codebook p.25, Q11 Study methods and limits |
| F19 | No-commitment hookups/one-night stands was selected by 741 cases; the codebook prints 15.0% of all 4,952 cases. Definition: Q114 asks ideal sexual relationship right now; multiple selections. Qualification: 1,392 system-missing cases; selected plus unselected = 3,560 nonmissing. This is an ideal, not current behavior. Valid-response recalculations are MyLittleDesire arithmetic, not percentages of all singles. | Study-defined single adults 18+; all codebook cases n=4,952; sexual module nonmissing n=3,560 United States March–April 2026 Published eligible item/group base(s): 3,560, 4,952. An overall report n is not a subgroup base. | Match / Kinsey Institute Published University release 2026-09-14; Match release 2026-09-10 Codebook p.330, Q114r3 Study methods and limits |
| F20 | Known, not romantically attached: FWB/casual partners was selected by 932 cases; the codebook prints 18.8% of all 4,952 cases. Definition: Q114 asks ideal sexual relationship right now; multiple selections. Qualification: 1,392 system-missing cases; selected plus unselected = 3,560 nonmissing. This is an ideal, not current behavior. Valid-response recalculations are MyLittleDesire arithmetic, not percentages of all singles. | Study-defined single adults 18+; all codebook cases n=4,952; sexual module nonmissing n=3,560 United States March–April 2026 Published eligible item/group base(s): 3,560, 4,952. An overall report n is not a subgroup base. | Match / Kinsey Institute Published University release 2026-09-14; Match release 2026-09-10 Codebook p.330, Q114r4 Study methods and limits |
| F21 | Committed monogamous sexual relationship was selected by 1,721 cases; the codebook prints 34.8% of all 4,952 cases. Definition: Q114 asks ideal sexual relationship right now; multiple selections. Qualification: 1,392 system-missing cases; selected plus unselected = 3,560 nonmissing. This is an ideal, not current behavior. Valid-response recalculations are MyLittleDesire arithmetic, not percentages of all singles. | Study-defined single adults 18+; all codebook cases n=4,952; sexual module nonmissing n=3,560 United States March–April 2026 Published eligible item/group base(s): 3,560, 4,952. An overall report n is not a subgroup base. | Match / Kinsey Institute Published University release 2026-09-14; Match release 2026-09-10 Codebook p.329, Q114r1 Study methods and limits |
| F22 | No sexual relationship was selected by 660 cases; the codebook prints 13.3% of all 4,952 cases. Definition: Q114 asks ideal sexual relationship right now; multiple selections. Qualification: 1,392 system-missing cases; selected plus unselected = 3,560 nonmissing. This is an ideal, not current behavior. Valid-response recalculations are MyLittleDesire arithmetic, not percentages of all singles. | Study-defined single adults 18+; all codebook cases n=4,952; sexual module nonmissing n=3,560 United States March–April 2026 Published eligible item/group base(s): 3,560, 4,952. An overall report n is not a subgroup base. | Match / Kinsey Institute Published University release 2026-09-14; Match release 2026-09-10 Codebook p.331, Q114r6 Study methods and limits |
| F23 | Typical sex timing was the first date for 414 cases (8.4% of all cases), second for 360 (7.3%) and third for 587 (11.9%). Definition: Q115 usual waiting time with a new partner; selected early categories. Qualification: Printed percentages include 1,392 system-missing cases. Timing does not establish casual status, exclusivity, consent in a particular encounter or a recommended schedule. | Study-defined single adults 18+; all codebook cases n=4,952; sexual module nonmissing n=3,560 United States March–April 2026 Published eligible item/group base(s): 4,952. An overall report n is not a subgroup base. | Match / Kinsey Institute Published University release 2026-09-14; Match release 2026-09-10 Codebook p.332, Q115 Study methods and limits |
| F24 | 680 cases selected waiting until an exclusive agreement (13.7% of all cases), versus 238 waiting until marriage (4.8%). Definition: Two different response options in Q115. Qualification: Usual self-reported timing, not a promise or measured conversion to commitment. The all-case denominator includes 1,392 missing cases; no category is a consent rule. | Study-defined single adults 18+; all codebook cases n=4,952; sexual module nonmissing n=3,560 United States March–April 2026 Published eligible item/group base(s): 4,952. An overall report n is not a subgroup base. | Match / Kinsey Institute Published University release 2026-09-14; Match release 2026-09-10 Codebook p.332, Q115 Study methods and limits |
Why is the newer main-reason figure lower than Pew’s major-reason figure?
SSRS found 8% naming casual sex as their one main reason for using dating sites/apps in January 2026, with 58% choosing an exclusive partner. Pew allowed respondents to rate several reasons as major or minor. SSRS asked ever-users; Pew’s motive question covered past-year users. Comparing 8% with 24% does not measure a decline. The distinction between main and major belongs in every quotation.
| ID | Finding and qualification | Population, actual period and base | Original source and locator |
|---|---|---|---|
| F25 | 8% named casual sex as their main app-use reason, 3% nonexclusive partners and 58% an exclusive partner. Definition: SPOT11; one main reason. Qualification: US ever-users, not current single users only. One main reason differs from multiple major/minor reasons; subgroup bases unavailable unless stated. | Adults 18+; SPOT11 ever-users of dating sites/apps n=772 United States 2026-01-02 to 2026-01-04 and 2026-01-16 to 2026-01-20 Published eligible item/group base(s): 772. An overall report n is not a subgroup base. | SSRS Published 2026-02-02 Topline physical p.7, SPOT11 Study methods and limits |
| F26 | 12% of men and 2% of women named casual sex as their main reason. Definition: Gender breakdown of SPOT11, original release. Qualification: US ever-users, not current single users only. One main reason differs from multiple major/minor reasons; subgroup bases unavailable unless stated. | Adults 18+; SPOT11 ever-users of dating sites/apps n=772 United States 2026-01-02 to 2026-01-04 and 2026-01-16 to 2026-01-20 Exact item/subgroup valid n is not printed beside these selected figures. An overall report n is not a subgroup base. | SSRS Published 2026-02-02 Original release: main reasons and gender Study methods and limits |
| F27 | Fun or something interesting was the main reason for 24% of women and 17% of men; the overall share was 20%. Definition: Fun/interest is a separate option from casual sex and nonexclusive romance. Qualification: A person choosing fun is not automatically a casual dater. Gender valid n unavailable. | Adults 18+; SPOT11 ever-users of dating sites/apps n=772 United States 2026-01-02 to 2026-01-04 and 2026-01-16 to 2026-01-20 Published eligible item/group base(s): 772. An overall report n is not a subgroup base. | SSRS Published 2026-02-02 Original release; topline physical p.7 Study methods and limits |
What does the Canadian current-dater survey show?
In the December 2025 Nanos current-dater subgroup, 82.3% wanted a long-term partner, 16.8% a one-night stand/sexual relationship and 15.3% a short-term partner. Several choices were allowed. These are descriptive results from only 77 current daters, not all 1,077 omnibus participants. The original workbook also contains a separate response-selection distribution; that table is not a different estimate of the percentage of people.
| ID | Finding and qualification | Population, actual period and base | Original source and locator |
|---|---|---|---|
| F28 | 82.3% sought a long-term partner, 16.8% a one-night stand/sexual relationship and 15.3% a short-term partner. Definition: Participants-based, multiple-response motive table; rounded to one decimal from original XLSX. Qualification: Only 77 current daters; ±11.3-point advertised current-dater margin. Choices overlap. These are not shares of all 1,077 Canadians or response-selection percentages. | Current daters n=77; men n=47, women n=30 Canada 2025-12-27 to 2025-12-29 Published eligible item/group base(s): 77. An overall report n is not a subgroup base. | Nanos Research / The Globe and Mail Published Report released January 2026; landing page 2026-02-12 Original XLSX rows 100–112, D105:D107; report printed p.7 Study methods and limits |
| F29 | One-night/sexual-relationship motives were 19.0% of men and 14.5% of women; short-term-partner motives were 19.2% and 11.1%. Definition: Same participants-based multiple-response question; one-decimal rounding. Qualification: Very small unweighted bases: 47 men, 30 women. No reliable gender league table or new significance claim; subgroup intervals unestablished. | Current daters n=77; men n=47, women n=30 Canada 2025-12-27 to 2025-12-29 Published eligible item/group base(s): 30, 47. An overall report n is not a subgroup base. | Nanos Research / The Globe and Mail Published Report released January 2026; landing page 2026-02-12 Original XLSX J106:K107; unweighted bases J103/K103 Study methods and limits |
Do casual and serious intentions coexist on Australian apps?
Yes, the original Australian release lists more than one intention among each platform’s ever-users. Tinder’s January 2024 figures were 56% for a dalliance/hookup, 47% for an exclusive relationship and 36% for a spouse/life partner. These are overlapping goals, with platform-specific valid sample sizes not published in the release. They are neither shares of all Australians nor evidence that one app produces better results.
| ID | Finding and qualification | Population, actual period and base | Original source and locator |
|---|---|---|---|
| F30 | Among Tinder ever-users, 56% sought a dalliance/hookup, 47% an exclusive relationship and 36% a spouse/life partner. Definition: Intentions on each platform respondents had ever used; overlapping options. Qualification: January 2024 historical online survey. Platform-specific valid n not disclosed; 1,029 is overall, not each app. Not an app-success ranking or a share of all Australians. | Adults 18+ overall; platform figures concern people who ever used each named app Australia January 2024 Exact item/subgroup valid n is not printed beside these selected figures. An overall report n is not a subgroup base. | YouGov Australia Published 2024-04-19 Original release: relationship types and hookup sections Study methods and limits |
| F31 | Among Grindr ever-users, 78% sought a dalliance/hookup, 33% an exclusive relationship and 36% a spouse/life partner. Definition: Intentions on each platform respondents had ever used; overlapping options. Qualification: January 2024 historical online survey. Platform-specific valid n not disclosed; 1,029 is overall, not each app. Not an app-success ranking or a share of all Australians. | Adults 18+ overall; platform figures concern people who ever used each named app Australia January 2024 Exact item/subgroup valid n is not printed beside these selected figures. An overall report n is not a subgroup base. | YouGov Australia Published 2024-04-19 Original release: relationship types and hookup sections Study methods and limits |
| F32 | Dalliance/hookup intentions were reported by 66% of Coffee Meets Bagel ever-users and 53% of OkCupid ever-users. Definition: Intentions on each platform respondents had ever used; overlapping options. Qualification: January 2024 historical online survey. Platform-specific valid n not disclosed; 1,029 is overall, not each app. Not an app-success ranking or a share of all Australians. | Adults 18+ overall; platform figures concern people who ever used each named app Australia January 2024 Exact item/subgroup valid n is not printed beside these selected figures. An overall report n is not a subgroup base. | YouGov Australia Published 2024-04-19 Original release: hookup section Study methods and limits |
Do Americans see casual dating before marriage as normal?
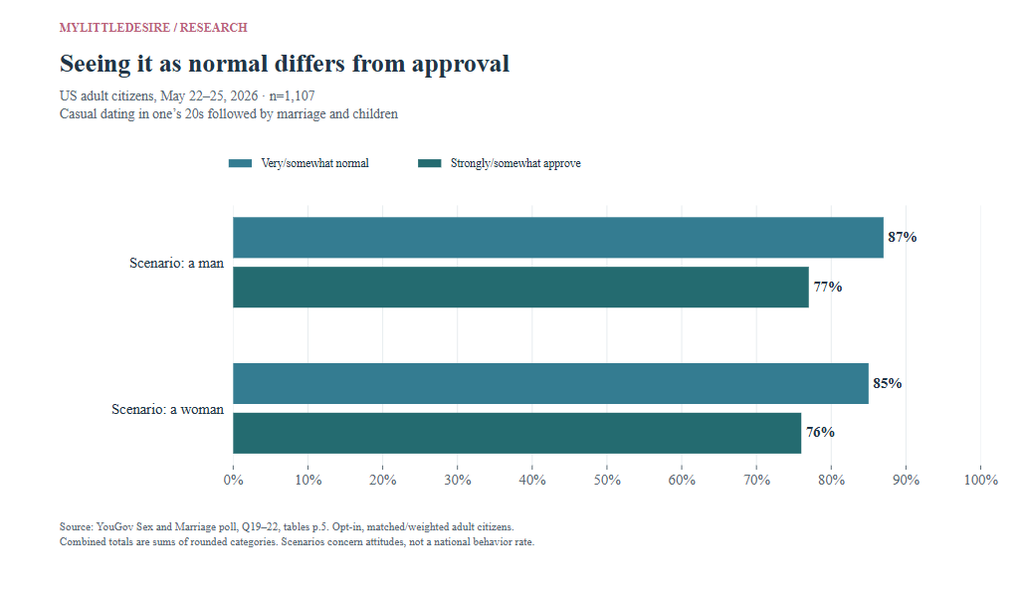
In YouGov’s May 2026 citizen poll, adding the printed normality categories gives 87% for a man casually dating in his 20s before marrying and having children, and 85% for a woman. Summed approval is 77% and 76%. Seeing a described life path as normal and approving of it are different questions. Their 10- and 9-point marginal gaps do not count inconsistent individuals or reveal respondents’ own behavior.
| ID | Finding and qualification | Population, actual period and base | Original source and locator |
|---|---|---|---|
| F34 | For a man casually dating in his 20s before marrying and having children, 56% said very normal and 31% somewhat normal; for a woman, 55% and 30%. Definition: Q19/Q20 normality of a described life path. Qualification: May 2026 adult citizens, opt-in weighted poll; opinions are not personal behavior or outcomes. | US adult CITIZENS; full poll n=1,107 United States 2026-05-22 to 2026-05-25 Published eligible item/group base(s): 1,107. An overall report n is not a subgroup base. | YouGov America Published 2026 original release; exact publication day not established Original tables physical p.5, Q19–20 Study methods and limits |
| F35 | For that life path, 46% strongly and 31% somewhat approved for a man; 45% and 31% for a woman. Definition: Q21/Q22 approval, distinct from seeing the path as normal. Qualification: May 2026 adult citizens, opt-in weighted poll; opinions are not personal behavior or outcomes. | US adult CITIZENS; full poll n=1,107 United States 2026-05-22 to 2026-05-25 Published eligible item/group base(s): 1,107. An overall report n is not a subgroup base. | YouGov America Published 2026 original release; exact publication day not established Original tables physical p.5, Q21–22 Study methods and limits |
| F36 | 65% said it was not hypocritical for a famous person who endorsed casual sex to marry and have children, while 15% said it was. Definition: Q25 response to a public-figure scenario. Qualification: Scenario-based public opinion, not approval of every casual arrangement or a behavioral forecast. | US adult CITIZENS; full poll n=1,107 United States 2026-05-22 to 2026-05-25 Published eligible item/group base(s): 1,107. An overall report n is not a subgroup base. | YouGov America Published 2026 original release; exact publication day not established Original tables physical p.6, Q25 Study methods and limits |
| F37 | 58% said people need not wait until marriage to have sex, while 28% thought they should wait. Definition: Q7 forced-choice view on premarital sex, not specifically casual sex. Qualification: Boundary context: premarital sex can occur in a committed relationship, so this is not casual-sex approval or participation. | US adult CITIZENS; full poll n=1,107 United States 2026-05-22 to 2026-05-25 Published eligible item/group base(s): 1,107. An overall report n is not a subgroup base. | YouGov America Published 2026 original release; exact publication day not established Original tables physical p.2, Q7 Study methods and limits |
How do attitudes to casual sex and ending casual dating differ?
In Pew’s October 2019 research, 62% viewed consensual casual sex as acceptable at least sometimes, while only 30% said the same about sex on a first date. Those questions describe different situations. The same survey found more acceptance of ending a casual dating relationship by phone or text than ending a committed one that way. These are historical etiquette opinions, rather than instructions, consent rules or reported conduct.
| ID | Finding and qualification | Population, actual period and base | Original source and locator |
|---|---|---|---|
| F14 | 62% considered consensual casual sex acceptable at least sometimes; 24% said never. The at-least-sometimes shares were 70% of men and 55% of women. Definition: Sex between consenting adults not in a committed relationship; always/sometimes NET. Qualification: Opinions in October 2019, not participation or an approval trend versus unlike questions. | US adults 18+; gender valid n unavailable United States 2019-10-16 to 2019-10-28 Published eligible item/group base(s): 4,860. An overall report n is not a subgroup base. | Pew Research Center Published 2020-08-20 Original attitudes chapter: casual sex and gender chart Study methods and limits |
| F15 | 64% considered ending a casual dating relationship by phone acceptable at least sometimes, compared with 51% for a committed relationship. Definition: Two parallel breakup-acceptability questions. Qualification: Historical opinions, not reported breakup conduct, sexual activity or a rule about consent. | US adults 18+ United States 2019-10-16 to 2019-10-28 Published eligible item/group base(s): 4,860. An overall report n is not a subgroup base. | Pew Research Center Published 2020-08-20 Attitudes chapter: casual versus committed breakups Study methods and limits |
| F16 | For casual partners, acceptable-at-least-sometimes shares were 22% for text, 20% email and 20% social-media private message; committed-partner shares were 14%, 14% and 11%. Definition: Parallel questions and channel-specific opinions. Qualification: Historical opinions, not reported breakup conduct, sexual activity or a rule about consent. | US adults 18+ United States 2019-10-16 to 2019-10-28 Published eligible item/group base(s): 4,860. An overall report n is not a subgroup base. | Pew Research Center Published 2020-08-20 Attitudes chapter: breakup methods Study methods and limits |
| F17 | 30% viewed sex on a first date as acceptable at least sometimes, 27% rarely and 42% never. Definition: First-date sexual etiquette, not the same as casual-sex acceptability. Qualification: Historical opinions, not reported breakup conduct, sexual activity or a rule about consent. | US adults 18+ United States 2019-10-16 to 2019-10-28 Published eligible item/group base(s): 4,860. An overall report n is not a subgroup base. | Pew Research Center Published 2020-08-20 Attitudes chapter: first-date behavior Study methods and limits |
What does academic research show about casual sexual relationships?
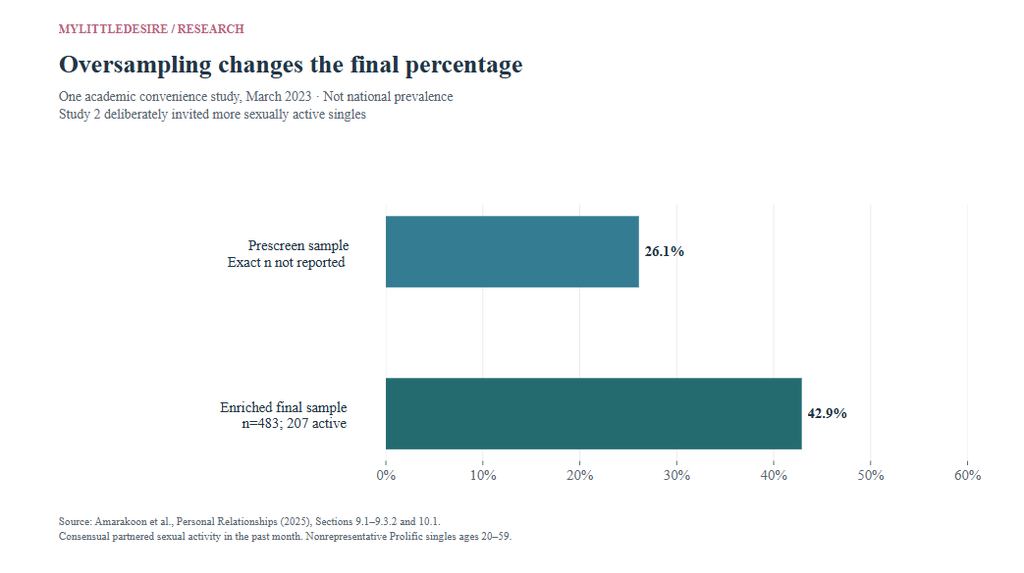
Academic samples can describe the nature of casual connections without estimating national prevalence. Amarakoon and colleagues used different questions in January 2021 and March 2023. Study 2’s prescreen had 26.1% sexually active, while its deliberately enriched final sample had 42.9%. Associations with closeness, sexual satisfaction and wellbeing remain observational; the studies cannot establish that casual sex causes improvement.
| ID | Finding and qualification | Population, actual period and base | Original source and locator |
|---|---|---|---|
| F38 | Study 1 classified 113 of 747 singles, 15.1%, as participating in a casual sexual relationship. Definition: Open-ended sexual/romantic connection responses coded by the researchers. Qualification: January 2021 convenience sample; not national prevalence, not a current rate and not the same measure as Study 2. | English-fluent Prolific singles ages 20–59; Study 1 n=747, Study 2 n=483; Table 3 n=203 Geographic eligibility not established from inspected methods; not a national country estimate January 2021 Published eligible item/group base(s): 747. An overall report n is not a subgroup base. | Amarakoon, Latimer, MacDonald and Dawson / Personal Relationships Published First published 2025-11-30; 32(4), e70045 Sections 7.1, 7.3.2 and 8.1 Study methods and limits |
| F39 | Among 70 Study 1 CSR participants describing partner types, 70.0% mentioned friends/FWB, 18.6% former romantic partners and 15.7% strangers. Definition: Qualitative descriptions among only the 70 respondents supplying those details. Qualification: Descriptions can overlap; 70 is not all 113 CSR cases or all 747 singles. Do not infer every casual sexual connection involves a stranger. | Study 1 subset describing sexual partner types, n=70 Geographic eligibility not established from inspected methods; not a national country estimate January 2021 Published eligible item/group base(s): 70. An overall report n is not a subgroup base. | Amarakoon, Latimer, MacDonald and Dawson / Personal Relationships Published First published 2025-11-30; 32(4), e70045 Section 8.1; footnote 1 Study methods and limits |
| F40 | Study 2 reported 26.1% sexually active in its prescreen, but 42.9% in its deliberately enriched final sample of 483. Definition: Study 2 asks about consensual partnered sexual activity in the previous month. Qualification: March 2023 convenience study with oversampling of sexually active singles; prescreen exact n not supplied. The 42.9% is not national prevalence or growth from 26.1%. | English-fluent Prolific singles ages 20–59; Study 1 n=747, Study 2 n=483; Table 3 n=203 Geographic eligibility not established from inspected methods; not a national country estimate March 2023 Published eligible item/group base(s): 483. An overall report n is not a subgroup base. | Amarakoon, Latimer, MacDonald and Dawson / Personal Relationships Published First published 2025-11-30; 32(4), e70045 Sections 9.1–9.3.2 and 10.1 Study methods and limits |
| F41 | 60.9% of sexually active Study 2 participants were reported as having one sexual partner. Definition: Partner-count description in the Study 2 results. Qualification: The paragraph does not state this item’s valid denominator. Do not silently use 483, 207 or Table 3’s 203. One partner does not establish an exclusive agreement. | Study 2 sexually active respondents; partner-count item valid n unprinted Geographic eligibility not established from inspected methods; not a national country estimate March 2023 Exact item/subgroup valid n is not printed beside these selected figures. An overall report n is not a subgroup base. | Amarakoon, Latimer, MacDonald and Dawson / Personal Relationships Published First published 2025-11-30; 32(4), e70045 Section 10.1 Study methods and limits |
| F42 | Mean interpersonal closeness was 2.41 before sexual contact and 3.22 at survey time, on a 1–7 scale; SDs were 1.49 and 1.82. Definition: Retrospective before-contact rating and current rating within the same cross-sectional survey. Qualification: Not a longitudinal measurement of improvement or evidence sex caused closeness. Newly developed items; validity not established. | Study 2 Table 3 casual-sex group, n=203 Geographic eligibility not established from inspected methods; not a national country estimate March 2023 Published eligible item/group base(s): 203. An overall report n is not a subgroup base. | Amarakoon, Latimer, MacDonald and Dawson / Personal Relationships Published First published 2025-11-30; 32(4), e70045 Table 3; Section 9.3.3 Study methods and limits |
| F43 | On 1–5 items, means were 3.34 for sex as the primary goal, 2.67 for presence of a sexual agreement, 2.52 for sexual exclusivity and 2.44 for interest in monogamy. Definition: Four distinct researcher-developed items, not percentages. Qualification: Item-specific scale meanings differ; do not turn 2.67 into 53.4% with an agreement or rank distinct scales as one construct. New items lack reported validation. | Study 2 Table 3 casual-sex group, n=203 Geographic eligibility not established from inspected methods; not a national country estimate March 2023 Published eligible item/group base(s): 203. An overall report n is not a subgroup base. | Amarakoon, Latimer, MacDonald and Dawson / Personal Relationships Published First published 2025-11-30; 32(4), e70045 Table 3 and note; Section 9.3.3 Study methods and limits |
| F44 | Sexual-satisfaction means were 3.17 versus 2.49 for CSR versus no-CSR in Study 1, and 3.77 versus 2.39 in Study 2. Definition: Mean satisfaction on a 1–7 scale; Table 2 reports standard errors. Qualification: Cross-sectional association in nonrepresentative groups. Higher satisfaction does not show casual sex caused improvement or is beneficial for every person. | English-fluent Prolific singles ages 20–59; Study 1 n=747, Study 2 n=483; Table 3 n=203 Geographic eligibility not established from inspected methods; not a national country estimate January 2021 and March 2023 Published eligible item/group base(s): 113, 203, 273, 634. An overall report n is not a subgroup base. | Amarakoon, Latimer, MacDonald and Dawson / Personal Relationships Published First published 2025-11-30; 32(4), e70045 Table 2; Sections 7.3.5.1, 8.4 and 10.4 Study methods and limits |
| F45 | Life-satisfaction means were 18.55 versus 17.54 in Study 1 and 19.73 versus 16.32 in Study 2, for CSR versus no-CSR groups. Definition: Summed life-satisfaction scale, range 5–35; Table 2 standard errors retained. Qualification: Study 1 life-satisfaction difference was not statistically significant; Study 2 was reported significant. Different samples, measures and timing prevent interpreting the two as a national trend or causal replication. | English-fluent Prolific singles ages 20–59; Study 1 n=747, Study 2 n=483; Table 3 n=203 Geographic eligibility not established from inspected methods; not a national country estimate January 2021 and March 2023 Published eligible item/group base(s): 113, 203, 273, 634. An overall report n is not a subgroup base. | Amarakoon, Latimer, MacDonald and Dawson / Personal Relationships Published First published 2025-11-30; 32(4), e70045 Table 2; Sections 7.3.5.3, 8.4 and 10.4 Study methods and limits |
| F46 | Sexual satisfaction correlated with current closeness (rho .27), agreement (.28), exclusivity (.27) and monogamy interest (.16). Definition: Study 2 Spearman correlations; first three p<.001, monogamy interest p≤.05. Qualification: No multiple-comparison correction; exact pairwise valid n not supplied. Correlation is not a causal effect or the share of people satisfied. | Study 2 casual-sex-group correlations; pairwise n unprinted Geographic eligibility not established from inspected methods; not a national country estimate March 2023 Exact item/subgroup valid n is not printed beside these selected figures. An overall report n is not a subgroup base. | Amarakoon, Latimer, MacDonald and Dawson / Personal Relationships Published First published 2025-11-30; 32(4), e70045 Table 4 and notes Study methods and limits |
How do UK attitudes vary by age and background?
The World Values Survey analysis uses a specific threshold: scores 8–10 on a 1–10 justifiability scale. In the 2022 UK cross-section, 41% met that threshold; the age shares ranged from 66% at 18–24 to 19% at 65+. The historical Great Britain series ends at 42%, because its geography differs. Both figures can be correct. The report was published in March 2023, and neither percentage is a 2027 participation rate.
| ID | Finding and qualification | Population, actual period and base | Original source and locator |
|---|---|---|---|
| F47 | In Great Britain, casual sex rated justifiable by 10% in 1999, 27% in 2018 and 42% in 2022. Definition: Historical trend uses Great Britain because Northern Ireland trend coverage is unavailable. Qualification: Same published historical analysis, not a current casual-sex participation rate. UK cross-sectional overall is 41%, a different geography. Each point keeps its actual year. | GB adults 18+; each historical wave reported minimum n=1,000; exact trend-wave bases not retrieved UK cross-section; Great Britain for historical trends 1999; 2018; 2022 (each actual wave) Exact item/subgroup valid n is not printed beside these selected figures. An overall report n is not a subgroup base. | King’s College London Policy Institute / World Values Survey / Ipsos Published March 2023 Report printed pp.4,13; methods p.2 Study methods and limits |
| F48 | The UK cross-section was 41% overall, 45% of men and 37% of women. Definition: 2022 UK cross-section, including Northern Ireland. Qualification: Scores 8–10 on a 1–10 justifiability scale; attitudes, not activity. Historical 2022 data, not 2027. | UK adults 18+; full and demographic bases are reported unweighted subgroup counts UK cross-section; Great Britain for historical trends 2022-03-01 to 2022-09-09 Published eligible item/group base(s): 1,328, 1,695, 3,056. An overall report n is not a subgroup base. | King’s College London Policy Institute / World Values Survey / Ipsos Published March 2023 Report printed p.19 chart, p.35 bases Study methods and limits |
| F49 | The UK age profile was 66% at 18–24, 56% at 25–34, 50% at 35–44, 40% at 45–54, 35% at 55–64 and 19% at 65+. Definition: Age at survey, not the report’s generation grouping. Qualification: Scores 8–10 on a 1–10 justifiability scale; attitudes, not activity. Historical 2022 data, not 2027. | UK adults 18+ by age; counts are unweighted subgroup bases UK cross-section; Great Britain for historical trends 2022-03-01 to 2022-09-09 Published eligible item/group base(s): 199, 438, 452, 467, 494, 835. An overall report n is not a subgroup base. | King’s College London Policy Institute / World Values Survey / Ipsos Published March 2023 Report printed p.19 chart, p.35 bases Study methods and limits |
| F50 | 27% of religious respondents and 53% of nonreligious respondents rated casual sex justifiable. Definition: Religious status categories used in original chart. Qualification: Scores 8–10 on a 1–10 justifiability scale; attitudes, not activity. Historical 2022 data, not 2027. | UK adults 18+ by religious status; unweighted subgroup bases UK cross-section; Great Britain for historical trends 2022-03-01 to 2022-09-09 Published eligible item/group base(s): 1,412, 1,548. An overall report n is not a subgroup base. | King’s College London Policy Institute / World Values Survey / Ipsos Published March 2023 Report printed p.19 chart, p.35 bases Study methods and limits |
| F51 | The shares were 31% among intended Conservative voters and 43% among intended Labour voters. Definition: Voting intention in the 2022 survey, not 2026 party support. Qualification: Scores 8–10 on a 1–10 justifiability scale; attitudes, not activity. Historical 2022 data, not 2027. | UK adults 18+ in named voting-intention groups; unweighted subgroup bases UK cross-section; Great Britain for historical trends 2022-03-01 to 2022-09-09 Published eligible item/group base(s): 564, 711. An overall report n is not a subgroup base. | King’s College London Policy Institute / World Values Survey / Ipsos Published March 2023 Report printed p.19 chart, p.35 bases Study methods and limits |
| F52 | In the GB generation comparison, 67% of Gen Z, 55% of Millennials and 12% of the Pre-War cohort rated casual sex justifiable. Definition: Generation-based GB trend endpoint, not the UK age-band chart. Qualification: Generation cutoffs and exact endpoint group n not independently established. Preserve the historical cohort labels; do not replace UK ages 18–24 (66%) with GB Gen Z (67%). | GB adults by report-defined generation; minimum n=130 per generation/year UK cross-section; Great Britain for historical trends 2022-03-01 to 2022-09-09 Exact item/subgroup valid n is not printed beside these selected figures. An overall report n is not a subgroup base. | King’s College London Policy Institute / World Values Survey / Ipsos Published March 2023 Report printed p.19 generation chart and accompanying narrative Study methods and limits |
24 descriptive calculations with source inputs
These comparisons make existing evidence easier to inspect and cite. Category sums and valid-response shares are percentages; differences between percentages are percentage points. Some contrasts were already evident in or discussed by the original researchers. None is marketed as a new scientific discovery.
| ID | Calculation | Arithmetic and unit | Original inputs and qualification |
|---|---|---|---|
| C01 | Pew casual: major plus minor reason | 40 + 37 = 77.0 percent | F02 Sum of rounded categories within one item. Reasons overlap across items; no exclusive audience segmentation. |
| C02 | Pew sex: major plus minor reason | 24 + 27 = 51.0 percent | F03 Sum of rounded categories within one item. Reasons overlap across items; no exclusive audience segmentation. |
| C03 | Pew long: major plus minor reason | 44 + 31 = 75.0 percent | F04 Sum of rounded categories within one item. Reasons overlap across items; no exclusive audience segmentation. |
| C04 | Pew friends: major plus minor reason | 22 + 36 = 58.0 percent | F05 Sum of rounded categories within one item. Reasons overlap across items; no exclusive audience segmentation. |
| C05 | Pew major casual dates minus major casual sex | 40 − 24 = 16.0 percentage points | F02 / F03 Different motives rated by the same past-year users; not a count of people who date without sex. |
| C06 | Pew casual sex major: men minus women | 31 − 13 = 18.0 percentage points | F07 Descriptive same-survey comparison; source limitations retained, no new significance test or individual overlap inferred. |
| C07 | Pew casual sex major: LGB minus straight men | 46 − 28 = 18.0 percentage points | F08 Descriptive same-survey comparison; source limitations retained, no new significance test or individual overlap inferred. |
| C08 | Pew casual sex major: LGB minus straight women | 19 − 10 = 9.0 percentage points | F08 Descriptive same-survey comparison; source limitations retained, no new significance test or individual overlap inferred. |
| C09 | 2019 casual-only interest: age 40+ minus under 40 | 24 − 15 = 9.0 percentage points | F12 Descriptive same-survey comparison; source limitations retained, no new significance test or individual overlap inferred. |
| C10 | Phone breakup acceptability: casual minus committed | 64 − 51 = 13.0 percentage points | F15 Descriptive same-survey comparison; source limitations retained, no new significance test or individual overlap inferred. |
| C11 | Text breakup acceptability: casual minus committed | 22 − 14 = 8.0 percentage points | F16 Descriptive same-survey comparison; source limitations retained, no new significance test or individual overlap inferred. |
| C12 | Ideal hook: percentage among nonmissing module responses | 100 × 741 / (741 + 2819) = 20.8 percent | F19 100 × selected / (selected + unselected). Nonmissing n=3,560; printed all-case denominator is 4,952. Ideal preferences overlap; not behavior or all-singles prevalence. |
| C13 | Ideal fwb: percentage among nonmissing module responses | 100 × 932 / (932 + 2628) = 26.2 percent | F20 100 × selected / (selected + unselected). Nonmissing n=3,560; printed all-case denominator is 4,952. Ideal preferences overlap; not behavior or all-singles prevalence. |
| C14 | Ideal mono: percentage among nonmissing module responses | 100 × 1721 / (1721 + 1839) = 48.3 percent | F21 100 × selected / (selected + unselected). Nonmissing n=3,560; printed all-case denominator is 4,952. Ideal preferences overlap; not behavior or all-singles prevalence. |
| C15 | Ideal none: percentage among nonmissing module responses | 100 × 660 / (660 + 2900) = 18.5 percent | F22 100 × selected / (selected + unselected). Nonmissing n=3,560; printed all-case denominator is 4,952. Ideal preferences overlap; not behavior or all-singles prevalence. |
| C16 | Man life path: very or somewhat normal | 56 + 31 = 87.0 percent | F34 MyLittleDesire sum of rounded response categories. Seeing a life path as normal and approving of it are separate marginal questions, not proof of personal conduct or individual inconsistency. |
| C17 | Woman life path: very or somewhat normal | 55 + 30 = 85.0 percent | F34 MyLittleDesire sum of rounded response categories. Seeing a life path as normal and approving of it are separate marginal questions, not proof of personal conduct or individual inconsistency. |
| C18 | Man life path: strongly or somewhat approve | 46 + 31 = 77.0 percent | F35 MyLittleDesire sum of rounded response categories. Seeing a life path as normal and approving of it are separate marginal questions, not proof of personal conduct or individual inconsistency. |
| C19 | Woman life path: strongly or somewhat approve | 45 + 31 = 76.0 percent | F35 MyLittleDesire sum of rounded response categories. Seeing a life path as normal and approving of it are separate marginal questions, not proof of personal conduct or individual inconsistency. |
| C20 | Academic Study 2 final enriched minus prescreen share | 42.9 − 26.1 = 16.8 percentage points | F40 Preserve sample, geography, question and actual period. Descriptive arithmetic, not a new scientific discovery, causal effect or significance test. Academic enriched/prescreen difference is sampling design, not change over time. |
| C21 | UK justifiability: ages 18–24 minus 65+ | 66 − 19 = 47.0 percentage points | F49 Preserve sample, geography, question and actual period. Descriptive arithmetic, not a new scientific discovery, causal effect or significance test. Academic enriched/prescreen difference is sampling design, not change over time. |
| C22 | UK justifiability: men minus women | 45 − 37 = 8.0 percentage points | F48 Preserve sample, geography, question and actual period. Descriptive arithmetic, not a new scientific discovery, causal effect or significance test. Academic enriched/prescreen difference is sampling design, not change over time. |
| C23 | UK justifiability: nonreligious minus religious | 53 − 27 = 26.0 percentage points | F50 Preserve sample, geography, question and actual period. Descriptive arithmetic, not a new scientific discovery, causal effect or significance test. Academic enriched/prescreen difference is sampling design, not change over time. |
| C24 | GB justifiability: 2022 minus 2018 | 42 − 27 = 15.0 percentage points | F47 Preserve sample, geography, question and actual period. Descriptive arithmetic, not a new scientific discovery, causal effect or significance test. Academic enriched/prescreen difference is sampling design, not change over time. |
Normality versus approval: the full arithmetic
For the male scenario, (56 + 31) − (46 + 31) = 10 percentage points. For the female scenario, (55 + 30) − (45 + 31) = 9 points. These are differences between rounded marginal attitude totals, not percentages of people holding inconsistent views. YouGov’s original Q19–22 tables.
Common questions about casual dating statistics
What percentage of adults casually date?
There is no universal rate in this evidence. YouGov’s May 2026 citizen poll found 4% currently in a casual relationship; Pew’s October 2019 figure of 13% used a singles-only population. Those are different questions and bases, so the difference is not a measured trend. Original research source.
Do most casual daters reject commitment?
The selected evidence does not support that assumption. Among Pew’s currently casual daters in 2019, 52% were open to either dates or commitment and 24% sought only commitment. Among 2022 past-year app users, 19% rated casual dates and a long-term partner as major reasons. Original research source.
Is casual dating the same as casual sex?
No. Pew asked about them separately, and the 2026 codebook distinguishes no-commitment hookups from known casual/FWB partners. Retain each study’s definition. Original research source.
Why are the known-casual-partner percentages 18.8% and 26.2%?
The codebook prints 932 selected cases as 18.8% of all 4,952. MyLittleDesire calculates 26.2% among 3,560 nonmissing cases. Both describe ideal sexual preferences, not behavior; the denominator changes. Original research source.
Did casual-sex motives fall from 24% to 8%?
That comparison does not establish a decline. Pew asked past-year users about multiple major reasons; SSRS asked ever-users for one main reason. Question format and populations differ. Original research source.
Does 42.9% mean almost half of singles are having casual sex?
No. It is the final percentage in an academic sample that deliberately recruited extra sexually active singles. The researchers report 26.1% in its prescreen and warn the samples are nonrepresentative. Original research source.
Do these studies show casual sex improves mental health?
They describe cross-sectional associations. Some wellbeing differences did not replicate, and the designs cannot establish which direction an association runs or rule out selection. Original research source.
Why does the British source show both 41% and 42%?
41% is the 2022 UK cross-section and 42% the Great Britain historical trend endpoint. The geography differs. Both use the published justifiability threshold, not a behavior measure. Original research source.
Methodology and limitations
Scope and original contribution
MyLittleDesire compiled 52 grouped findings with 160 numeric inputs from nine survey programs, produced four chart designs and documented 24 descriptive calculations. There are seven research teams when the two Pew waves and two YouGov market programs are grouped by organization. These are not 52 studies or independent discoveries. The contribution is convenient source-linked comparison and interpretation; no original survey fieldwork, systematic-review completeness or pooled world prevalence is claimed.
Edition and actual dates
2027 is the editorial edition. The completed review date is November 2, 2026. Some original documents were retrieved November 1 and reused with their retrieval dates preserved. Dated observations range from 1999 historical British attitudes to March–April/May 2026 US surveys. Older results remain explicitly historical. The KCL report was published in March 2023; a later search crawl date does not make it a 2026 study.
Verification process
We inspected original web analyses, selected pages in the 344-page Kinsey codebook, Pew’s original reports/toplines, SSRS’s original topline, Nanos’s report and XLSX, YouGov’s original releases and US tables, KCL’s report and the academic full text. The relevant Pew gender/orientation and KCL demographic charts were visually inspected because extracted text can mix labels. The academic full text and SSRS release were accessible through public research retrieval when direct HTTP gave a challenge. Selected question/table verification is not an audit of every respondent or every question.
Populations and sampling
Pew, SSRS, Nanos and the UK WVS describe probability-based sampling, with different designs and weighting. Kinsey and YouGov use opt-in panels with demographic balancing or matching/weighting. Nanos’s relevant current-dater sample is only 77, not the full 1,077. Australian platform bases are smaller unknown subsets of 1,029. The US YouGov poll covers adult citizens, not all residents. The academic samples are nonrepresentative Prolific singles ages 20–59; their geographic eligibility was not established, so no national attribution is made.
Denominators, routing and missing cases
Q114 selected plus not-selected counts equal 3,560 for the selected items; 1,392 records are system-missing. Sex_Screener on p.325 prints the same yes/no counts. We calculate nonmissing shares as 100 × selected / (selected + not selected), keeping the printed all-case shares beside them. We do not reconstruct individual routing, treat missing as no or call ideal preferences current behavior. Q115’s selected percentages use all 4,952 cases. Nanos’s participants-based motive table is distinct from its response-selection table.
Comparisons and uncertainty
Only compatible within-survey contrasts are calculated. Major-plus-minor and attitude totals sum rounded published categories; denominators and missingness remain visible. Percentage differences use percentage points. There are no new significance tests. Original subgroup intervals remain unavailable unless supplied, and we do not attach overall margins to subgroups. Academic tables distinguish standard deviations from standard errors, retain the questionnaire scales and leave unknown pairwise bases blank.
Academic findings and causal limits
Study 1 coded open descriptions in January 2021; Study 2 asked about past-month consensual partnered sexual activity in March 2023. It deliberately oversampled sexually active singles. The 26.1% prescreen and 42.9% final figures concern recruitment, not a national trend. Table 3 uses 203 cases while the final sexually active count is 207; the exact missingness was not reconstructed. The one-partner narrative does not print its valid denominator. Before-contact closeness is recalled within a cross-sectional survey, and none of these associations proves a causal wellbeing effect. Some wellbeing results differed across studies; Table 4 did not correct for multiple comparisons.
Geographic and construct boundaries
UK and Great Britain are not interchangeable: the UK 2022 cross-section is 41%, while the GB trend endpoint is 42%. The source’s generation comparison differs from its age chart. Justifiability scores 8–10 differ from Pew always/sometimes acceptability and YouGov normality/approval. Casual dating, casual sex, premarital sex, FWB and committed nonmonogamy remain distinct. No country league table, global average or unsupported transition-to-marriage rate is produced.
Exclusions and updating
The holdouts inventory keeps rejected claims, uncertain denominators and unmeasured metrics separate. We excluded unaudited partner-frequency tables, unsupported app-outcome comparisons, inferred intersections and false 2027 measurements. Update source wording, eligibility, actual dates and valid bases before changing inputs. Rebuild affected calculations, text and charts together; retain useful historical findings and the evergreen URL. Change review dates only after substantive checking.
Related MyLittleDesire research
Dating Intentions and Commitment Statistics covers the broader search for commitment. Online Dating and Dating App Statistics covers adoption and platforms. Singles and Singlehood Statistics covers relationship status and single life. Ghosting Statistics covers contact-ending behavior. This resource focuses on casual dating, sexual-context distinctions and compatible comparisons.
Complete original-source bibliography
- S01 · Pew Research Center. From Looking for Love to Swiping the Field; single-Americans analysis.
Published 2023-02-02; singles analysis 2023-02-08.
Actual data: 2022-07-05 to 2022-07-17
Population: Adults 18+; singles n=2,231; past-year app/site users n=951
Method: Weighted probability-based American Trends Panel plus Ipsos KnowledgePanel LGB oversample. Original full report, online-dating topline and singles topline inspected; motives chart printed pp.24–26.
Limits: Historical July 2022 observations. Multiple major reasons are allowed; casual dating and casual sex were separate items. Gender/orientation subgroup valid n and numeric intervals not printed in selected tables. Chart error bars not converted into invented intervals.
Supporting document 1 · Supporting document 2 · Supporting document 3 · Supporting document 4 - S02 · Pew Research Center. A profile of single Americans; public attitudes about dating.
Published 2020-08-20.
Actual data: 2019-10-16 to 2019-10-28
Population: Adults 18+; singles CASUAL/SEEKING base n=1,918
Method: Weighted probability-based American Trends Panel. Original 53-page report, 13-page topline and original web analysis inspected. Overall margin ±2.1 percentage points is not assigned to subgroups.
Limits: Historical context. Currently casually dating, looking only for casual dates, openness to either, and views of acceptability are different measures. Current-casual and looking-only subgroup exact n not printed beside selected analysis. Round-off explains imperfect sums.
Supporting document 1 · Supporting document 2 · Supporting document 3 - S03 · Match / Kinsey Institute. Singles in America 2026: public codebook.
Published University release 2026-09-14; Match release 2026-09-10.
Actual data: March–April 2026
Population: Study-defined single adults 18+; all codebook cases n=4,952; sexual module nonmissing n=3,560
Method: Online opt-in panels, demographically balanced, not probability recruitment or a sample of Match customers. Selected tables inspected in 344-page codebook: Q11 p.25, Sex_Screener p.325, Q114 pp.329–332 and Q115 p.332.
Limits: Commercial funding. Frequency-table percentages use all 4,952 cases, including 1,392 system-missing sexual-module cases. Q114 is multiple-response ideals, not observed behavior. Calculated nonmissing shares are labeled; full routing/individual records not reconstructed.
Supporting document 1 · Supporting document 2 - S04 · SSRS. The Public and Online Dating 2026.
Published 2026-02-02.
Actual data: 2026-01-02 to 2026-01-04 and 2026-01-16 to 2026-01-20
Population: Adults 18+; SPOT11 ever-users of dating sites/apps n=772
Method: Probability-based Opinion Panel Omnibus, online and telephone, English/Spanish option; overall design effect 1.27 and 95% margin ±2.5 points. Original release and nine-page topline inspected.
Limits: One MAIN reason, unlike Pew major/minor reasons. Ever-users include former users and people now partnered. Gender-specific valid bases not supplied in accessible release; overall margin not transferable.
Supporting document 1 - S05 · Nanos Research / The Globe and Mail. Canadians currently dating: reasons for dating.
Published Report released January 2026; landing page 2026-02-12.
Actual data: 2025-12-27 to 2025-12-29
Population: Current daters n=77; men n=47, women n=30
Method: RDD dual-frame telephone/online random national omnibus. Original report and original XLSX tables read. Participants-based motive table rows 100–112, not the response-share table rows 114–126.
Limits: Very small current-dater and gender samples; current-dater advertised margin ±11.3 points, not gender margins. Multiple responses. Published XLSX has a different table totaling response selections; it must not be substituted for percentages of people.
Supporting document 1 · Supporting document 2 - S06 · YouGov Australia. Scroll, Swipe, Settle down: dating-app relationship intentions.
Published 2024-04-19.
Actual data: January 2024
Population: Adults 18+ overall; platform figures concern people who ever used each named app
Method: Original online study designed by YouGov; national sample weighted by age, gender and region to ABS population estimates. Original methods and platform-specific findings inspected.
Limits: Historical; platform/item valid n and intervals not published in selected release. Overall 1,029 is not a Tinder/Grindr/Coffee Meets Bagel denominator. Overlapping relationship intentions, not exclusive classes, app effectiveness or current casual behavior. Probability recruitment not established. - S07 · YouGov America. Sex and Marriage poll; Call her normal?.
Published 2026 original release; exact publication day not established.
Actual data: 2026-05-22 to 2026-05-25
Population: US adult CITIZENS; full poll n=1,107
Method: Original 64-page tables and release read. YouGov opt-in panel, sample matching/weighting to demographic and political targets; reported approximate overall margin 4%. Q4–5 status/history and Q19–25 attitudes.
Limits: Citizens, not all residents. Normality, approval, hypocrisy and behavior are separate questions. Stated lifetime history excludes current relationship. Combined very/somewhat or strongly/somewhat shares are MyLittleDesire sums of rounded categories, not unpublished respondent-level NETs.
Supporting document 1 - S08 · Amarakoon, Latimer, MacDonald and Dawson / Personal Relationships. Who Is “Doing It”? Casual Sex and WellBeing in Singlehood.
Published First published 2025-11-30; 32(4), e70045.
Actual data: Study 1 January 2021; Study 2 March 2023
Population: English-fluent Prolific singles ages 20–59; Study 1 n=747, Study 2 n=483; Table 3 n=203
Method: Original full text accessible through public web research, though direct HTTP returned a challenge. Discovery/replication cross-sectional online convenience samples. Study 1 open coding; Study 2 past-month consensual partnered sexual activity, with deliberate oversampling of sexually active singles.
Limits: Nonrepresentative; neither 15.1%, 26.1% nor enriched 42.9% is national prevalence. Pandemic timing and different measures prevent time-trend inference. Scale means/SD/SE are not percentages. Table 3 n=203 differs from the 207 sexually active final cases; precise missingness/routing and correlation pairwise n not reconstructed. Multiple correlations unadjusted.
Supporting document 1 - S09 · King’s College London Policy Institute / World Values Survey / Ipsos. A growing liberalisation: how social attitudes have shifted in the UK and beyond.
Published March 2023.
Actual data: UK 2022-03-01 to 2022-09-09; GB historical comparisons 1999 and 2018
Population: Adults 18+; UK n=3,056; subgroup bases in technical details
Method: Original KCL analysis of WVS/EVS; UK random-probability survey by Ipsos, mixed face-to-face, video, paper and online follow-up. Weighted by region, education and age×gender. Selected charts visually checked, printed pp.4,13,19 and methods p.35.
Limits: Acceptability, not activity: scores 8–10 on a 1–10 justifiability scale. UK overall 41% differs from GB trend 42%; geography must be retained. Historical GB wave exact n not retrieved beyond reported minimum 1,000. Cohort and age-group definitions differ; generation exact year cutoffs not independently established.
Supporting document 1
How to cite this resource
MyLittleDesire. Casual Dating Statistics 2027 https://mylittledesire.com/casual-dating-statistics/.