
What people expect on a first date can differ from what they consider acceptable, what they want to share and what they report spending. This source-linked guide brings those questions together across US, British, Canadian and Australian research, with dates and populations kept visible.
What does a first-date expectations statistic measure?
Check who answered, the actual period and whether the question asks about approval, preference, willingness, spending, behavior or a fictional scenario.
| Term | Meaning | Interpretation |
|---|---|---|
| Expectation of a date | What a respondent wants or expects the other person to do. | Different from their own willingness, what happened or what someone owes them. |
| Own preferred timing | When a person would like to share information or make an introduction. | Self and other items are separate margins; no individual inconsistency can be counted from them. |
| Acceptable versus ideal | Approving an option versus selecting it as the single preferred date. | Neither measures participation, compatibility, safety or consent. |
| Payment opinion | Who a person believes should cover or share a bill. | Different from actual bill payments; open coding and listed choices can yield different distributions. |
| Willingness versus reported spend | A stated budget limit or amount versus a self-reported amount spent. | Keep CAD and GBP separate; neither is a transaction audit or a 2027 forecast. |
| First date versus broader dating | An initial romantic meeting versus dating across stages, sometimes including existing partners. | Broader financial-flag and walking-date results are explicitly labeled. |
| Scenario rating | A response to an experimentally described fictional date. | A 9-point mean is not a percentage, real message outcome or national success rate. |
| Percentage point / currency / scale point | The unit of an absolute difference. | The comparison table uses the appropriate unit for each pair; no incompatible values are pooled. |
| Comparison | What matches or differs | Appropriate interpretation | Original evidence |
|---|---|---|---|
| Own / expected first-date timing | Same full codebook denominator, separate marginal items | Compare question margins; do not infer individual inconsistencies or disclosure obligations. | S01 / Q24–Q25 |
| Canadian payment norms by gender | Same open-coded question and period | Retain n=486/411 and compare opinions rather than actual coupled payments. | S03 / p.11 |
| GB home-visit acceptance | Same scenarios and historical period | An opinion gap is neither a risk estimate nor consent. | S02 / p.2 |
| UK appropriate / reported cost | Same source, GBP and January 2024 | Compare means descriptively; item-valid bases and precision are not supplied. | S05 |
| Three texting outcomes | Same randomized scenario experiment, distinct rating scales | Retain the source’s non-significant immediate/morning contrasts for chemistry and motivation. | S09 |
| Canada / UK / Australia costs or payment | Different currencies, instruments and eligible groups | Use separate context; no pooled price, converted national ranking or universal etiquette. | Definitions matter |
7.0% / 11.6%
36.5% / 36.9%
Expected first-date income disclosure versus own willingness.US opt-in singles study, March–April 2026; separate marginal questions
Match / Kinsey Institute at Indiana University ·
Expected employment disclosure versus own willingness on the first date.Same 2026 codebook; n=4,952
Match / Kinsey Institute at Indiana University ·
29.4%
38.6% / 12.7%
Chose a quick/easy activity as their single ideal first date.US singles study, 2026; preferences rather than behavior
Match / Kinsey Institute at Indiana University ·
Selected frequent phone checks versus splitting the bill as turn-offs.US singles study, 2026; overlapping responses
Match / Kinsey Institute at Indiana University ·
10.4% / 30.5%
45.1%
Were very/somewhat likely to try again after an imagined unexciting date.Hypothetical second-date likelihood, not conversion
Match / Kinsey Institute at Indiana University ·
Said the first-date bill should be split or shared.Canada, December 2025; payment-question n=897
Nanos Research / The Globe and Mail ·
51.0% / 39.1%
CAD66.20
Women/men favoring splitting or sharing the first-date bill.Canada, December 2025; n=411 / 486
Nanos Research / The Globe and Mail ·
Mean stated willingness to spend on a first date.Canadian current daters; question n=73, numerical valid n unreported
Nanos Research / The Globe and Mail ·
2%–4%
GBP45 / GBP38
Chose the first date as the starting point across six financial topics.US adult survey, December 2025; normative timing
Bankrate / YouGov ·
Believed-appropriate first-date cost versus reported spending.UK, January 2024; historic self-reported means
Aqua ·
44%
6.15 / 5.80
Favored splitting equally in the Australian listed-choice question.Australia, December 2025; release sample n=1,006
Finder / Qualtrics ·
Next-morning/immediate mean relationship-intention ratings.9-point fictional-scenario scale; April 2024 experiment
Teichmann, Petrowsky, Boecker, Soliman and Loschelder / Journal of Social and Personal Relationships ·
ALSO READ:-
Dating Intentions And Commitment Statistics 2027
Teen Online Safety Statistics 2027
Family Structure Statistics 2027
Shared Meals And Social Connection Statistics 2027
Grandparent Grandchild Relationship Statistics 2027
What do singles expect a date to share, and what would they share themselves?
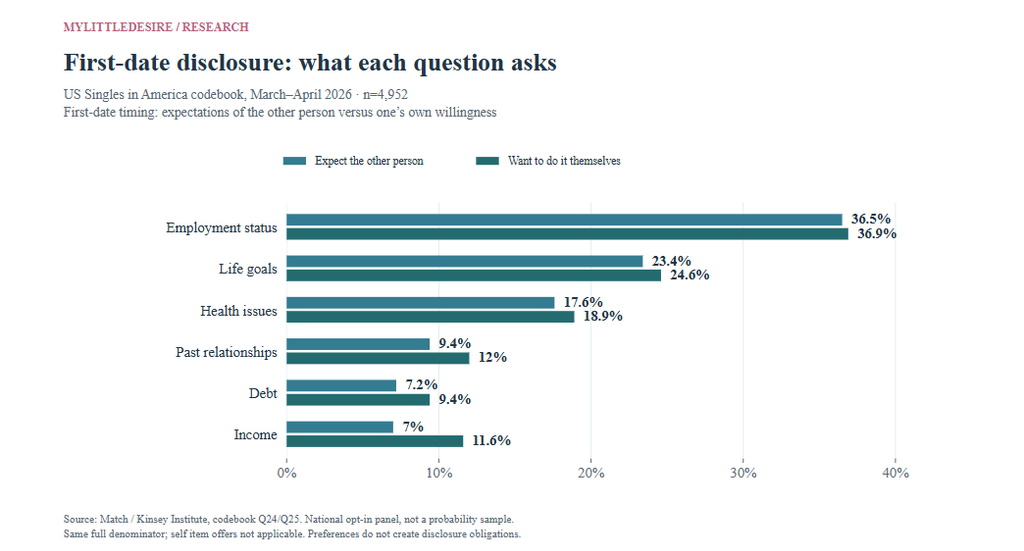
The 2026 Singles in America codebook separates expectations of a date from one’s own desired timing. For income, 7.0% expected first-date disclosure from the other person, while 11.6% wanted to disclose their own income then. The 4.6-point difference is a comparison of margins, not evidence that particular people have inconsistent standards.
| ID | Finding and qualification | Population, actual period and base | Original source and locator |
|---|---|---|---|
| F01 | The ideal first date was quick/easy for 29.4%, formal dining for 21.0%, an intimate activity such as a movie at home for 14.0%, outdoors for 13.7%, friends for 8.8%, adventure for 5.7% and educational for 4.3%. Definition: Q18 single ideal-date choice; 3.1% selected other. Qualification: A single preferred option is not the same as accepting several activities, observed behavior or a safety endorsement. | US Singles in America respondents 18+ under its study definition United States March–April 2026 Published eligible item/group base(s): 4,952. An overall report n is not a subgroup base. | Match / Kinsey Institute at Indiana University Published 2026-09-14 university release; Match release 2026-09-10 Codebook p.43, Q18 Study methods and limits |
| F02 | For sharing employment status, 36.5% expected this from the other person on the first date; 36.9% wanted to do it themselves then. Definition: Q24r1 expectations of the other person versus Q25r1 own desired timing; first-date response. Qualification: Separate marginal items; own question also offers not applicable. This does not measure actual disclosure or which people hold different standards. Private information is not owed to a date. | US Singles in America respondents 18+ under its study definition United States March–April 2026 Published eligible item/group base(s): 4,952. An overall report n is not a subgroup base. | Match / Kinsey Institute at Indiana University Published 2026-09-14 university release; Match release 2026-09-10 Codebook pp.56 and 63, Q24r1/Q25r1 Study methods and limits |
| F03 | For sharing life goals, 23.4% expected this from the other person on the first date; 24.6% wanted to do it themselves then. Definition: Q24r2 expectations of the other person versus Q25r2 own desired timing; first-date response. Qualification: Separate marginal items; own question also offers not applicable. This does not measure actual disclosure or which people hold different standards. Private information is not owed to a date. | US Singles in America respondents 18+ under its study definition United States March–April 2026 Published eligible item/group base(s): 4,952. An overall report n is not a subgroup base. | Match / Kinsey Institute at Indiana University Published 2026-09-14 university release; Match release 2026-09-10 Codebook pp.56 and 64, Q24r2/Q25r2 Study methods and limits |
| F04 | For sharing income, 7.0% expected this from the other person on the first date; 11.6% wanted to do it themselves then. Definition: Q24r3 expectations of the other person versus Q25r3 own desired timing; first-date response. Qualification: Separate marginal items; own question also offers not applicable. This does not measure actual disclosure or which people hold different standards. Private information is not owed to a date. | US Singles in America respondents 18+ under its study definition United States March–April 2026 Published eligible item/group base(s): 4,952. An overall report n is not a subgroup base. | Match / Kinsey Institute at Indiana University Published 2026-09-14 university release; Match release 2026-09-10 Codebook pp.57 and 65, Q24r3/Q25r3 Study methods and limits |
| F05 | For sharing debt, 7.2% expected this from the other person on the first date; 9.4% wanted to do it themselves then. Definition: Q24r4 expectations of the other person versus Q25r4 own desired timing; first-date response. Qualification: Separate marginal items; own question also offers not applicable. This does not measure actual disclosure or which people hold different standards. Private information is not owed to a date. | US Singles in America respondents 18+ under its study definition United States March–April 2026 Published eligible item/group base(s): 4,952. An overall report n is not a subgroup base. | Match / Kinsey Institute at Indiana University Published 2026-09-14 university release; Match release 2026-09-10 Codebook pp.57 and 66, Q24r4/Q25r4 Study methods and limits |
| F06 | For sharing health issues, 17.6% expected this from the other person on the first date; 18.9% wanted to do it themselves then. Definition: Q24r12 expectations of the other person versus Q25r12 own desired timing; first-date response. Qualification: Separate marginal items; own question also offers not applicable. This does not measure actual disclosure or which people hold different standards. Private information is not owed to a date. | US Singles in America respondents 18+ under its study definition United States March–April 2026 Published eligible item/group base(s): 4,952. An overall report n is not a subgroup base. | Match / Kinsey Institute at Indiana University Published 2026-09-14 university release; Match release 2026-09-10 Codebook pp.62 and 74, Q24r12/Q25r12 Study methods and limits |
| F07 | For sharing past relationships, 9.4% expected this from the other person on the first date; 12.0% wanted to do it themselves then. Definition: Q24r9 expectations of the other person versus Q25r9 own desired timing; first-date response. Qualification: Separate marginal items; own question also offers not applicable. This does not measure actual disclosure or which people hold different standards. Private information is not owed to a date. | US Singles in America respondents 18+ under its study definition United States March–April 2026 Published eligible item/group base(s): 4,952. An overall report n is not a subgroup base. | Match / Kinsey Institute at Indiana University Published 2026-09-14 university release; Match release 2026-09-10 Codebook pp.60 and 71, Q24r9/Q25r9 Study methods and limits |
| F08 | For sharing sexual history/number of partners, 10.8% expected this from the other person on the first date; 11.2% wanted to do it themselves then. Definition: Q24r10 expectations of the other person versus Q25r10 own desired timing; first-date response. Qualification: Separate marginal items; own question also offers not applicable. This does not measure actual disclosure or which people hold different standards. Private information is not owed to a date. | US Singles in America respondents 18+ under its study definition United States March–April 2026 Published eligible item/group base(s): 4,952. An overall report n is not a subgroup base. | Match / Kinsey Institute at Indiana University Published 2026-09-14 university release; Match release 2026-09-10 Codebook pp.61 and 72, Q24r10/Q25r10 Study methods and limits |
| F09 | For introductions to friends, 4.0% expected this from the other person on the first date; 5.7% wanted to do it themselves then. Definition: Q24r6 expectations of the other person versus Q25r6 own desired timing; first-date response. Qualification: Separate marginal items; own question also offers not applicable. This does not measure actual disclosure or which people hold different standards. Private information is not owed to a date. | US Singles in America respondents 18+ under its study definition United States March–April 2026 Published eligible item/group base(s): 4,952. An overall report n is not a subgroup base. | Match / Kinsey Institute at Indiana University Published 2026-09-14 university release; Match release 2026-09-10 Codebook pp.59 and 68, Q24r6/Q25r6 Study methods and limits |
| F10 | For introductions to family, 3.1% expected this from the other person on the first date; 4.9% wanted to do it themselves then. Definition: Q24r7 expectations of the other person versus Q25r7 own desired timing; first-date response. Qualification: Separate marginal items; own question also offers not applicable. This does not measure actual disclosure or which people hold different standards. Private information is not owed to a date. | US Singles in America respondents 18+ under its study definition United States March–April 2026 Published eligible item/group base(s): 4,952. An overall report n is not a subgroup base. | Match / Kinsey Institute at Indiana University Published 2026-09-14 university release; Match release 2026-09-10 Codebook pp.59 and 69, Q24r7/Q25r7 Study methods and limits |
Which behaviors make a first date less appealing?
In that study, frequent phone checks and talking about exes were selected more often as turn-offs than asking to split the bill. These are separate multiple-response impressions. They do not tell us how often the behavior happened or whether it prevented another date.
| ID | Finding and qualification | Population, actual period and base | Original source and locator |
|---|---|---|---|
| F11 | Frequent phone checks turned off 38.6%, talking about exes 37.0% and discussing other dates 25.4%. Definition: Q58 selected first-date turn-offs; multiple responses. Qualification: Not the share who actually experienced the behavior or would certainly refuse a second date. | US Singles in America respondents 18+ under its study definition United States March–April 2026 Published eligible item/group base(s): 4,952. An overall report n is not a subgroup base. | Match / Kinsey Institute at Indiana University Published 2026-09-14 university release; Match release 2026-09-10 Codebook pp.173–174, Q58r9/r12/r14 Study methods and limits |
| F12 | Talking too much was a turn-off for 13.7%, too little 12.3%, too many questions 8.9%, too few questions 8.6%, excessive money talk 16.3% and excessive career talk 6.8%. Definition: Q58 separate conversation turn-offs, multiple selections. Qualification: Topic and intensity matter: excessive talk is not equivalent to any discussion. Do not sum overlapping answers. | US Singles in America respondents 18+ under its study definition United States March–April 2026 Published eligible item/group base(s): 4,952. An overall report n is not a subgroup base. | Match / Kinsey Institute at Indiana University Published 2026-09-14 university release; Match release 2026-09-10 Codebook pp.170–172, Q58r1–r7 Study methods and limits |
| F13 | Asking to split the bill was a turn-off for 12.7%; trying too hard to impress for 16.9%, overdressing 4.6% and underdressing 6.6%. Definition: Q58 separate first-date turn-offs, multiple responses. Qualification: The complement is not necessarily endorsement or a preferred payment rule. | US Singles in America respondents 18+ under its study definition United States March–April 2026 Published eligible item/group base(s): 4,952. An overall report n is not a subgroup base. | Match / Kinsey Institute at Indiana University Published 2026-09-14 university release; Match release 2026-09-10 Codebook pp.172–174, Q58r8/r10/r11/r13 Study methods and limits |
What happens after an unexciting first date?
The codebook asked whether people would try again after an imagined unexciting first date. It also asked how they decline another meeting. These hypothetical and self-described answers differ from a measured second-date conversion rate. AI-assisted planning was another specific first-date question.
| ID | Finding and qualification | Population, actual period and base | Original source and locator |
|---|---|---|---|
| F14 | After a hypothetical unexciting first date, 10.4% were very likely and 30.5% somewhat likely to try a second; 26.1% were very unlikely and 33.1% somewhat unlikely. Definition: Q27 imagined first date that was not exciting. Qualification: Hypothetical likelihood, not an observed second-date conversion rate; rounded response percentages need not total 100. | US Singles in America respondents 18+ under its study definition United States March–April 2026 Published eligible item/group base(s): 4,952. An overall report n is not a subgroup base. | Match / Kinsey Institute at Indiana University Published 2026-09-14 university release; Match release 2026-09-10 Codebook p.80, Q27 Study methods and limits |
| F15 | To indicate no further interest, 35.1% said face-to-face, 17.2% an immediate text, 20.4% replying directly when contacted, 17.4% fading out and 10.7% ghosting. Definition: Q28 self-described ways to decline another date; multiple responses. Qualification: Not an event-based victimization rate or proof that these methods resolve the interaction; not exclusive categories. | US Singles in America respondents 18+ under its study definition United States March–April 2026 Published eligible item/group base(s): 4,952. An overall report n is not a subgroup base. | Match / Kinsey Institute at Indiana University Published 2026-09-14 university release; Match release 2026-09-10 Codebook pp.80–82, Q28r1/r2/r3/r5/r6 Study methods and limits |
| F16 | For their most recent first date, 17.0% named meeting through a friend, 16.0% a dating app/site, 10.9% social networks and 8.4% work. Definition: Q10 meeting route, codebook percentages based on all study respondents. Qualification: Denominator includes people choosing never been on a first date; these are not shares among only people who dated, or only new dates in 2026. | US Singles in America respondents 18+ under its study definition United States March–April 2026 Published eligible item/group base(s): 4,952. An overall report n is not a subgroup base. | Match / Kinsey Institute at Indiana University Published 2026-09-14 university release; Match release 2026-09-10 Codebook p.24, Q10 Study methods and limits |
| F17 | 13.8% selected that they had never been on a first date. Definition: Q10 never-first-date response among all study respondents. Qualification: Not a national adult prevalence estimate from a probability sample or a rate among all Gen Z adults. | US Singles in America respondents 18+ under its study definition United States March–April 2026 Published eligible item/group base(s): 4,952. An overall report n is not a subgroup base. | Match / Kinsey Institute at Indiana University Published 2026-09-14 university release; Match release 2026-09-10 Codebook p.24, Q10 Study methods and limits |
| F18 | 19.3% selected AI use to plan their first date as a dealbreaker. Definition: Q109r5, selected among multiple potential AI-use dealbreakers. Qualification: Not the proportion opposed to every form of AI use or whose date actually used AI. | US Singles in America respondents 18+ under its study definition United States March–April 2026 Published eligible item/group base(s): 4,952. An overall report n is not a subgroup base. | Match / Kinsey Institute at Indiana University Published 2026-09-14 university release; Match release 2026-09-10 Codebook p.323, Q109r5 Study methods and limits |
Which first-date activities were considered acceptable in Britain?
In the historical January–February 2022 GB survey, coffee and dinner each received 93% acceptable ratings. That does not mean each was the single favorite date. Approval of an activity, choosing it as ideal and actually doing it are separate measures.
| ID | Finding and qualification | Population, actual period and base | Original source and locator |
|---|---|---|---|
| F19 | Coffee and dinner each received 93% acceptable ratings; a walk 92%, pub/bar drinks 91%, a museum/gallery 89% and cinema 86%. Definition: Totals of mostly/totally acceptable for each separate activity. Qualification: Historical opinions; activities overlap and are not exclusive favorites. Acceptance does not establish safety or romantic outcomes. | GB adults 18+ Great Britain, excluding Northern Ireland January 31–February 1, 2022 Published eligible item/group base(s): 1,686. An overall report n is not a subgroup base. | YouGov Published 2022-02-11 Original tables physical p.1–3 Study methods and limits |
| F20 | A wedding plus-one was acceptable to 28% and unacceptable to 60%; meeting family was acceptable to 17% and unacceptable to 72%. Definition: Separate activity approval items. Qualification: General public attitudes, not a judgment on a particular date. | GB adults 18+ Great Britain, excluding Northern Ireland January 31–February 1, 2022 Published eligible item/group base(s): 1,686. An overall report n is not a subgroup base. | YouGov Published 2022-02-11 Original tables physical p.1 and 4 Study methods and limits |
| F21 | An entirely video-call first date was acceptable to 32%, unacceptable to 55% and unknown to 14%. Definition: Video-first-date acceptability, rounded categories. Qualification: Pandemic-era survey; not observed video dating or a current technology preference. | GB adults 18+ Great Britain, excluding Northern Ireland January 31–February 1, 2022 Published eligible item/group base(s): 1,686. An overall report n is not a subgroup base. | YouGov Published 2022-02-11 Original tables physical p.3 Study methods and limits |
| F22 | Video first dates were acceptable to 44% of 18–24-year-olds and 21% of those 65+; unacceptable shares were 41% and 65%. Definition: Age-group acceptance of the same activity. Qualification: Cross-sectional historical groups; not change as the same individuals age. | GB adults 18+ Great Britain, excluding Northern Ireland January 31–February 1, 2022 Published eligible item/group base(s): 145, 471. An overall report n is not a subgroup base. | YouGov Published 2022-02-11 Original tables physical p.3 Study methods and limits |
How did first-date home-visit and intimacy opinions differ?
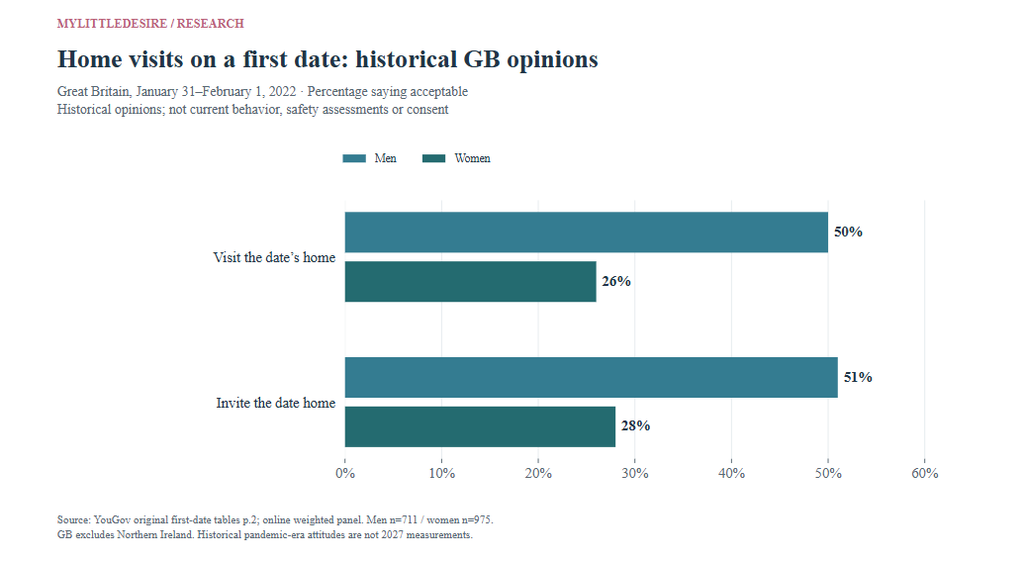
Men and women gave different acceptance ratings for visiting or hosting a date at home in the same 2022 survey. The chart shows those opinion gaps using the printed gender bases. Public approval is neither a safety assessment nor an individual person’s consent.
| ID | Finding and qualification | Population, actual period and base | Original source and locator |
|---|---|---|---|
| F23 | Going to a date’s home was acceptable to 38% and unacceptable to 51%; inviting them home was acceptable to 39% and unacceptable to 50%. Definition: Two direction-specific home-visit opinion items. Qualification: Not safety assessments or estimates of actual home visits. | GB adults 18+ Great Britain, excluding Northern Ireland January 31–February 1, 2022 Published eligible item/group base(s): 1,686. An overall report n is not a subgroup base. | YouGov Published 2022-02-11 Original tables physical p.2 Study methods and limits |
| F24 | Visiting a date’s home was acceptable to 50% of men versus 26% of women; hosting a date was acceptable to 51% versus 28%. Definition: Matched gender comparisons for two separate home-visit scenarios. Qualification: Published unweighted gender bases retained; margins do not show individual disagreements or danger. | GB adults 18+ Great Britain, excluding Northern Ireland January 31–February 1, 2022 Published eligible item/group base(s): 711, 975. An overall report n is not a subgroup base. | YouGov Published 2022-02-11 Original tables physical p.2 Study methods and limits |
| F25 | Shopping and a double date each received 58% acceptable and 32% unacceptable ratings. Definition: Separate social-activity acceptability items. Qualification: Approval is not selection as the single best date or an actual participation rate. | GB adults 18+ Great Britain, excluding Northern Ireland January 31–February 1, 2022 Published eligible item/group base(s): 1,686. An overall report n is not a subgroup base. | YouGov Published 2022-02-11 Original tables physical p.4 Study methods and limits |
| F26 | Physical activities such as a gym class or swimming were acceptable to 49%, unacceptable to 39% and unknown to 12%. Definition: Physical-activity first-date acceptability. Qualification: Preferences alone do not assess suitability or safety for an individual. | GB adults 18+ Great Britain, excluding Northern Ireland January 31–February 1, 2022 Published eligible item/group base(s): 1,686. An overall report n is not a subgroup base. | YouGov Published 2022-02-11 Original tables physical p.3 Study methods and limits |
| F27 | Kissing was acceptable to 79%, holding hands to 81% and hugging to 86%; unacceptable shares were 13%, 10% and 8%. Definition: On or just after the first date; separate intimate-activity opinion items. Qualification: Population approval never supplies an individual person’s consent or obligation. | GB adults 18+ Great Britain, excluding Northern Ireland January 31–February 1, 2022 Published eligible item/group base(s): 1,686. An overall report n is not a subgroup base. | YouGov Published 2022-02-11 Original tables physical p.4–5 Study methods and limits |
| F28 | Sex on/just after a first date was acceptable to 36% overall, 45% of men and 28% of women; sleeping in the same bed was acceptable to 37% overall. Definition: Separate opinion items, not sexual behavior or relationship outcomes. Qualification: Historical adult attitudes; no inference about consent, morality or relationship durability. | GB adults 18+ Great Britain, excluding Northern Ireland January 31–February 1, 2022 Published eligible item/group base(s): 711, 975, 1,686. An overall report n is not a subgroup base. | YouGov Published 2022-02-11 Original tables physical p.5 Study methods and limits |
Who do Canadians think should pay on a first date?
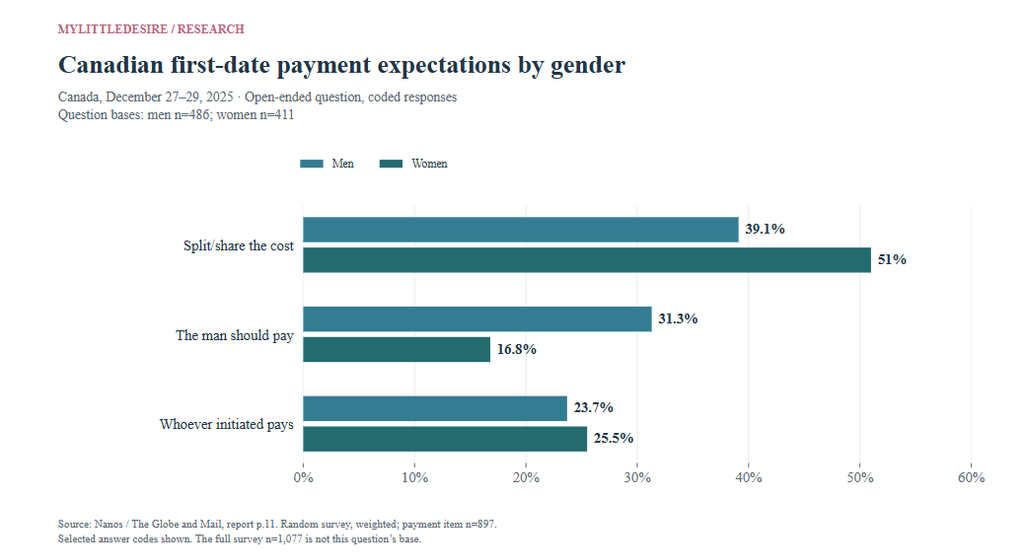
Splitting or sharing was the leading coded answer in the Canadian payment question. Women selected it more often than men, while men more often selected the man paying. This question has n=897, rather than the full survey’s n=1,077.
| ID | Finding and qualification | Population, actual period and base | Original source and locator |
|---|---|---|---|
| F29 | 45.1% said split/share the first-date bill, 24.6% whoever initiated, 23.9% the man and 4.8% decide on the date. Definition: Open-ended question coded to payment rules. Qualification: Not behavior or a rule all Canadians follow. The printed n=897 differs from the full survey n=1,077. | Canadian adult payment-question respondents; n=897 Canada December 27–29, 2025 Published eligible item/group base(s): 897. An overall report n is not a subgroup base. | Nanos Research / The Globe and Mail Published Report says January 2026 release; landing page 2026-02-12 Report physical p.11 Study methods and limits |
| F30 | 51.0% of women and 39.1% of men favored splitting/sharing the bill. Definition: Same coded split/share response by gender. Qualification: Unadjusted group margins, not actual paired disagreements. | Canadian adult payment-question respondents; gender groups Canada December 27–29, 2025 Published eligible item/group base(s): 411, 486. An overall report n is not a subgroup base. | Nanos Research / The Globe and Mail Published Report says January 2026 release; landing page 2026-02-12 Report physical p.11 Study methods and limits |
| F31 | 31.3% of men and 16.8% of women said the man should pay. Definition: Same coded the-man response by gender. Qualification: Descriptive gender comparison under the original question; not a universal heterosexual norm. | Canadian adult payment-question respondents; gender groups Canada December 27–29, 2025 Published eligible item/group base(s): 411, 486. An overall report n is not a subgroup base. | Nanos Research / The Globe and Mail Published Report says January 2026 release; landing page 2026-02-12 Report physical p.11 Study methods and limits |
| F32 | 25.5% of women and 23.7% of men said whoever initiated should pay. Definition: Same coded initiator response by gender. Qualification: A small margin is not a new claim of statistical significance. | Canadian adult payment-question respondents; gender groups Canada December 27–29, 2025 Published eligible item/group base(s): 411, 486. An overall report n is not a subgroup base. | Nanos Research / The Globe and Mail Published Report says January 2026 release; landing page 2026-02-12 Report physical p.11 Study methods and limits |
| F33 | Splitting/sharing was favored by 38.4% at ages 18–34, 50.0% at 35–54 and 45.9% at 55+. Definition: Coded payment norm by age. Qualification: Cross-sectional age groups, not a generation effect or changing individual preference. | Canadian adult payment-question respondents; separate age groups Canada December 27–29, 2025 Published eligible item/group base(s): 167, 341, 389. An overall report n is not a subgroup base. | Nanos Research / The Globe and Mail Published Report says January 2026 release; landing page 2026-02-12 Report physical p.11 Study methods and limits |
| F34 | The initiator-pay answer drew 33.1% at ages 18–34, 19.4% at 35–54 and 22.9% at 55+. Definition: Coded initiator norm by age. Qualification: Different group sizes and unadjusted margins; no new significance test. | Canadian adult payment-question respondents; separate age groups Canada December 27–29, 2025 Published eligible item/group base(s): 167, 341, 389. An overall report n is not a subgroup base. | Nanos Research / The Globe and Mail Published Report says January 2026 release; landing page 2026-02-12 Report physical p.11 Study methods and limits |
What are Canadian current daters willing to spend?
The spending question reported mean willingness of CAD66.20 and a median of CAD50.00. It was routed to a small current-dater group, n=73, and some respondents were unsure or said not applicable. These are willingness measures, rather than actual national first-date spending.
| ID | Finding and qualification | Population, actual period and base | Original source and locator |
|---|---|---|---|
| F35 | Current daters’ mean willingness to spend was CAD66.20 and the median CAD50.00. Definition: Stated willingness, not actual spend; question base n=73. Qualification: Numerical valid n for the mean/median not separately supplied; the percentage margin is not a dollar confidence interval. | Canadian current daters answering the first-date spending question Canada December 27–29, 2025 Exact item/subgroup valid n is not printed beside these selected figures. An overall report n is not a subgroup base. | Nanos Research / The Globe and Mail Published Report says January 2026 release; landing page 2026-02-12 Report physical p.10 Study methods and limits |
| F36 | 15.3% would pay nothing, 28.7% over CAD25 to CAD50, 20.8% over CAD75 to CAD100 and 9.5% over CAD100; 16.4% were unsure/not applicable. Definition: Selected spending bands; other intermediate bands are not listed in this summary. Qualification: Small routed base; percentages include unsure/not applicable. No claim all daters answered a numeric amount. | Canadian current daters in the spending question, n=73 Canada December 27–29, 2025 Published eligible item/group base(s): 73. An overall report n is not a subgroup base. | Nanos Research / The Globe and Mail Published Report says January 2026 release; landing page 2026-02-12 Report physical p.10 Study methods and limits |
When do Americans think financial conversations should start?
In Bankrate’s December 2025 survey, first-date answers ranged from 2% to 4% across six financial topics. A few months of dating was more commonly selected for each. This is an opinion about when a topic should start, rather than a prohibition on earlier conversation.
| ID | Finding and qualification | Population, actual period and base | Original source and locator |
|---|---|---|---|
| F37 | For debt, 2% chose the first date, 13% after the first few dates and 49% after a few months. Definition: When discussion should start; selected timing options for one topic. Qualification: Normative timing, not a ban, actual disclosures or evidence that later is better. Not the separate married/live-in base. | US adults 18+ United States December 2–8, 2025 Published eligible item/group base(s): 2,564. An overall report n is not a subgroup base. | Bankrate / YouGov Published 2026-02-09 Release table: How early in a romantic relationship Americans believe discussion should start Study methods and limits |
| F38 | For spending habits, 3% chose the first date, 25% after the first few dates and 45% after a few months. Definition: When discussion should start; selected timing options for one topic. Qualification: Normative timing, not a ban, actual disclosures or evidence that later is better. Not the separate married/live-in base. | US adults 18+ United States December 2–8, 2025 Published eligible item/group base(s): 2,564. An overall report n is not a subgroup base. | Bankrate / YouGov Published 2026-02-09 Release table: How early in a romantic relationship Americans believe discussion should start Study methods and limits |
| F39 | For financial goals, 4% chose the first date, 19% after the first few dates and 43% after a few months. Definition: When discussion should start; selected timing options for one topic. Qualification: Normative timing, not a ban, actual disclosures or evidence that later is better. Not the separate married/live-in base. | US adults 18+ United States December 2–8, 2025 Published eligible item/group base(s): 2,564. An overall report n is not a subgroup base. | Bankrate / YouGov Published 2026-02-09 Release table: How early in a romantic relationship Americans believe discussion should start Study methods and limits |
| F40 | For salary, 3% chose the first date, 15% after the first few dates and 43% after a few months. Definition: When discussion should start; selected timing options for one topic. Qualification: Normative timing, not a ban, actual disclosures or evidence that later is better. Not the separate married/live-in base. | US adults 18+ United States December 2–8, 2025 Published eligible item/group base(s): 2,564. An overall report n is not a subgroup base. | Bankrate / YouGov Published 2026-02-09 Release table: How early in a romantic relationship Americans believe discussion should start Study methods and limits |
| F41 | For credit scores, 2% chose the first date, 9% after the first few dates and 42% after a few months. Definition: When discussion should start; selected timing options for one topic. Qualification: Normative timing, not a ban, actual disclosures or evidence that later is better. Not the separate married/live-in base. | US adults 18+ United States December 2–8, 2025 Published eligible item/group base(s): 2,564. An overall report n is not a subgroup base. | Bankrate / YouGov Published 2026-02-09 Release table: How early in a romantic relationship Americans believe discussion should start Study methods and limits |
| F42 | For savings/investments, 2% chose the first date, 7% after the first few dates and 36% after a few months. Definition: When discussion should start; selected timing options for one topic. Qualification: Normative timing, not a ban, actual disclosures or evidence that later is better. Not the separate married/live-in base. | US adults 18+ United States December 2–8, 2025 Published eligible item/group base(s): 2,564. An overall report n is not a subgroup base. | Bankrate / YouGov Published 2026-02-09 Release table: How early in a romantic relationship Americans believe discussion should start Study methods and limits |
How does believed-appropriate first-date cost compare with reported spending?
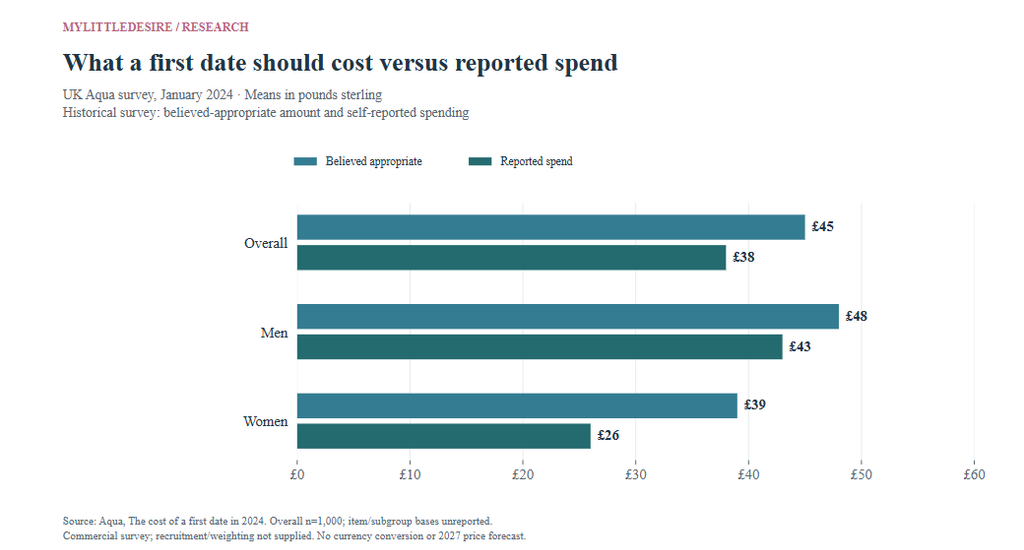
Aqua’s January 2024 study presented two different means: what respondents thought appropriate and what they reported spending. The difference was GBP7 overall, GBP5 for men and GBP13 for women. The study did not provide the item-valid bases needed to assess the precision of these differences.
| ID | Finding and qualification | Population, actual period and base | Original source and locator |
|---|---|---|---|
| F43 | Overall: believed-appropriate first-date cost was GBP45; reported spending was GBP38. Definition: Two published means: believed-appropriate cost versus self-reported spending. Qualification: Historical commercial survey; item/subgroup valid n and generation cutoffs not supplied. Reported spend is not transaction-verified or a recommended budget. | UK consumers in the Aqua survey; relevant cost subgroup as published; Overall United Kingdom January 2024 Exact item/subgroup valid n is not printed beside these selected figures. An overall report n is not a subgroup base. | Aqua Published 2024-03-28; page says reviewed 2024-03-28 Article: How much should a first date cost? Study methods and limits |
| F44 | Men: believed-appropriate first-date cost was GBP48; reported spending was GBP43. Definition: Two published means: believed-appropriate cost versus self-reported spending. Qualification: Historical commercial survey; item/subgroup valid n and generation cutoffs not supplied. Reported spend is not transaction-verified or a recommended budget. | UK consumers in the Aqua survey; relevant cost subgroup as published; Men United Kingdom January 2024 Exact item/subgroup valid n is not printed beside these selected figures. An overall report n is not a subgroup base. | Aqua Published 2024-03-28; page says reviewed 2024-03-28 Article: How much should a first date cost? Study methods and limits |
| F45 | Women: believed-appropriate first-date cost was GBP39; reported spending was GBP26. Definition: Two published means: believed-appropriate cost versus self-reported spending. Qualification: Historical commercial survey; item/subgroup valid n and generation cutoffs not supplied. Reported spend is not transaction-verified or a recommended budget. | UK consumers in the Aqua survey; relevant cost subgroup as published; Women United Kingdom January 2024 Exact item/subgroup valid n is not printed beside these selected figures. An overall report n is not a subgroup base. | Aqua Published 2024-03-28; page says reviewed 2024-03-28 Article: How much should a first date cost? Study methods and limits |
| F46 | Gen Z: believed-appropriate first-date cost was GBP48; reported spending was GBP56. Definition: Two published means: believed-appropriate cost versus self-reported spending. Qualification: Historical commercial survey; item/subgroup valid n and generation cutoffs not supplied. Reported spend is not transaction-verified or a recommended budget. | UK consumers in the Aqua survey; relevant cost subgroup as published; Gen Z United Kingdom January 2024 Exact item/subgroup valid n is not printed beside these selected figures. An overall report n is not a subgroup base. | Aqua Published 2024-03-28; page says reviewed 2024-03-28 Article: How much should a first date cost? Study methods and limits |
| F47 | Baby Boomers: believed-appropriate first-date cost was GBP41; reported spending was GBP30. Definition: Two published means: believed-appropriate cost versus self-reported spending. Qualification: Historical commercial survey; item/subgroup valid n and generation cutoffs not supplied. Reported spend is not transaction-verified or a recommended budget. | UK consumers in the Aqua survey; relevant cost subgroup as published; Baby Boomers United Kingdom January 2024 Exact item/subgroup valid n is not printed beside these selected figures. An overall report n is not a subgroup base. | Aqua Published 2024-03-28; page says reviewed 2024-03-28 Article: How much should a first date cost? Study methods and limits |
| F48 | 27% favored splitting evenly overall, including 37% of women and 23% of men. Definition: Published evenly-split opinion, not observed bill settlement. Qualification: Historical 2024; exact valid bases and response instrument not published. | UK consumers in the Aqua survey; relevant cost subgroup as published; payment-opinion groups United Kingdom January 2024 Exact item/subgroup valid n is not printed beside these selected figures. An overall report n is not a subgroup base. | Aqua Published 2024-03-28; page says reviewed 2024-03-28 Article: Dating attitudes amid rising costs Study methods and limits |
| F49 | 24% of 16–24-year-olds favored the asker paying, compared with 9% of those over 45. Definition: Published asker-pay opinions by source age group. Qualification: Includes some under-18 respondents; do not relabel this as an adults-18+ or Gen-Z-only comparison. | UK consumers in the Aqua survey; relevant cost subgroup as published; age groups 16–24 and over 45 United Kingdom January 2024 Exact item/subgroup valid n is not printed beside these selected figures. An overall report n is not a subgroup base. | Aqua Published 2024-03-28; page says reviewed 2024-03-28 Article: Dating attitudes amid rising costs Study methods and limits |
How do people view cheaper dates and splitting costs?
The NerdWallet findings describe broader early dating, rather than first dates alone. A low-cost date could be a green, yellow or red flag depending on the respondent. Those ratings should not be confused with actual rejection or a universal payment rule.
| ID | Finding and qualification | Population, actual period and base | Original source and locator |
|---|---|---|---|
| F50 | For suggesting low-cost dates, 47% saw a green flag, 18% a red flag and 36% a yellow flag. Definition: General dating-behavior appraisal; red/yellow/green options. Qualification: Not first-date-only or a real rejection rate. Rounded categories can total 101. | US adults 18+ United States December 2–4, 2025 Published eligible item/group base(s): 2,095. An overall report n is not a subgroup base. | NerdWallet / The Harris Poll Published 2026-02-03 Original article: financial behavior flags Study methods and limits |
| F51 | For splitting dates 50/50, 39% saw a green flag, 27% a red flag and 34% a yellow flag. Definition: General dating-behavior appraisal; red/yellow/green options. Qualification: Not first-date-only or a real rejection rate. Rounded categories can total 101. | US adults 18+ United States December 2–4, 2025 Published eligible item/group base(s): 2,095. An overall report n is not a subgroup base. | NerdWallet / The Harris Poll Published 2026-02-03 Original article: financial behavior flags Study methods and limits |
| F52 | For talking about money early, 19% saw a green flag, 42% a red flag and 39% a yellow flag. Definition: General dating-behavior appraisal; red/yellow/green options. Qualification: Not first-date-only or a real rejection rate. Rounded categories can total 101. | US adults 18+ United States December 2–4, 2025 Published eligible item/group base(s): 2,095. An overall report n is not a subgroup base. | NerdWallet / The Harris Poll Published 2026-02-03 Original article: financial behavior flags Study methods and limits |
What do walking-date and Australian payment surveys add?
The UK walking survey found 24% would choose a walk as a first date; its other trait questions cover walking dates more broadly. The Australian payment survey used a listed set of choices rather than Canada’s open coding. Their different populations and formats do not support a country ranking.
| ID | Finding and qualification | Population, actual period and base | Original source and locator |
|---|---|---|---|
| F53 | 24% would choose a walking first date; another 14% would do so later. Definition: Willingness to have a walking date at different relationship stages. Qualification: Opinions, not observed first-date activity; exact item-valid n not printed. | UK Censuswide respondents 16+; walking-date items may have unprinted routing United Kingdom September 9–11, 2025 Exact item/subgroup valid n is not printed beside these selected figures. An overall report n is not a subgroup base. | Nationwide / Censuswide Published 2025-09-30 Original release: opening walking-date findings Study methods and limits |
| F54 | Walking-date turn-offs included constant phone checks (41%), walking ahead (21%), sweating (21%) and speaking too loudly (20%). Definition: Walking-date turn-offs; not exclusively first-date questions. Qualification: Exact routing/base not supplied; body-related opinions are not objective faults or safety measures. | UK Censuswide respondents 16+; walking-date items may have unprinted routing United Kingdom September 9–11, 2025 Exact item/subgroup valid n is not printed beside these selected figures. An overall report n is not a subgroup base. | Nationwide / Censuswide Published 2025-09-30 Original release: The BIG ick Study methods and limits |
| F55 | Walking three steps ahead was a turn-off for 26% of women and 16% of men. Definition: Same walking-date behavior by gender. Qualification: Unadjusted margins; subgroup valid n not given, and not a first-date-only rejection measure. | UK Censuswide respondents 16+; walking-date items may have unprinted routing; women and men separately United Kingdom September 9–11, 2025 Exact item/subgroup valid n is not printed beside these selected figures. An overall report n is not a subgroup base. | Nationwide / Censuswide Published 2025-09-30 Original release: walking-ahead gender comparison Study methods and limits |
| F56 | Walking-date green flags included manners (30%), matching pace (25%), a good laugh (24%), smelling good (18%) and undivided attention (18%). Definition: Positive walking-date traits; response-routing details not supplied. Qualification: Not first-date-only, observed compatibility or evidence that a trait causes another date. | UK Censuswide respondents 16+; walking-date items may have unprinted routing United Kingdom September 9–11, 2025 Exact item/subgroup valid n is not printed beside these selected figures. An overall report n is not a subgroup base. | Nationwide / Censuswide Published 2025-09-30 Original release: green flags Study methods and limits |
| F57 | 44% favored splitting equally, 39% the initiator paying, 11% gender-based payment and 6% the higher earner paying. Definition: Single listed payment-rule choice; source’s stated survey n=1,006. Qualification: Age eligibility and item-valid n not printed. Different response options from Nanos; not a national ranking. | Australian Consumer Sentiment Tracker respondents Australia December 2025 Exact item/subgroup valid n is not printed beside these selected figures. An overall report n is not a subgroup base. | Finder / Qualtrics Published 2026-02-10 Australian display date; updated 2026-02-11 Original release: Who do you think should pay on a first date? table Study methods and limits |
Does a next-morning text work better after a first date?
One preregistered experiment found higher relationship-intention ratings for a next-morning text in fictional scenarios. Immediate and next-morning texts did not differ significantly on chemistry or motivation. These are April 2024 scenario ratings from a selected US/UK sample, not observed success rates from real dates.
| ID | Finding and qualification | Population, actual period and base | Original source and locator |
|---|---|---|---|
| F58 | Mean relationship intentions scores were 5.80 for immediate texts, 6.15 next morning and 5.50 after two days. Definition: Published mean on a multi-item 9-point rating scale after randomized fictional timing. Qualification: Scenario ratings, not actual dates/messages, national prevalence or a universal timing rule. The source reports significant condition contrasts for this outcome; this does not establish actual relationship formation. | 543 heterosexual US/UK Prolific participants 18–79 in a fictional-first-date experiment; condition bases not separately established United States and United Kingdom, pooled experimental sample April 2024 Exact item/subgroup valid n is not printed beside these selected figures. An overall report n is not a subgroup base. | Teichmann, Petrowsky, Boecker, Soliman and Loschelder / Journal of Social and Personal Relationships Published First online 2025-09-10; journal issue February 2026, volume 43(2), pp.570–593 Article Main analyses: relationship intentions; printed pp.580–581 Study methods and limits |
| F59 | Mean perceived chemistry scores were 6.41 for immediate texts, 6.49 next morning and 5.77 after two days. Definition: Published mean on a multi-item 9-point rating scale after randomized fictional timing. Qualification: Scenario ratings, not actual dates/messages, national prevalence or a universal timing rule. Immediate versus next morning was not statistically significant in the source (p=.555). | 543 heterosexual US/UK Prolific participants 18–79 in a fictional-first-date experiment; condition bases not separately established United States and United Kingdom, pooled experimental sample April 2024 Exact item/subgroup valid n is not printed beside these selected figures. An overall report n is not a subgroup base. | Teichmann, Petrowsky, Boecker, Soliman and Loschelder / Journal of Social and Personal Relationships Published First online 2025-09-10; journal issue February 2026, volume 43(2), pp.570–593 Article Main analyses: perceived chemistry; printed pp.580–581 Study methods and limits |
| F60 | Mean motivation to reconnect scores were 6.80 for immediate texts, 6.86 next morning and 6.12 after two days. Definition: Published mean on a multi-item 9-point rating scale after randomized fictional timing. Qualification: Scenario ratings, not actual dates/messages, national prevalence or a universal timing rule. Immediate versus next morning was not statistically significant in the source (p=.682). | 543 heterosexual US/UK Prolific participants 18–79 in a fictional-first-date experiment; condition bases not separately established United States and United Kingdom, pooled experimental sample April 2024 Exact item/subgroup valid n is not printed beside these selected figures. An overall report n is not a subgroup base. | Teichmann, Petrowsky, Boecker, Soliman and Loschelder / Journal of Social and Personal Relationships Published First online 2025-09-10; journal issue February 2026, volume 43(2), pp.570–593 Article Main analyses: motivation to reconnect; printed pp.580–581 Study methods and limits |
20 comparisons with reproducible inputs
Results below use percentage points for proportions, GBP for cost differences and scale points for experimental mean differences. Retain the question, base and period when quoting them. They are descriptive arithmetic; no new significance test, individual-response overlap or causal effect is inferred.
| ID | Comparison | Arithmetic and unit | Original inputs and qualification |
|---|---|---|---|
| C01 | employment status: own desired first-date timing minus expectation of date | 36.9 − 36.5 = 0.4 percentage points | F02 / F02 Same overall codebook denominator; separate marginal questions with an extra not-applicable option for self. Not actual behavior, individual discordance or a new significance test. |
| C02 | life goals: own desired first-date timing minus expectation of date | 24.6 − 23.4 = 1.2 percentage points | F03 / F03 Same overall codebook denominator; separate marginal questions with an extra not-applicable option for self. Not actual behavior, individual discordance or a new significance test. |
| C03 | income: own desired first-date timing minus expectation of date | 11.6 − 7 = 4.6 percentage points | F04 / F04 Same overall codebook denominator; separate marginal questions with an extra not-applicable option for self. Not actual behavior, individual discordance or a new significance test. |
| C04 | debt: own desired first-date timing minus expectation of date | 9.4 − 7.2 = 2.2 percentage points | F05 / F05 Same overall codebook denominator; separate marginal questions with an extra not-applicable option for self. Not actual behavior, individual discordance or a new significance test. |
| C05 | health issues: own desired first-date timing minus expectation of date | 18.9 − 17.6 = 1.3 percentage points | F06 / F06 Same overall codebook denominator; separate marginal questions with an extra not-applicable option for self. Not actual behavior, individual discordance or a new significance test. |
| C06 | past relationships: own desired first-date timing minus expectation of date | 12 − 9.4 = 2.6 percentage points | F07 / F07 Same overall codebook denominator; separate marginal questions with an extra not-applicable option for self. Not actual behavior, individual discordance or a new significance test. |
| C07 | sexual history/number of partners: own desired first-date timing minus expectation of date | 11.2 − 10.8 = 0.4 percentage points | F08 / F08 Same overall codebook denominator; separate marginal questions with an extra not-applicable option for self. Not actual behavior, individual discordance or a new significance test. |
| C08 | friends introductions: own desired first-date timing minus expectation of date | 5.7 − 4 = 1.7 percentage points | F09 / F09 Same overall codebook denominator; separate marginal questions with an extra not-applicable option for self. Not actual behavior, individual discordance or a new significance test. |
| C09 | family introductions: own desired first-date timing minus expectation of date | 4.9 − 3.1 = 1.8 percentage points | F10 / F10 Same overall codebook denominator; separate marginal questions with an extra not-applicable option for self. Not actual behavior, individual discordance or a new significance test. |
| C10 | Canada split/share norm: women minus men | 51 − 39.1 = 11.9 percentage points | F30 / F30 Same open-coded payment question; distinct gender groups, not couples. |
| C11 | Canada man-pay norm: men minus women | 31.3 − 16.8 = 14.5 percentage points | F31 / F31 Same payment question and printed subgroup bases; not a universal norm. |
| C12 | Canada initiator-pay norm: women minus men | 25.5 − 23.7 = 1.8 percentage points | F32 / F32 Small unadjusted margin; no new significance claim. |
| C13 | GB visit-home acceptance: men minus women | 50 − 26 = 24.0 percentage points | F24 / F24 Historical 2022 opinions; not safety or observed visits. |
| C14 | GB host-at-home acceptance: men minus women | 51 − 28 = 23.0 percentage points | F24 / F24 Same scenario and period; no individual or causal interpretation. |
| C15 | UK Overall: believed-appropriate minus reported first-date spend | 45 − 38 = 7.0 GBP | F43 / F43 Same January 2024 source and GBP units; valid bases not published, self-reported means rather than actual transaction gaps. |
| C16 | UK Men: believed-appropriate minus reported first-date spend | 48 − 43 = 5.0 GBP | F44 / F44 Same January 2024 source and GBP units; valid bases not published, self-reported means rather than actual transaction gaps. |
| C17 | UK Women: believed-appropriate minus reported first-date spend | 39 − 26 = 13.0 GBP | F45 / F45 Same January 2024 source and GBP units; valid bases not published, self-reported means rather than actual transaction gaps. |
| C18 | Relationship intentions: next morning minus immediate text | 6.15 − 5.8 = 0.35 scale points | F58 / F58 9-point fictional-scenario scale; independent descriptive subtraction, not a new hypothesis test. Immediate/morning chemistry and motivation contrasts were not significant in the source. |
| C19 | Perceived chemistry: next morning minus immediate text | 6.49 − 6.41 = 0.08 scale points | F59 / F59 9-point fictional-scenario scale; independent descriptive subtraction, not a new hypothesis test. Immediate/morning chemistry and motivation contrasts were not significant in the source. |
| C20 | Motivation to reconnect: next morning minus immediate text | 6.86 − 6.8 = 0.06 scale points | F60 / F60 9-point fictional-scenario scale; independent descriptive subtraction, not a new hypothesis test. Immediate/morning chemistry and motivation contrasts were not significant in the source. |
Common questions about first-date research
Who should pay on a first date according to surveys?
The answer depends on the question and sample. Nanos’s open-coded Canadian payment question had splitting/sharing as the leading answer at 45.1%; Finder’s Australian listed-choice item had splitting equally at 44%. Those different instruments do not establish a universal rule or country ranking. Original source.
What is the average first-date cost?
These sources do not provide one comparable global price. Nanos reports CAD66.20 as mean willingness among a small current-dater group, while Aqua reports a historical UK self-reported mean of GBP38. They differ in construct, currency, period and base. Original source.
Do disclosure comparisons show double standards?
No. Separate percentages for what people expect and what they would do cannot identify which individuals answer differently. The own-timing item also has a not-applicable option absent from the other-person item. Original source.
Does approving a first-date activity mean consent or safety?
No. Approval is a population opinion, not permission from a particular person or a measured safety outcome. The historical home-visit results are kept as attitudes rather than guidance. Original source.
Does the second-date percentage measure actual follow-up?
No. The selected Singles in America item asks how likely someone would be to try a second date after an imagined unexciting one. It does not track a cohort’s actual second dates. Original source.
Is next-morning texting scientifically guaranteed to work?
No. One selected April 2024 scenario experiment found a relationship-intentions difference, while immediate/next-morning chemistry and motivation contrasts were not significant. It did not observe real texts or resulting relationships. Original source.
Methodology and limitations
What this resource contributes
MyLittleDesire compiled 60 grouped findings, 187 numeric inputs, four original chart designs and 20 reproducible descriptive comparisons. The contribution is convenient original-question lookup and comparison, rather than new survey fieldwork. Related response categories share finding IDs; 60 findings are not 60 independent studies.
How sources were checked
We read original survey releases, methods, full tables and selected codebook items, plus a peer-reviewed experiment’s methods and results. Nine source records represent eight survey programs and one experiment. Match/Kinsey contributes 18 findings, YouGov’s GB survey 10 and other records between one and eight. Sampling contractors overlap across commissioned reports, so publisher count is not a count of independent replications.
Edition and actual dates
2027 is the editorial edition, prepared and reviewed November 1, 2026. Actual observations range from the historical 2022 GB survey through the 2026 Singles in America fieldwork. Aqua’s study is January 2024. The texting experiment collected data in April 2024, first appeared online September 10, 2025 and entered a February 2026 journal issue. None is described as 2027 fieldwork.
Which comparisons are justified
We compare compatible measures within the same source and retain their question wording, denominator, period and units. Own versus expected disclosure uses two different marginal questions; the own item includes a not-applicable option. These differences do not reveal individual double standards. Age and gender comparisons are unadjusted group descriptions, rather than personal predictions or causal effects.
Sampling and missing information
Nanos documents random telephone/online recruitment. Kinsey, YouGov and Bankrate describe online panels, with Bankrate explicitly identifying non-probability sampling. Other commercial releases provide varying detail; demographic representativeness is not treated as proof of a probability sample. Missing item n, CI and SE remain unavailable. The nine original experimental standard deviations are retained as SD, not transformed into invented confidence intervals.
Small and different bases
The Canadian payment table has n=897, gender bases 486/411 and separate age bases. Its spending distribution uses only n=73 current daters; numerical valid n for the mean/median is not printed. The full n=1,077 is not substituted. Aqua’s overall n=1,000 is not a valid item or subgroup base. Nationwide includes ages 16+ and unspecified walking-item routing. Finder’s selected sample is 1,006, not its larger cumulative tracker audience.
Conflict handling and verification routes
Harris’s 2026 modern-dating report says 778 singles in its methods but 785 on financial-flag pages, so those estimates were excluded from this verified core. Bankrate and the journal were read through accessible original web retrieval after local HTTP failed. The uncertainty and exclusions inventory records 47 holdouts; an unavailable direct read is not described as a successful local download.
Limits of the texting experiment
The final experiment used 543 heterosexual native-English-speaking Prolific participants from the US/UK, including partnered people, with randomized fictional timing and no actual message wording. Relationship intentions, chemistry and motivation are separate outcomes. The source’s immediate/next-morning contrasts were not significant for chemistry or motivation; a tiny mean difference is not evidence for a universal texting rule.
Scope, interpretation and updates
This is a targeted editorial synthesis rather than a systematic review or pooled national benchmark. It does not establish an ideal budget, relationship timetable or obligation to disclose private information. Public acceptance never supplies individual consent. Review new original questions and methods before updating text and chart inputs; retain useful historical dates and log substantive revisions.
Related MyLittleDesire research
Online Dating and Dating App Statistics covers platform use and online matches. Singles and Singlehood Statistics covers relationship status and single life. Ghosting Statistics explains contact-ending definitions and experiences. This resource focuses on first-date expectations, choices and follow-up.
Complete original-source bibliography
- S01 · Match / Kinsey Institute at Indiana University. Singles in America 2026: public codebook.
Published 2026-09-14 university release; Match release 2026-09-10. Data period: March–April 2026.
Population: Single adults 18+ under the study definition
Method: National online opt-in panels, recruited independently of Match users and balanced demographically; not a probability sample. Public codebook counts sum to 4,952; releases say approximately 5,000. Selected questions Q10, Q18, Q24, Q25, Q27, Q28, Q58 and Q109 read directly.
Limits: Commercial sponsorship. Codebook percentages use all respondents unless missing routing is printed; Q25 includes not applicable options unlike Q24. Own willingness and expectations of a date are separate marginal questions, not observed disclosures or individual contradictions. Full-study counts are not used for routed screening/sexual-behavior items.
Supporting document 1 · Supporting document 2 · Supporting document 3 - S02 · YouGov. What are the worst things to do on a first date?.
Published 2022-02-11. Data period: 2022-01-31 to 2022-02-01.
Population: GB adults; all adults and printed gender subgroups
Method: Weighted online panel. Original five-page tables inspected; overall n=1,686, unweighted men n=711 and women n=975. Article and table describe acceptable/unacceptable activities on or just after a first date.
Limits: Historical pandemic-era opinions, not 2027 prevalence or current dating behavior. Acceptance is not consent, safety, preference ranking or actual uptake. Nets retained as printed despite rounded components. No probability recruitment or new group significance inferred.
Supporting document 1 - S03 · Nanos Research / The Globe and Mail. Canadians’ dating: first-date payment expectations and willingness to spend.
Published Report says January 2026 release; landing page 2026-02-12. Data period: 2025-12-27 to 2025-12-29.
Population: Adults 18+; payment-question respondents n=897; spending question only current daters n=73
Method: Weighted RDD dual-frame hybrid telephone/online random survey. Original report and tabulations inspected. Payment question is open-ended/coded, with printed gender bases 486 men/411 women and age bases 167/341/389.
Limits: Reason for the payment base differing from full n=1,077 not fully explained. Spending distribution has n=73 and 16.4% unsure/not applicable; mean/median numerical valid n is not separately given. Published ±11.7-point subgroup margin applies to percentages, not a CAD confidence interval. Dollar figures are willingness, not recorded spending.
Supporting document 1 · Supporting document 2 - S04 · Bankrate / YouGov. Most Couples Keep At Least Some Of Their Money Separate: financial-topic timing.
Published 2026-02-09. Data period: 2025-12-02 to 2025-12-08.
Population: US adults, for when people should start financial discussions; not only the married/live-in subgroup
Method: Non-probability YouGov online panel with quotas and weights. Original public release table and methodology read via web retrieval; local direct HTML/PDF returned Site Unavailable. Overall n=2,564; n=1,208 applies to the separate married/live-in account questions.
Limits: Timing choices ask when discussion should start, not actual disclosure or a prohibition on talking sooner. Six topics use a common response grid. No new CI/significance test or inference that most oppose every money conversation.
Supporting document 1 - S05 · Aqua. The cost of a first date in 2024.
Published 2024-03-28; page says reviewed 2024-03-28. Data period: January 2024.
Population: UK consumers in several relationship statuses; subgroup labels as published
Method: Original commercial survey of 1,000 UK consumers. Article, question summaries, publication label and methods read. It presents believed-appropriate cost and reported spending as separate means.
Limits: Recruitment, weighting, exact eligible age range, item-valid n and subgroup n not supplied. Includes partnered and previously partnered respondents. Reported spend is self-report, not transactions; generation cutoffs not published. Historic amounts are not 2027 prices or causal inflation effects.
Supporting document 1 - S06 · NerdWallet / The Harris Poll. Survey: 17% of Americans Say Credit Card Debt is a Dating Dealbreaker.
Published 2026-02-03. Data period: 2025-12-02 to 2025-12-04.
Population: US adults 18+; financial flag questions refer to romantic dating, not exclusively first dates
Method: Commissioned online Harris survey. Original article/methods read. Red/yellow/green options classify the same dating behavior; no subgroup n needed for selected full-adult rows.
Limits: Broader early-dating context, not first-date-only statistics. Non-probability online survey; published Bayesian credible interval is not treated as a probability-sampling margin or assigned to individual items. No inference that a financial flag guarantees rejection.
Supporting document 1 - S07 · Nationwide / Censuswide. Step into love: walking dates and first-date expectations.
Published 2025-09-30. Data period: 2025-09-09 to 2025-09-11.
Population: General respondents 16+; some walking-date findings have unspecified routing
Method: Original Censuswide online survey commissioned by Nationwide. Release and methods inspected. Publisher describes a nationally representative demographic sample; complete probability recruitment and weights not supplied.
Limits: Walking-date opinions extend beyond first dates. Exact item/subgroup routing and valid n not printed. Adults and ages 16–17 are not separated, so do not relabel all results adults 18+. No national headcounts or claim walks cause romantic success.
Supporting document 1 - S08 · Finder / Qualtrics. From romance to receipts: Aussies rethink first date expectations.
Published 2026-02-10 Australian display date; updated 2026-02-11. Data period: December 2025.
Population: Australian Consumer Sentiment Tracker respondents; age eligibility not stated in the release
Method: Finder-owned Consumer Sentiment Tracker operated by Qualtrics. Original payment table and methodology inspected; selected release n=1,006, not the much larger cumulative tracker marketing figure.
Limits: Publisher’s nationally representative description does not establish a probability sample. Recruitment, item-valid base and exact age eligibility not provided. Forced response list differs from Nanos open coding, so no national league table is calculated. Unclear-base preparation-spending figures excluded.
Supporting document 1 - S09 · Teichmann, Petrowsky, Boecker, Soliman and Loschelder / Journal of Social and Personal Relationships. How the timing of texting triggers romantic interest after the first date: A curvilinear U-shaped effect and its underlying mechanisms.
Published First online 2025-09-10; journal issue February 2026, volume 43(2), pp.570–593. Data period: Main experiment April 2024.
Population: Heterosexual native-English-speaking adults 18–79 recruited on Prolific; includes single and partnered people
Method: Preregistered randomized 3 timing × 2 gender between-participant vignette experiment, preceded by a separate n=100 pre-study. Main final sample 543 (270 women/273 men). Fictional Italian-restaurant date; no message content specified. Outcomes were multi-item 9-point scales. Original methods/results read through public web retrieval; direct HTTP returned 403.
Limits: Not nationally representative or an actual date/texting field experiment. 65.7% were in a relationship. Arm-specific valid n not established from selected passages; published SD retained, no SE/CI invented. Chemistry and motivation did not differ significantly between immediate and next-morning conditions. Results do not establish a universal texting timetable.
Supporting document 1 · Supporting document 2 · Supporting document 3
How to cite this resource
MyLittleDesire. First-Date Expectations Statistics 2027 . https://mylittledesire.com/First-Date-Expectations-Statistics/.