Greenvelope’s platform report gives weddings an 88.9% median RSVP response rate. Its separate 80.9% yes-share pools the replies received within the wedding category. Those two figures use different denominators and weighting. Neither measures who actually arrived. Greenvelope [S01].
This resource presents 50 published numerical observations in 15 grouped findings: 31 percentages and 19 invitation/stationery cost figures. Ten numerical source records come from six named publishers. They cover replies, related wedding events, invitation formats, websites, QR use, guest experiences, attitudes and costs. Categories and annual reports are observations within research programs, rather than 50 independent studies.
88.9%
80.9%
Median wedding response rate: yes and no replies divided by invitees, per event.Greenvelope events July 2025–June 2026; exact wedding n withheld. Greenvelope [S01]
Pooled yes-share among replies in the wedding category.Different aggregation from the event median; no arrival data. Greenvelope [S01]
66%
US$220
Chose physical invitations in the Australian report’s format question.Easy Weddings 2026 report; exact item n and window unavailable. Easy Weddings [S06]
Mean invitation spending including RSVP cards.The Knot’s 2025 US wedding research; exact category n unavailable. The Knot / The Knot Worldwide [S03]
What do invitation and RSVP statistics measure?
| Measure | Calculation / meaning | Important distinction |
|---|---|---|
| Invited people | Eligible individuals on the guest list. | One household may receive one invitation but contain several people. |
| Response rate | (Yes + no replies) ÷ invited people. | Unanswered people remain in the denominator. |
| Yes-share among replies | Yes replies ÷ all yes/no replies. | Excludes people who have not replied. |
| Affirmative share of invitees | Yes replies ÷ invited people. | Requires matched counts from the same event/population. |
| Actual attendance | People recorded as arriving, with a stated denominator. | An RSVP acceptance is an intention; check-in or another attendance measure is needed. |
| Couple-level no-show incidence | Couples who experienced any accepted guest failing to attend. | Does not tell you how many guests were missing. |
| Invitation format or website plan | A medium or planning choice. | Does not establish reply completion, scan rates or attendance. |
A median event rate gives the middle event equal standing with others. A pooled reply share weights events by their replies. Multiplying those two differently weighted summaries does not recover an observed aggregate yes-to-invited rate. Use matched counts within the same event when calculating your own results.
Also Read:-
Wedding Guest Count Statistics 2027
Premarital Counseling Statistics 2027
Relationship Arguments And Conflict Statistics 2027
First Date Safety Statistics 2027
How Couples Meet Statistics 2027
What percentage of invited guests reply?
Greenvelope analyzed 70,624 events across 23 event types, with 10–1,000 invited recipients per included event. They occurred July 1, 2025–June 15, 2026 and were extracted July 15, 2026. The report publishes a wedding median response rate of 88.9% and a pooled yes-share of 80.9% among wedding replies. Exact wedding/category counts are withheld, so the full platform count is not the wedding sample size. Greenvelope [S01].
F01 Median response rate uses each event’s yes-plus-no replies over invitees; yes-share pools yes replies over all replies in the wedding category. Exact wedding/event/reply n withheld. The first is a median of event rates and the second a pooled reply share. Do not multiply them into an observed all-invitee acceptance rate or call either actual attendance.
| Measure / group | Published result | Actual cohort or report period | Source |
|---|---|---|---|
| Wedding: median event response rate | 88.9% | Events July 1, 2025–June 15, 2026; extracted July 15, 2026 | Original source [S01] Benchmark Table: Wedding row; definitions and methodology |
| Wedding: pooled yes-share among replies | 80.9% | Events July 1, 2025–June 15, 2026; extracted July 15, 2026 | Original source [S01] Benchmark Table: Wedding row; definitions and methodology |
Use the methods, not a blended rate. Some source prose describes a hypothetical number of acceptances using the two headline summaries. Its methods define one as an event median and the other as pooled replies. We retain the two measured statistics separately and do not count their product as an observed acceptance or attendance statistic.
How do related wedding events compare?
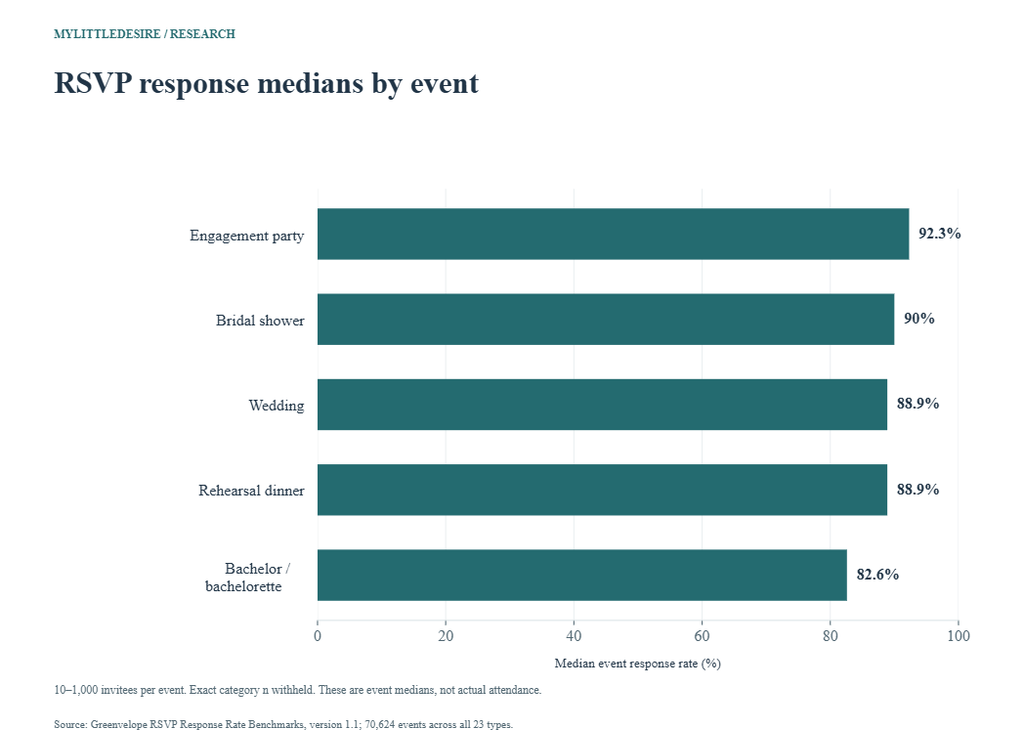
The same platform publishes results for engagement parties, bridal showers, rehearsal dinners and bachelor/bachelorette events. These related gatherings have their own guest lists and eligibility; they are not additional measurements of wedding-ceremony response. The provider does not establish that reminders, deadlines or a particular invitation tactic caused the differences. Greenvelope [S01].
F02 Median event-level (yes+no)/invited rates for four related-event categories. Related gatherings, not wedding-ceremony response rates. Exact category n withheld; selected platform events with 10–1,000 invitees. Differences are descriptive, without causal reminder/deadline effects.
| Measure / group | Published result | Actual cohort or report period | Source |
|---|---|---|---|
| Engagement party | 92.3% | Events July 1, 2025–June 15, 2026; extracted July 15, 2026 | Original source [S01] Benchmark Table, selected related-event rows |
| Bridal shower | 90% | Events July 1, 2025–June 15, 2026; extracted July 15, 2026 | Original source [S01] Benchmark Table, selected related-event rows |
| Rehearsal dinner | 88.9% | Events July 1, 2025–June 15, 2026; extracted July 15, 2026 | Original source [S01] Benchmark Table, selected related-event rows |
| Bachelor / bachelorette | 82.6% | Events July 1, 2025–June 15, 2026; extracted July 15, 2026 | Original source [S01] Benchmark Table, selected related-event rows |
F03 Pooled yes replies divided by all replies within each related-event category. Exact category reply denominators withheld. These are not medians or yes shares of all invited people, and they do not measure arrival/check-in.
| Measure / group | Published result | Actual cohort or report period | Source |
|---|---|---|---|
| Engagement party | 79.8% | Events July 1, 2025–June 15, 2026; extracted July 15, 2026 | Original source [S01] Benchmark Table, selected Yes-share column |
| Bridal shower | 75.3% | Events July 1, 2025–June 15, 2026; extracted July 15, 2026 | Original source [S01] Benchmark Table, selected Yes-share column |
| Rehearsal dinner | 80.7% | Events July 1, 2025–June 15, 2026; extracted July 15, 2026 | Original source [S01] Benchmark Table, selected Yes-share column |
| Bachelor / bachelorette | 78.3% | Events July 1, 2025–June 15, 2026; extracted July 15, 2026 | Original source [S01] Benchmark Table, selected Yes-share column |
What does the historical 83% RSVP figure mean?
RSVPify’s January 2019 article reports an average of 83% affirmative replies and 17% nonaffirmative outcomes. Its method explicitly counts unanswered invitations as no. The latter figure therefore cannot be described as explicit declines alone, even though the results paragraph uses decline wording. Exact historical event counts, dates and weighting are unavailable. RSVPify [S02].
F04 Published average RSVP split, with unanswered invitations coded as no in the original method. Exact year window, sample counts and weighting unavailable. The 17% includes nonresponse and is not a clean explicit-decline or no-show rate. Not a trend comparison with Greenvelope.
| Measure / group | Published result | Actual cohort or report period | Source |
|---|---|---|---|
| Affirmative replies against guest list | 83% | Historical platform analysis described as the prior year; exact event/extraction dates unavailable | Original source [S02] Methodology narrative and The Results |
| No or unanswered under source coding | 17% | Historical platform analysis described as the prior year; exact event/extraction dates unavailable | Original source [S02] Methodology narrative and The Results |
This older figure is not compared with Greenvelope’s 80.9% as a time trend. One concerns a guest-list split that codes nonresponse as no; the other pools yes replies among people who answered. Neither is an observed arrival rate.
How common are reported no-shows and uninvited guests?
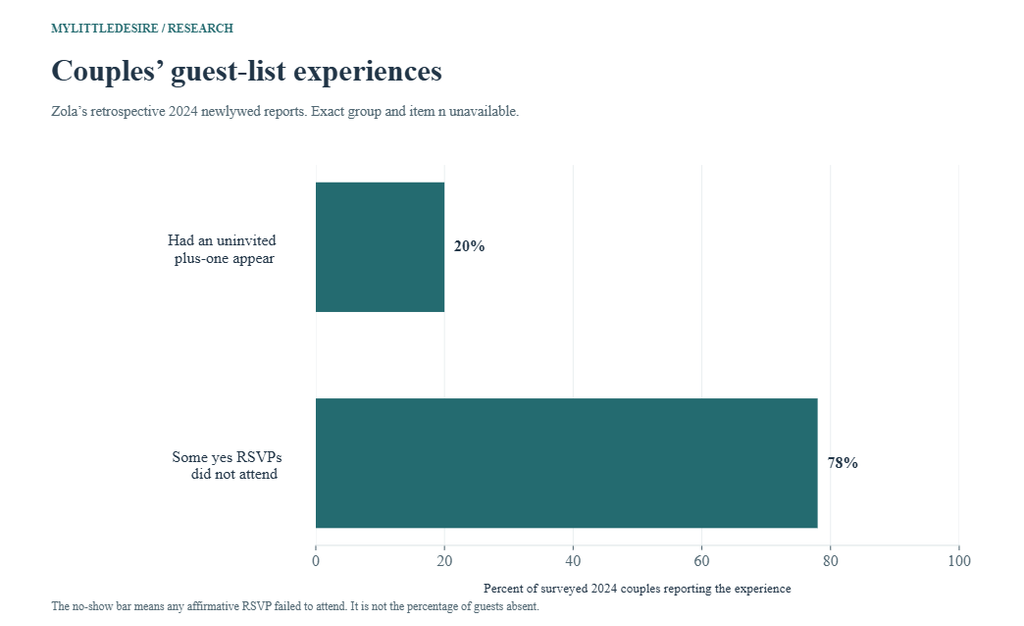
Zola’s report separately describes 2024 newlyweds: 20% said an uninvited plus-one appeared, and 78% said some yes RSVPs did not attend. The denominator is couples reporting an experience. The checked passage does not supply a guest-level no-show fraction or the exact retrospective group size. Its main 2025 planning sample must not be used as that base. Zola [S09].
F14 Incidence among 2024 newlywed respondents of any uninvited plus-one or affirmative-RSVP no-show. Couple/event incidence, not proportions of invited/accepted guests. Exact 2024 group n unavailable; do not assign the main 2025 planning sample to these results.
| Measure / group | Published result | Actual cohort or report period | Source |
|---|---|---|---|
| Had an uninvited plus-one appear | 20% | Selected retrospective reports from couples married in 2024; exact interview dates unavailable | Original source [S09] Intimate Weddings, Big Guests Lists, Uninvited +1s and No-shows bullets |
| Some yes RSVPs did not attend | 78% | Selected retrospective reports from couples married in 2024; exact interview dates unavailable | Original source [S09] Intimate Weddings, Big Guests Lists, Uninvited +1s and No-shows bullets |
Are couples choosing physical or digital invitations?
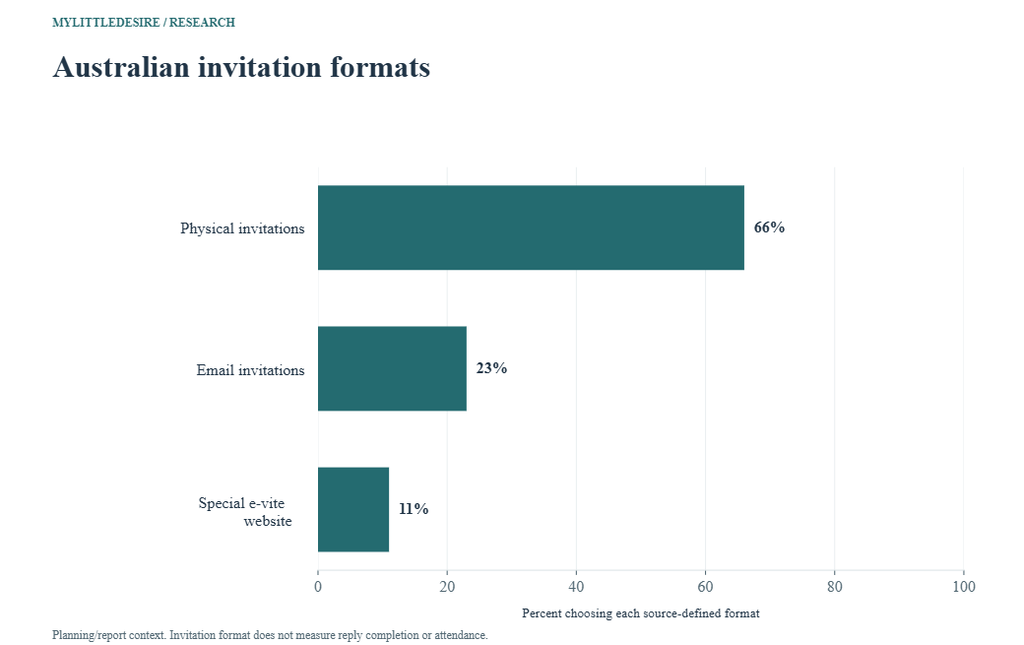
Easy Weddings’ 2026 Australian report gives a format distribution of 66% physical, 23% email and 11% special e-vite website. Its separate website question asks whether couples plan to set one up. A website can provide directions or information without collecting replies, and a paper invitation can direct guests to an online RSVP. Easy Weddings [S06].
F08 The report’s physical/email/special-e-vite distribution. Planning/report context; exact answering n unknown. Digital distribution is not an RSVP response-rate measure. This question differs from 2025 invitation sourcing.
| Measure / group | Published result | Actual cohort or report period | Source |
|---|---|---|---|
| Physical invitations | 66% | 2026 report edition; mixed engaged/recently married research, exact item wedding/fieldwork periods unavailable | Original source [S06] PDF physical/printed p.33, What type of invitations are you having? |
| Email invitations | 23% | 2026 report edition; mixed engaged/recently married research, exact item wedding/fieldwork periods unavailable | Original source [S06] PDF physical/printed p.33, What type of invitations are you having? |
| Special e-vite website | 11% | 2026 report edition; mixed engaged/recently married research, exact item wedding/fieldwork periods unavailable | Original source [S06] PDF physical/printed p.33, What type of invitations are you having? |
F09 Responses to setting up a wedding website. Exact item n unavailable. A website can host information without collecting RSVPs; do not equate yes with online reply adoption.
| Measure / group | Published result | Actual cohort or report period | Source |
|---|---|---|---|
| Yes | 59% | 2026 report edition; mixed engaged/recently married research, exact item wedding/fieldwork periods unavailable | Original source [S06] PDF physical/printed p.33, Are you setting up a wedding website? |
| No | 27% | 2026 report edition; mixed engaged/recently married research, exact item wedding/fieldwork periods unavailable | Original source [S06] PDF physical/printed p.33, Are you setting up a wedding website? |
| Not sure yet | 14% | 2026 report edition; mixed engaged/recently married research, exact item wedding/fieldwork periods unavailable | Original source [S06] PDF physical/printed p.33, Are you setting up a wedding website? |
The 2025 report asks a different question: where couples will get their invitations. Its chart separates professional designer, DIY, friends/family and digital. The narrative’s combined 64% DIY/family subtotal is not counted again. These sourcing options do not create a direct year-over-year format series with the 2026 question. Easy Weddings [S07].
F11 Four-category sourcing chart; professional designer, DIY, friends/family and digital. Exact answering n unknown. Narrative combines DIY and friends/family to 64%; that subtotal is not counted again. Source question is not harmonized with 2026 format options.
| Measure / group | Published result | Actual cohort or report period | Source |
|---|---|---|---|
| Professional designer | 18% | 2025 report edition; planning/spending research for 2025 and beyond, exact item periods unavailable | Original source [S07] PDF physical/printed p.33, Where will you get your invitations? |
| DIY | 61% | 2025 report edition; planning/spending research for 2025 and beyond, exact item periods unavailable | Original source [S07] PDF physical/printed p.33, Where will you get your invitations? |
| Friend / family member | 3% | 2025 report edition; planning/spending research for 2025 and beyond, exact item periods unavailable | Original source [S07] PDF physical/printed p.33, Where will you get your invitations? |
| Digital invitations | 18% | 2025 report edition; planning/spending research for 2025 and beyond, exact item periods unavailable | Original source [S07] PDF physical/printed p.33, Where will you get your invitations? |
How often do invitations include QR codes?
The Knot reports 38% QR-code use on invitations/save-the-dates in its 2023 research and 49% in its 2024 research. The purpose combines capturing RSVPs and/or viewing wedding websites. QR presence does not establish that guests scanned it or completed a response. The Knot / The Knot Worldwide [S04]; The Knot / The Knot Worldwide [S05].
F05 Use of QR codes for RSVP capture and/or wedding-website access. Presence/use by couples, not share of guests who scanned or replied. Exact item n unknown. Conflicting 2022 comparisons excluded.
| Measure / group | Published result | Actual cohort or report period | Source |
|---|---|---|---|
| 2023 US wedding research | 38% | 2023 US wedding cohort; exact QR-item interview dates not stated | Original source [S04] 2023 Weddings at a Glance, Trends that are in |
F06 Publisher’s 2024 research figure for QR codes on save-the-dates or invitations. Main study n is not exact QR-item n. Website access and RSVP use are combined. Page update is not the wedding year.
| Measure / group | Published result | Actual cohort or report period | Source |
|---|---|---|---|
| 2024 US wedding research | 49% | 2024 US wedding research; report also uses 2024–2025 platform/ad hoc inputs | Original source [S05] Technology / QR-code adoption paragraph; Survey Methodology |
The 2024 press release gives 18% for 2022, while a later original QR guide gives 20% for that year. The 2022 value is withheld until the underlying definitions or revision can be reconciled. No 2022 growth claim is calculated. Original QR guide [R02].
What do people think about declining or changing an invitation?
Zola’s expanded 2025 planning survey asks whether particular dilemmas should be more or less acceptable. The selected answers concern declining a wedding or pre-wedding event, asking for a plus-one and asking to bring children who were not invited. Keep that opinion wording attached; it does not measure what guests actually did. Zola [S08].
F13 Whether specified etiquette dilemmas should be more or less acceptable, preserving the source’s direction. Opinion among selected 2025 planners, not actual decline behavior. More acceptable does not mean never okay, nor does less acceptable mean universally prohibited.
| Measure / group | Published result | Actual cohort or report period | Source |
|---|---|---|---|
| Decline a wedding invite: more acceptable | 91% | Couples planning 2025 weddings; exact interview dates unavailable | Original source [S08] How do you feel about modern wedding etiquette dilemmas? |
| Decline a pre-wedding event: more acceptable | 90% | Couples planning 2025 weddings; exact interview dates unavailable | Original source [S08] How do you feel about modern wedding etiquette dilemmas? |
| Ask for an uninvited plus-one: less acceptable | 82% | Couples planning 2025 weddings; exact interview dates unavailable | Original source [S08] How do you feel about modern wedding etiquette dilemmas? |
| Ask to bring uninvited children: less acceptable | 76% | Couples planning 2025 weddings; exact interview dates unavailable | Original source [S08] How do you feel about modern wedding etiquette dilemmas? |
For a different perspective, the UK Money and Pensions Service reports that 40% of respondents aged 25–34 had declined at least one wedding-related event due to cost. That is an age-specific respondent experience over the preceding year, including related celebrations. It is not the percentage of all wedding invitations declined. Exact age-group n and question eligibility are unavailable on the checked release. Money and Pensions Service (MaPS) [S10].
F15 Reported declining at least one wedding-related event due to cost. Past-12-month recall, age-specific and exact question/base unavailable. Includes related celebrations; not 40% of wedding invitations or an event-level decline rate.
| Measure / group | Published result | Actual cohort or report period | Source |
|---|---|---|---|
| Ages 25–34: declined at least one related event due to cost | 40% | 2026 online research asking about events in the preceding 12 months; exact fieldwork dates not stated | Original source [S10] Main findings, 25–34-year-old paragraph |
How much do wedding invitations cost?
The Knot’s 2025 US wedding research reports mean spending of US$220 on invitations including RSVP cards, US$150 on save-the-dates, US$150 on day-of paper and US$510 on the full stationery suite/paper details. These are separate published summaries, with exact category bases unavailable. The Knot / The Knot Worldwide [S03].
F07 Four published category summaries in nominal US dollars. Exact category bases unavailable. Component means add to US$520, whereas published full-suite mean is US$510; checked article does not reconcile them. Do not add or subtract them as a matched receipt. Day-of paper is related suite context.
| Measure / group | Published result | Actual cohort or report period | Source |
|---|---|---|---|
| Invitations including RSVP cards | US$220 | US couples married January 1–December 31, 2025 | Original source [S03] What’s the average cost of wedding stationery? |
| Save-the-dates | US$150 | US couples married January 1–December 31, 2025 | Original source [S03] What’s the average cost of wedding stationery? |
| Day-of paper, such as menus/signs | US$150 | US couples married January 1–December 31, 2025 | Original source [S03] What’s the average cost of wedding stationery? |
| Full stationery suite and paper details | US$510 | US couples married January 1–December 31, 2025 | Original source [S03] What’s the average cost of wedding stationery? |

The three component means add to US$520, while the article gives US$510 for its full-suite mean. The checked source does not reconcile that difference. We preserve the published categories without repairing the total or treating them as one additive bill. Bespoke designer ranges, product prices and the ambiguously scoped guest-count table are excluded from the numerical database.
For broader spending context, see our wedding cost and budget statistics. When requesting a stationery quote, distinguish people from household invitation sets and specify design, printing, inserts, envelopes, addressing, delivery and any RSVP service. Those are practical comparison questions, rather than additional survey findings.
What do Australian invitation cost reports show?
Easy Weddings reports A$1,001 nationally in its 2026 edition and A$945 in its 2025 edition, alongside the available regional means below. Exact paying-user bases, inclusions and fieldwork periods are not specified. Keep the report edition and Australian dollars attached. The A$56 difference is not a controlled invitation-price index. Easy Weddings [S06]; Easy Weddings [S07].
F10 National and state/territory means on the invitation page’s map. Australian dollars; exact item periods, spending inclusions and state bases unknown. NT insufficient data, not zero. National mean is not a simple average of displayed state means.
| Measure / group | Published result | Actual cohort or report period | Source |
|---|---|---|---|
| Australia | A$1,001 | 2026 report edition; mixed engaged/recently married research, exact item wedding/fieldwork periods unavailable | Original source [S06] PDF physical/printed p.33, invitation-cost map |
| New South Wales | A$1,244 | 2026 report edition; mixed engaged/recently married research, exact item wedding/fieldwork periods unavailable | Original source [S06] PDF physical/printed p.33, invitation-cost map |
| Victoria | A$1,087 | 2026 report edition; mixed engaged/recently married research, exact item wedding/fieldwork periods unavailable | Original source [S06] PDF physical/printed p.33, invitation-cost map |
| Queensland | A$844 | 2026 report edition; mixed engaged/recently married research, exact item wedding/fieldwork periods unavailable | Original source [S06] PDF physical/printed p.33, invitation-cost map |
| South Australia | A$1,150 | 2026 report edition; mixed engaged/recently married research, exact item wedding/fieldwork periods unavailable | Original source [S06] PDF physical/printed p.33, invitation-cost map |
| Western Australia | A$1,664 | 2026 report edition; mixed engaged/recently married research, exact item wedding/fieldwork periods unavailable | Original source [S06] PDF physical/printed p.33, invitation-cost map |
| Australian Capital Territory | A$674 | 2026 report edition; mixed engaged/recently married research, exact item wedding/fieldwork periods unavailable | Original source [S06] PDF physical/printed p.33, invitation-cost map |
| Tasmania | A$1,500 | 2026 report edition; mixed engaged/recently married research, exact item wedding/fieldwork periods unavailable | Original source [S06] PDF physical/printed p.33, invitation-cost map |
F12 Previous report’s national and available state means. Nominal Australian dollars; exact item periods, spend scope and regional bases unknown. ACT/NT insufficient data. Cross-report differences are descriptive, not invitation-price inflation.
| Measure / group | Published result | Actual cohort or report period | Source |
|---|---|---|---|
| Australia | A$945 | 2025 report edition; planning/spending research for 2025 and beyond, exact item periods unavailable | Original source [S07] PDF physical/printed p.33, invitation-cost map |
| New South Wales | A$899 | 2025 report edition; planning/spending research for 2025 and beyond, exact item periods unavailable | Original source [S07] PDF physical/printed p.33, invitation-cost map |
| Victoria | A$1,058 | 2025 report edition; planning/spending research for 2025 and beyond, exact item periods unavailable | Original source [S07] PDF physical/printed p.33, invitation-cost map |
| Queensland | A$782 | 2025 report edition; planning/spending research for 2025 and beyond, exact item periods unavailable | Original source [S07] PDF physical/printed p.33, invitation-cost map |
| South Australia | A$330 | 2025 report edition; planning/spending research for 2025 and beyond, exact item periods unavailable | Original source [S07] PDF physical/printed p.33, invitation-cost map |
| Western Australia | A$1,150 | 2025 report edition; planning/spending research for 2025 and beyond, exact item periods unavailable | Original source [S07] PDF physical/printed p.33, invitation-cost map |
| Tasmania | A$1,300 | 2025 report edition; planning/spending research for 2025 and beyond, exact item periods unavailable | Original source [S07] PDF physical/printed p.33, invitation-cost map |
Northern Territory is unavailable in the 2026 invitation-cost map; ACT and Northern Territory are unavailable in the 2025 map. These are insufficient-data entries, not zero-cost weddings. The national means are not reconstructed by averaging displayed state figures.
How can couples use these statistics?
Keep a named-person list with separate fields for invited, yes, no, pending and attended. Record each person’s event eligibility, rather than assuming that a reply for one gathering applies to every wedding-weekend event. Keep household/invitation records distinct from headcounts.
Set the reply date with the venue or caterer’s actual headcount deadline in mind. Give guests a clear way to respond, confirm plus-one/child eligibility and provide an alternative for anyone who cannot use the online form. Follow up on pending replies and record changes after an initial yes. These are practical planning steps; the selected research does not establish a guaranteed reminder lift or a universal response deadline.
The current RSVPify calculator article does not publish a dated, auditable fixed response-time table in the checked page. No calculator scenario or generic send-by interval is presented as an observed percentile here. Original calculator article [R01].
Ten reproducible comparisons
The workbook reproduces these ten descriptive differences from stable observation IDs. Each comparison uses the same measure type and currency/unit. Event medians are not mixed with pooled yes-shares, and the calculations do not add observations to the 50-count.
| Comparison | First | Second | Difference | Qualification |
|---|---|---|---|---|
| Greenvelope response: engagement minus wedding | 92.3% | 88.9% | +3.4 percentage points | Same event-median statistic; exact category n withheld. Not a tactic effect. |
| Greenvelope yes-share: wedding minus bridal shower | 80.9% | 75.3% | +5.6 percentage points | Same pooled reply-share statistic; not all-invitee acceptance. |
| QR adoption: 2024 minus 2023 | 49% | 38% | +11 percentage points | Different annual research cohorts; exact QR-item n unknown. No 2022 point used. |
| Australia 2026: physical minus email invitations | 66% | 23% | +43 percentage points | Same format question; unknown item n. Not an RSVP response comparison. |
| Australia 2026: email minus special e-vite website | 23% | 11% | +12 percentage points | Same format distribution; source-defined categories. |
| Australia 2025: DIY minus professional designer | 61% | 18% | +43 percentage points | Same sourcing question; do not compare directly with 2026 format categories. |
| Australia national cost: 2026 report minus 2025 report | A$1,001 | A$945 | +56 AUD | Difference between published report means, not a price index or matched quote. |
| Australia 2026 cost: WA minus ACT | A$1,664 | A$674 | +990 AUD | Same report map; exact spend scope and subgroup n unknown. |
| US spend: invitations minus save-the-dates | US$220 | US$150 | +70 USD | Separate category means with unknown bases; not an incremental fee. |
| Zola: wedding-decline minus pre-event-decline attitude | 91% | 90% | +1 percentage points | Same more-acceptable direction; opinions, not observed behavior. |
Common questions
Is an 80.9% yes-share the share of all invitees who accepted?
No. Greenvelope pools yes replies among all replies received in the wedding category. Unanswered invitees are outside that denominator.
Can I multiply 88.9% by 80.9% to get the measured acceptance rate?
The first is a median of event rates; the second pools replies. Their product does not recover an observed aggregate yes-to-invited rate. Use matched counts for an actual event.
Does 78% mean most accepted guests fail to attend?
No. Zola says 78% of surveyed 2024 couples experienced some yes RSVPs not attending. It is an incidence among couples, not a share of accepted guests.
Does a digital invitation guarantee faster replies?
The selected sources do not establish a causal effect of format, reminders or deadlines. Platform response benchmarks reflect selected audiences and event types.
What is the correct 2022 QR-code adoption figure?
The checked original publisher pages give conflicting 18% and 20% values. That point is withheld rather than silently selecting one.
How many invitation sets should I order?
A guest count and a household mailing count can differ. Build the actual household/name list and confirm the quote’s counting rules; no universal conversion is inferred here.
Why is there no Canadian national rate?
No independently verified original Canadian national invitation/RSVP benchmark was selected. Global platform records are not substituted for a Canadian population estimate.
Research method and limitations
MyLittleDesire compiled selected original provider reports, survey releases and tables. AI assisted retrieval, organization and drafting. No new survey, respondent-level reanalysis, independent audit of private platform logs, exhaustive systematic review, pooled meta-analysis, exchange conversion or causal reminder experiment was conducted. Original selected PDF pages were visually checked.
The database includes 31 percentage observations and 19 cost observations: four in US dollars and 15 in Australian dollars. Eight of Greenvelope’s ten selected values describe related pre-wedding events; two describe weddings. Ten source records represent six named publishers, with repeated annual studies and related Zola narrative/deep-dive records. Easy Weddings contributes 25 of the 50observations across two editions; this concentration is disclosed rather than treated as balanced international evidence.
- Aggregation: event medians, pooled reply shares, guest-list splits, respondent incidence, intentions and attitudes remain distinct.
- Eligibility: exact unknown item/subgroup bases stay unavailable. Full samples and lower-bound counts are not substituted for wedding-specific or retrospective bases.
- Timing: actual event windows, historical cohorts and report-only periods remain attached. A page update does not establish new fieldwork.
- Selection: commercial member/platform audiences differ from national samples. MaPS’ selected statistic is age-specific, with an unpublished base on its release.
- Verification: private platform event logs were not released or independently audited. A report’s aggregate-table link returned the report page during retrieval; no underlying CSV download is claimed.
- Withheld claims: conflicting 2022 QR use, unclear conditional no-show reasons, ambiguous guest-count cost scope and scenario-derived acceptance/timing figures are excluded.
Original sources and supporting records
- S01. Greenvelope. RSVP Response Rate Statistics 2026: Benchmarks From 70,624 Events. Events July 1, 2025–June 15, 2026; extracted July 15, 2026. 70,624 total events, 5,543,430 invitations and 4,276,873 responses across all categories. Exact wedding/category event counts and reply denominators withheld; each category at least 100 events. Overall counts are not the wedding base. Method: First-party platform logs. Response rate=(yes+no)/invited for each event, summarized by median. Yes-share=total yes/total replies pooled within category. Host-selected types plus keyword classification for generic labels. About 50 malformed records removed; unclassified generic events excluded. Single commercial digital platform with selected hosts and reminder features, not national probability research. No attendance/check-in or causal reminder effect measured. Median event response and pooled yes-share have different weighting; their product is not an observed aggregate acceptance rate. Event-level data unavailable; category bases confidential.
- S02. RSVPify. What percent of guests should you expect to attend your wedding? The data is in.. Actual period: Historical platform analysis described as the prior year; exact event/extraction dates unavailable. Source describes thousands of guest lists/events. Exact event count, invited guest count and analysis weighting unavailable. Method: Original provider analysis of positive RSVPs against the guest list. The methodology explicitly counts unanswered invitations as no; selected published result is an average affirmative/nonaffirmative split. Old platform data with limited methods, not observed arrivals or current national acceptance. The article calls 17% declines, but the stated coding includes no reply. Keep that wider definition. Not comparable as a trend with Greenvelope’s pooled yes-share among respondents.
- S03. The Knot / The Knot Worldwide. How Much Do Wedding Invitations Cost? This Is the Average. Main survey n=10,474 couples. Exact stationery-category answering n and category overlap not supplied. Method: Original publisher article citing its 2026 Real Weddings Study. Main study recruited adult The Knot/WeddingWire members by email during 2025 and also uses ad hoc research. Selected invitation, save-the-date, day-of and suite means checked directly. Commercial member sample. Component means sum to US$520 while published full-suite mean is US$510; checked article does not reconcile bases or rounding. Preserve separate published summaries, not an additive bill. Guest-count table item scope ambiguous and expert quote ranges excluded. Supporting records: record 1.
- S04. The Knot / The Knot Worldwide. Wedding Guests Take Center Stage: The Knot 2023 Real Weddings Study. Exact QR-item interview dates not stated. Main survey n=9,318 US couples; exact QR-item n unavailable. Report also includes ad hoc studies. Method: Original publisher release. Main 2023 survey recruited The Knot/WeddingWire members by email. Selected QR-code use figure is for capturing RSVPs and/or directing guests to a website. Presence of a QR code is not a completed online RSVP or scan rate. The release’s 2022 comparison conflicts with a later publisher guide, so the 2022 point is withheld. Annual publisher records are not independent replications.
- S05. The Knot / The Knot Worldwide. The Knot Real Weddings Study: Data Read-Out (2024). Actual period: 2024 US wedding research; report also uses 2024–2025 platform/ad hoc inputs. Main 2024 survey n=16,956. Exact QR-item answering n/window unavailable; platform invitation analysis also covers Q2 2024–Q1 2025. Method: Original publisher retrospective report page, with main email-recruited newlywed survey and additional platform/ad hoc inputs. QR adoption paragraph checked, with same 49% also in original QR guide. Do not label as 2026 fieldwork because the page was updated in 2026. QR use can point to information or RSVP and does not measure response completion. Historical 2022 claims conflict between original pages; no 2022 point adopted. Supporting records: record 1.
- S06. Easy Weddings. 2026 Australian Wedding Industry Report. Xixed engaged/recently married research, exact item wedding/fieldwork periods unavailable. More than 4,200 couples and 540 businesses overall, plus marketplace/community inputs. Exact invitation/website/cost-item and regional answering n unavailable. Method: Original annual report combines couple surveys, business research and platform/community inputs. Physical/printed p.33 visually checked for invitation formats, website plans and national/regional costs. Commercial selected audience; report edition is not a calendar-year completed-wedding census. Website intention does not establish online RSVP use. Cost inclusions and exact paying-user base unspecified. NT invitation cost marked insufficient data, not zero. Supporting records: record 1.
- S07. Easy Weddings. 2025 Australian Wedding Industry Report. Exact PDF release day unavailable. Actual period: 2025 report edition; planning/spending research for 2025 and beyond, exact item periods unavailable. More than 4,000 couples and 800 businesses overall, plus spending/community inputs. Exact invitation-source, cost and state bases unavailable. Method: Original PDF foreword p.2 and invitation page 33 checked. Four-category invitation-source chart used consistently; narrative combines DIY and friend/family. Costs copied from original map. Question differs from 2026 physical/email/e-vite format question; not a harmonized format trend. No extra observation for combined 64% DIY/family subtotal. ACT/NT cost unavailable, not zero. Regional sample sizes unknown.
- S08. Zola. 2025 Wedding Trends: Zola’s First Look Report Data Deep Dive. Exact interview dates unavailable. Page says more than 6,000 couples getting married in 2025. Exact attitude-item answering n unavailable. Method: Original provider’s expanded question/results page. Selected four responses to whether etiquette dilemmas should be more or less acceptable. Directional wording retained. Attitudes are not observed decline/plus-one behavior. More acceptable and less acceptable are different response directions, not a common universal rule. Related to S09’s First Look program, but S09’s retrospective 2024 group has an undisclosed base.
- S09. Zola. 2025 Wedding Trends: Zola’s First Look Report. Actual period: Selected retrospective reports from couples married in 2024; exact interview dates unavailable. Intro describes close to 6,000 couples planning 2025; that is not the denominator for selected 2024 newlywed experiences. Exact 2024/item n unavailable. Method: Original First Look narrative separately identifies 2024 couples who experienced uninvited plus-ones or some affirmative RSVPs failing to attend. Selected experience figures transcribed with the couple/event denominator. 78% is the share of couples experiencing any affirmative-RSVP no-show, not 78% of accepted guests missing. 20% describes couples with an uninvited plus-one, not all guests. No actual per-guest no-show rate. Conditional reason percentage and summary etiquette wording excluded.
- S10. Money and Pensions Service (MaPS). A third of people decline wedding events as guests cut costs on celebrations. online research asking about events in the preceding 12 months; exact fieldwork dates not stated. Exact full sample, age-group n and question eligibility not provided on checked release. Method: Original commissioning organization’s release. Online interviewing using same consumer agency/panels as in 2025. Respondents asked about multiple events in past 12 months to mask specific wedding-guest focus. 40% describes respondents who declined at least one wedding-related event due to cost, including pre-wedding celebrations. It is not the share of all wedding invitations declined. Recall, unknown item base and age-specific scope limit generalization. Approximate overall one-in-three headline not converted into false precision.
Supporting records without additional observations
- R01. RSVPify. Wedding RSVP Response Time Calculator 2025. Dated 2022-05-12; headline refers to 2025. Original current calculator article checked. Describes a platform-based timeline calculator, but the checked page does not publish a dated, auditable fixed response-time table. No calculator output, guessed timing percentile or generic deadline counted as an observed statistic.
- R02. The Knot. Creating a Wedding Invitation With a QR Code Isn’t Rocket Science. Updated 2025-08-27. Original QR instructions and historical cross-check. Confirms 49% for 2024 and 38% for 2023, but gives 20% for 2022 versus 18% in the 2024 press release. 2022 point withheld; QR presence does not establish scans, response completion or attendance.
How to cite this resource
MyLittleDesire. Wedding Invitation And RSVP Statistics 2027. https://mylittledesire.com/wedding-invitation-rsvp-statistics/.