The Knot reports a US$12,900 average venue cost for 2025 US weddings. Bridebook’s 2026 report article gives £6,040 for UK venue hire excluding catering. Easy Weddings’ 2026 Australian report gives A$17,518 for venue cost. Their definitions, audiences and periods differ, so these figures belong beside their source descriptions. The Knot / The Knot Worldwide [S01]; Bridebook [S03]; Easy Weddings [S04].
This resource contains 63 published numerical observations in 12 grouped findings: 58 cost figures and five venue-hiring or package-inclusion percentages. Six numerical source records represent four brands across three publisher families. Categories, regions and repeated annual reports are observations within those research programs, rather than 63 independent studies.
US$12,900
£6,040
The Knot’s 2025 US venue-spend mean.Main study n=10,474; exact venue-item n unavailable. Packages may bundle services. The Knot / The Knot Worldwide [S01]
Bridebook’s UK mean venue hire, excluding catering.2026 report; over 7,000 married/engaged couples overall, item timing/base unknown. Bridebook [S03]
A$17,518
41%
Easy Weddings’ national venue-cost mean.2026 report with mixed planning/past inputs; exact venue-item n unavailable. Easy Weddings [S04]
Said catering was included in their reception-venue fee.The Knot’s article; exact answering n and item window unavailable. The Knot / The Knot Worldwide [S01]
What does a wedding venue cost include?
| Term | What it measures | What to check |
|---|---|---|
| Venue hire | Payment to use the space under the stated contract. | Whether furniture, coordination, ceremony rooms or other services are included. |
| Venue package spend | A reported venue bill that can bundle several services. | Catering, drinks, rentals, staffing and accommodation inclusions vary. |
| Food and beverage minimum | A minimum eligible purchase commitment. | Whether it replaces hire, sits beside it or excludes particular charges. |
| Per-person price | A specified package charge for each eligible guest. | Minimum guests, adult/child rates, meals, drinks and fees. |
| Average reported spend | A mean across the selected respondents. | It is not a quote, a median, a legal fee limit or a required budget. |
| Nominal historical difference | Change between figures in their original-year money. | It does not control for inflation, guest count, package scope or venue mix. |
The US article explicitly describes bundled venue fees. Bridebook identifies a hire-only column excluding catering. Easy Weddings explains that venues can charge by hire fee, per person, minimum spend or a combination. Comparing the headline figures without those definitions would mix different purchases. The Knot / The Knot Worldwide [S01]; Bridebook [S03]; Easy Weddings’ cost guide [R01].
For broader whole-wedding spending and budgets, see our wedding cost and budget statistics. A venue figure should retain its own service scope rather than being added to every other vendor average as though all categories were separate.
Also Read:-
Wedding Guest Count Statistics 2027
Premarital Counseling Statistics 2027
Relationship Arguments And Conflict Statistics 2027
First Date Safety Statistics 2027
How Couples Meet Statistics 2027
What is the average US wedding venue cost?
The Knot’s latest selected mean is US$12,900 for the 2025 wedding cohort, also shown in the original report’s vendor table. Its historical article table gives US$12,200 for 2024 and US$9,000 for 2016. The 2025 figure is therefore US$700 above 2024 and US$3,900 above 2016 in nominal dollars. These differences describe reported spending, with changing services and wedding choices left uncontrolled. The Knot / The Knot Worldwide [S01]; The Knot / The Knot Worldwide [S02].
F01 The publisher’s historical average venue-cost table, retaining nominal US dollars. 2020 is N/A in the source and is not a numeric observation. Different annual cohorts, unknown venue-item n, varying package inclusions; not inflation-adjusted or a price index.
| Measure / group | Published result | Actual cohort or report period | Source |
|---|---|---|---|
| 2016 | US$9,000 | 2016 wedding cohort in source-published historical table | Original source [S01] Average Wedding Venue Cost Over Time table |
| 2017 | US$9,000 | 2017 wedding cohort in source-published historical table | Original source [S01] Average Wedding Venue Cost Over Time table |
| 2018 | US$9,000 | 2018 wedding cohort in source-published historical table | Original source [S01] Average Wedding Venue Cost Over Time table |
| 2019 | US$10,500 | 2019 wedding cohort in source-published historical table | Original source [S01] Average Wedding Venue Cost Over Time table |
| 2021 | US$10,700 | 2021 wedding cohort in source-published historical table | Original source [S01] Average Wedding Venue Cost Over Time table |
| 2022 | US$11,200 | 2022 wedding cohort in source-published historical table | Original source [S01] Average Wedding Venue Cost Over Time table |
| 2023 | US$12,800 | 2023 wedding cohort in source-published historical table | Original source [S01] Average Wedding Venue Cost Over Time table |
| 2024 | US$12,200 | 2024 wedding cohort in source-published historical table | Original source [S01] Average Wedding Venue Cost Over Time table |
| 2025 | US$12,900 | 2025 wedding cohort in source-published historical table | Original source [S01] Average Wedding Venue Cost Over Time table |

The source marks 2020 N/A. No zero or interpolated cost has been inserted. The main 2025 survey has 10,474 adult couples, but the selected table does not supply the exact venue-cost answering count for each historical year.
How does venue spending vary with guest count?
The article reports venue means of US$6,500 for weddings with 1–50 guests, US$10,400 for 51–100 and US$16,000 for 101 or more. Group differences can reflect venue type, packages, location and other decisions as well as guest numbers. The gap does not identify the price of adding one person to an existing contract. The Knot / The Knot Worldwide [S01].
F02 Published venue-cost means for the source’s guest-count groups. 2025 main research context. Exact subgroup n unavailable. Bundles and venue choices differ; the gap is not a marginal charge per extra guest.
| Measure / group | Published result | Actual cohort or report period | Source |
|---|---|---|---|
| 1–50 guests | US$6,500 | 2025 main wedding-research context, published May 2026; exact item interview window not supplied | Original source [S01] Venue Size/Guest Capacity, Average Wedding Venue Cost by Guest Count table |
| 51–100 guests | US$10,400 | 2025 main wedding-research context, published May 2026; exact item interview window not supplied | Original source [S01] Venue Size/Guest Capacity, Average Wedding Venue Cost by Guest Count table |
| 101 or more guests | US$16,000 | 2025 main wedding-research context, published May 2026; exact item interview window not supplied | Original source [S01] Venue Size/Guest Capacity, Average Wedding Venue Cost by Guest Count table |
A fixed hire fee divided by a hypothetical guest list is a planning scenario. It should not be presented as an observed survey mean per guest. Actual variable charges and contractual minimums need their own treatment.
How often are services included in the venue fee?
The original US report says 89% hired a venue. The companion article separately reports reception-venue fee inclusions: rentals, catering and alcohol can appear together, while a space-only fee describes a narrower purchase. Hiring prevalence and package contents are related context rather than additional cost averages. The Knot / The Knot Worldwide [S02]; The Knot / The Knot Worldwide [S01].
F04 The venue row’s published % Hired value. Related hiring context, not a cost. Exact valid item n unavailable; do not infer respondent counts from the rounded percentage.
| Measure / group | Published result | Actual cohort or report period | Source |
|---|---|---|---|
| Hired a venue | 89% | US couples married January 1–December 31, 2025 | Original source [S02] PDF physical p.12 / printed p.10, Top Vendors Hired, venue row |
F03 The article’s percentages describing reception-venue package inclusions. Inclusions overlap and do not sum to 100%. “Space only” is a separate package description. Exact item base and interview window unavailable; not proportions of all venues on the market.
| Measure / group | Published result | Actual cohort or report period | Source |
|---|---|---|---|
| Rentals included | 74% | 2026 article citing The Knot Real Weddings Study; main 2025 research, item window unspecified | Original source [S01] Package Inclusions section |
| Catering included | 41% | 2026 article citing The Knot Real Weddings Study; main 2025 research, item window unspecified | Original source [S01] Package Inclusions section |
| Alcohol included | 37% | 2026 article citing The Knot Real Weddings Study; main 2025 research, item window unspecified | Original source [S01] Package Inclusions section |
| Fee covered space only | 7% | 2026 article citing The Knot Real Weddings Study; main 2025 research, item window unspecified | Original source [S01] Package Inclusions section |
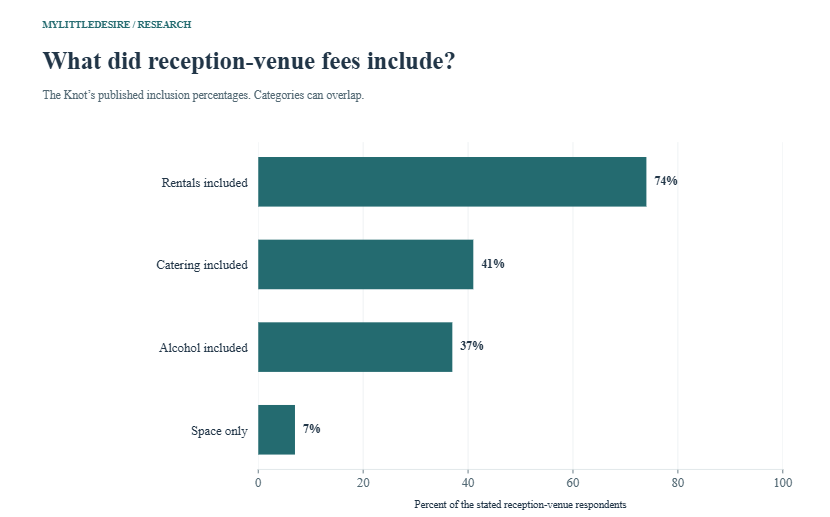
These inclusion percentages are reports from the selected audience. They do not describe the share of every venue on the market. Adding the rentals, catering and alcohol percentages would count some packages several times; the source does not provide joint counts needed to calculate an all-inclusive share.
What do UK venue-hire costs look like by type?
Bridebook’s public article attributes its venue figures to the 2026 UK Wedding Report, with over 7,000 married and engaged couples overall. Its hire-only mean is £6,040. We retain the article’s hire column separately from its catering-inclusive and whole-wedding columns. Exact cost-item cohorts and planned-versus-completed proportions are not supplied. Bridebook [S03].
F05 The article’s mean venue-hire cost excluding catering. 2026 report edition; exact cost-item wedding period and planned/completed split unavailable. Over 7,000 is a report-wide lower-bound sample description, not item n.
| Measure / group | Published result | Actual cohort or report period | Source |
|---|---|---|---|
| UK venue hire, excluding catering | £6,040 | 2026 UK Wedding Report as described in the public article; exact cost-item wedding cohorts and interview dates not established | Original source [S03] Opening summary / How Much Does a Wedding Venue Cost in the UK? |
F06 Venue hire column only, excluding catering, in the original publisher’s type table. Exact subgroup n, timing and planned/completed split unavailable. Group averages do not isolate the effect of choosing a venue type or guarantee savings.
| Measure / group | Published result | Actual cohort or report period | Source |
|---|---|---|---|
| Stately home | £8,958 | 2026 UK Wedding Report as described in the public article; exact cost-item wedding cohorts and interview dates not established | Original source [S03] Average Wedding Venue Cost by Venue Type table, Venue hire cost column |
| Castle | £7,380 | 2026 UK Wedding Report as described in the public article; exact cost-item wedding cohorts and interview dates not established | Original source [S03] Average Wedding Venue Cost by Venue Type table, Venue hire cost column |
| Country house | £7,485 | 2026 UK Wedding Report as described in the public article; exact cost-item wedding cohorts and interview dates not established | Original source [S03] Average Wedding Venue Cost by Venue Type table, Venue hire cost column |
| Outdoor venue | £6,319 | 2026 UK Wedding Report as described in the public article; exact cost-item wedding cohorts and interview dates not established | Original source [S03] Average Wedding Venue Cost by Venue Type table, Venue hire cost column |
| Barn | £6,343 | 2026 UK Wedding Report as described in the public article; exact cost-item wedding cohorts and interview dates not established | Original source [S03] Average Wedding Venue Cost by Venue Type table, Venue hire cost column |
| Attraction / museum | £5,044 | 2026 UK Wedding Report as described in the public article; exact cost-item wedding cohorts and interview dates not established | Original source [S03] Average Wedding Venue Cost by Venue Type table, Venue hire cost column |
| Event venue | £5,303 | 2026 UK Wedding Report as described in the public article; exact cost-item wedding cohorts and interview dates not established | Original source [S03] Average Wedding Venue Cost by Venue Type table, Venue hire cost column |
| Hotel | £5,156 | 2026 UK Wedding Report as described in the public article; exact cost-item wedding cohorts and interview dates not established | Original source [S03] Average Wedding Venue Cost by Venue Type table, Venue hire cost column |
| Golf course | £4,322 | 2026 UK Wedding Report as described in the public article; exact cost-item wedding cohorts and interview dates not established | Original source [S03] Average Wedding Venue Cost by Venue Type table, Venue hire cost column |
| City venue | £3,179 | 2026 UK Wedding Report as described in the public article; exact cost-item wedding cohorts and interview dates not established | Original source [S03] Average Wedding Venue Cost by Venue Type table, Venue hire cost column |
| Restaurant or pub | £2,419 | 2026 UK Wedding Report as described in the public article; exact cost-item wedding cohorts and interview dates not established | Original source [S03] Average Wedding Venue Cost by Venue Type table, Venue hire cost column |

The stately-home hire mean is £8,958 and the restaurant/pub mean is £2,419. The £6,539 difference compares selected groups. It is not a guaranteed saving from switching venues because the weddings, guest lists and included services can differ. The full underlying report and subgroup respondent counts were not independently accessed.
How do UK venue-hire costs differ by region?
The same source’s regional hire column ranges from £1,442 for Northern Ireland to £7,144 for Scotland. It reports £6,045 for London. These are hire-only results with unknown regional bases; a low hire figure does not establish a low final package bill. Source region labels stay unchanged. Bridebook [S03].
F07 Venue hire column in the source’s regional table. Source labels retained. Unknown regional answering n and cost period; package conventions and wedding mixes may differ. Low hire fees do not establish low all-in totals.
| Measure / group | Published result | Actual cohort or report period | Source |
|---|---|---|---|
| Scotland | £7,144 | 2026 UK Wedding Report as described in the public article; exact cost-item wedding cohorts and interview dates not established | Original source [S03] What Affects the Price of a Wedding Venue? Location table, Venue hire cost column |
| South West England | £6,564 | 2026 UK Wedding Report as described in the public article; exact cost-item wedding cohorts and interview dates not established | Original source [S03] What Affects the Price of a Wedding Venue? Location table, Venue hire cost column |
| South East England | £6,317 | 2026 UK Wedding Report as described in the public article; exact cost-item wedding cohorts and interview dates not established | Original source [S03] What Affects the Price of a Wedding Venue? Location table, Venue hire cost column |
| Wales | £6,076 | 2026 UK Wedding Report as described in the public article; exact cost-item wedding cohorts and interview dates not established | Original source [S03] What Affects the Price of a Wedding Venue? Location table, Venue hire cost column |
| London | £6,045 | 2026 UK Wedding Report as described in the public article; exact cost-item wedding cohorts and interview dates not established | Original source [S03] What Affects the Price of a Wedding Venue? Location table, Venue hire cost column |
| East of England | £5,865 | 2026 UK Wedding Report as described in the public article; exact cost-item wedding cohorts and interview dates not established | Original source [S03] What Affects the Price of a Wedding Venue? Location table, Venue hire cost column |
| North East England | £5,531 | 2026 UK Wedding Report as described in the public article; exact cost-item wedding cohorts and interview dates not established | Original source [S03] What Affects the Price of a Wedding Venue? Location table, Venue hire cost column |
| Yorkshire and the Humber | £5,355 | 2026 UK Wedding Report as described in the public article; exact cost-item wedding cohorts and interview dates not established | Original source [S03] What Affects the Price of a Wedding Venue? Location table, Venue hire cost column |
| West Midlands | £4,960 | 2026 UK Wedding Report as described in the public article; exact cost-item wedding cohorts and interview dates not established | Original source [S03] What Affects the Price of a Wedding Venue? Location table, Venue hire cost column |
| North West England | £6,211 | 2026 UK Wedding Report as described in the public article; exact cost-item wedding cohorts and interview dates not established | Original source [S03] What Affects the Price of a Wedding Venue? Location table, Venue hire cost column |
| East Midlands | £4,739 | 2026 UK Wedding Report as described in the public article; exact cost-item wedding cohorts and interview dates not established | Original source [S03] What Affects the Price of a Wedding Venue? Location table, Venue hire cost column |
| Northern Ireland | £1,442 | 2026 UK Wedding Report as described in the public article; exact cost-item wedding cohorts and interview dates not established | Original source [S03] What Affects the Price of a Wedding Venue? Location table, Venue hire cost column |
What does the Australian venue research show?
Easy Weddings’ 2026 report prints a national venue mean of A$17,518 and seven state/territory values. Its research combines engaged/recently married respondents with business and platform inputs. The overall “more than 4,200 couples” description does not identify each venue-cost denominator. Easy Weddings [S04].
F08 The national average on the report’s venue-cost map. Mixed planning/recently married industry research; exact cost-item period/base unavailable. Packages vary. Keep Australian dollars and report edition attached.
| Measure / group | Published result | Actual cohort or report period | Source |
|---|---|---|---|
| Australia, 2026 report | A$17,518 | 2026 industry report; mixed engaged/recently married audience, exact venue-item fieldwork and wedding periods not stated | Original source [S04] PDF physical/printed p.19, Average Cost of Wedding Venues |
F09 State and territory venue averages on the original map. Exact subgroup n unavailable. Tasmania is marked insufficient data and omitted, not zero. Northern Territory’s A$15,000 is printed on the original map.
| Measure / group | Published result | Actual cohort or report period | Source |
|---|---|---|---|
| New South Wales | A$18,662 | 2026 industry report; mixed engaged/recently married audience, exact venue-item fieldwork and wedding periods not stated | Original source [S04] PDF physical/printed p.19, Average Cost of Wedding Venues map |
| Victoria | A$17,988 | 2026 industry report; mixed engaged/recently married audience, exact venue-item fieldwork and wedding periods not stated | Original source [S04] PDF physical/printed p.19, Average Cost of Wedding Venues map |
| Queensland | A$15,849 | 2026 industry report; mixed engaged/recently married audience, exact venue-item fieldwork and wedding periods not stated | Original source [S04] PDF physical/printed p.19, Average Cost of Wedding Venues map |
| South Australia | A$17,433 | 2026 industry report; mixed engaged/recently married audience, exact venue-item fieldwork and wedding periods not stated | Original source [S04] PDF physical/printed p.19, Average Cost of Wedding Venues map |
| Western Australia | A$16,074 | 2026 industry report; mixed engaged/recently married audience, exact venue-item fieldwork and wedding periods not stated | Original source [S04] PDF physical/printed p.19, Average Cost of Wedding Venues map |
| Australian Capital Territory | A$15,524 | 2026 industry report; mixed engaged/recently married audience, exact venue-item fieldwork and wedding periods not stated | Original source [S04] PDF physical/printed p.19, Average Cost of Wedding Venues map |
| Northern Territory | A$15,000 | 2026 industry report; mixed engaged/recently married audience, exact venue-item fieldwork and wedding periods not stated | Original source [S04] PDF physical/printed p.19, Average Cost of Wedding Venues map |
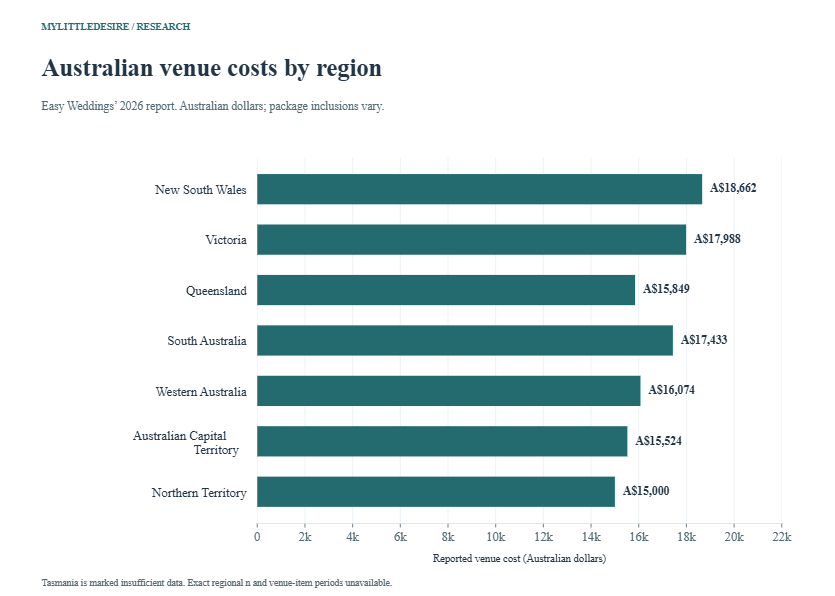
The original map supplies Northern Territory at A$15,000 and marks Tasmania as insufficient data. The earlier 2025 report does the reverse for those two regions: it provides Tasmania but marks Northern Territory unavailable. The tables preserve those gaps.
The earlier report’s national venue mean is A$15,987. Its foreword describes inputs from more than 4,000 couples and 800 businesses, with exact venue-item timing and subgroup bases unavailable. The A$1,531 difference between national report means does not measure a matched set of venues raising their prices. Easy Weddings [S05].
F10 The previous report’s national average venue cost. Report edition does not establish exact calendar wedding year. Unknown item n and variable package inclusions; not a constant venue-price index.
| Measure / group | Published result | Actual cohort or report period | Source |
|---|---|---|---|
| Australia, 2025 report | A$15,987 | 2025 industry report; planning/spending research for 2025 and beyond, exact venue-item wedding/fieldwork periods not stated | Original source [S05] PDF physical/printed p.19, Cost of Wedding Venues by State |
F11 State and territory venue averages on the earlier report’s map. Unknown item timing and subgroup n. Northern Territory is marked insufficient data, not zero. The later report lacks a comparable Tasmania value.
| Measure / group | Published result | Actual cohort or report period | Source |
|---|---|---|---|
| New South Wales | A$16,881 | 2025 industry report; planning/spending research for 2025 and beyond, exact venue-item wedding/fieldwork periods not stated | Original source [S05] PDF physical/printed p.19, Cost of Wedding Venues by State map |
| Victoria | A$16,545 | 2025 industry report; planning/spending research for 2025 and beyond, exact venue-item wedding/fieldwork periods not stated | Original source [S05] PDF physical/printed p.19, Cost of Wedding Venues by State map |
| Queensland | A$15,039 | 2025 industry report; planning/spending research for 2025 and beyond, exact venue-item wedding/fieldwork periods not stated | Original source [S05] PDF physical/printed p.19, Cost of Wedding Venues by State map |
| South Australia | A$15,585 | 2025 industry report; planning/spending research for 2025 and beyond, exact venue-item wedding/fieldwork periods not stated | Original source [S05] PDF physical/printed p.19, Cost of Wedding Venues by State map |
| Western Australia | A$14,153 | 2025 industry report; planning/spending research for 2025 and beyond, exact venue-item wedding/fieldwork periods not stated | Original source [S05] PDF physical/printed p.19, Cost of Wedding Venues by State map |
| Australian Capital Territory | A$13,554 | 2025 industry report; planning/spending research for 2025 and beyond, exact venue-item wedding/fieldwork periods not stated | Original source [S05] PDF physical/printed p.19, Cost of Wedding Venues by State map |
| Tasmania | A$14,028 | 2025 industry report; planning/spending research for 2025 and beyond, exact venue-item wedding/fieldwork periods not stated | Original source [S05] PDF physical/printed p.19, Cost of Wedding Venues by State map |
The cost guide explains varied package and minimum-spend arrangements. Its budget-share wording also differs from the PDF, so no venue-share percentage is imported here. An itemized quote remains necessary to determine what a couple is actually buying. Original guide [R01].
What did historical UK surveys report?
Hitched’s historical cost breakdowns report venue hire separately from catering. The selected nominal means span 2016–2019 and 2021–2022. The original page gives 2,060 couples for its 2021 survey, conducted online in November 2021–January 2022, and 2,457 UK individuals for its 2022 research. Those full-survey samples are not substituted for venue-item answering n. Hitched / The Knot Worldwide [S06].
F12 Venue hire in the publisher’s historical annual wedding-spend breakdowns. Nominal prices from different annual samples. Catering is a separate category. Exact venue-item n and older methods unavailable. No value interpolated for missing years, and no comparison to Bridebook presented as a continuous trend.
| Measure / group | Published result | Actual cohort or report period | Source |
|---|---|---|---|
| 2016 | £3,738 | 2016 UK wedding cohort; historical section of page updated January 2026 | Original source [S06] Average wedding cost / spending breakdown for 2016, Venue hire row |
| 2017 | £4,354 | 2017 UK wedding cohort; historical section of page updated January 2026 | Original source [S06] Average wedding cost / spending breakdown for 2017, Venue hire row |
| 2018 | £5,221 | 2018 UK wedding cohort; historical section of page updated January 2026 | Original source [S06] Average wedding cost / spending breakdown for 2018, Venue hire row |
| 2019 | £5,406 | 2019 UK wedding cohort; historical section of page updated January 2026 | Original source [S06] Average wedding cost / spending breakdown for 2019, Venue hire row |
| 2021 | £7,600 | 2021 UK wedding cohort; historical section of page updated January 2026 | Original source [S06] Average wedding cost / spending breakdown for 2021, Venue hire row |
| 2022 | £8,400 | 2022 UK wedding cohort; historical section of page updated January 2026 | Original source [S06] Average wedding cost / spending breakdown for 2022, Venue hire row |
These older Hitched values are historical context. They are not joined to Bridebook’s 2026 report mean as a continuous UK series. Changing publisher, population, timing and purchase definition would make that comparison difficult to interpret.
How can couples compare venue quotes fairly?
Use published means to understand scale, then compare quotes for the same date, eligible guest count and service list. A useful comparison records hire, catering, drinks, rentals and required charges as separate lines, marking services already bundled so they are not added twice. This is a practical comparison method rather than a measured survey result.
| Area | Ask the venue |
|---|---|
| Access and spaces | Which ceremony/reception rooms, setup hours, exclusivity and finish time are included? |
| Food and drink | What is included, which minimum applies, and how are adult, child and supplier meals counted? |
| Furniture and equipment | Are tables, chairs, linen, tableware, kitchen equipment, lighting and sound included? |
| People and operations | Does the quote include staffing, coordination, cleaning, security, power and required facilities? |
| Additional charges | Which taxes, service charges, corkage, overtime, accommodation commitments or other mandatory items remain? |
| Payment and changes | What deposit, payment dates, guest-count deadline and change/cancellation terms apply? |
Keep refundable deposits distinct from final expense and record the contract’s actual terms. General survey averages do not establish a venue’s legal obligations or your final bill. A cheaper headline hire fee may carry more separately purchased services.
Ten reproducible cost and inclusion comparisons
The workbook reproduces ten descriptive differences using stable observation IDs. Currency checks prevent US dollars, Australian dollars and pounds from being combined. The final inclusion comparison uses percentage points. Calculations reuse observations and do not add to the 63-count.
| Comparison | First | Second | Difference | Qualification |
|---|---|---|---|---|
| US venue mean: 2025 minus 2024 | US$12,900 | US$12,200 | +700 USD | Different annual cohorts; nominal reported spend, not an inflation index. |
| US venue mean: 2025 minus 2016 | US$12,900 | US$9,000 | +3,900 USD | Long-term nominal difference; changing wedding/package mix not controlled. |
| US venue mean: 2025 minus 2019 | US$12,900 | US$10,500 | +2,400 USD | Descriptive pre-pandemic versus latest cohort means. |
| US venue mean: 101+ minus 1–50 guests | US$16,000 | US$6,500 | +9,500 USD | Selected guest groups; not the cost of adding an individual guest. |
| UK hire: stately home minus restaurant/pub | £8,958 | £2,419 | +6,539 GBP | Same hire-only column; groups differ in services, guest counts and selection. |
| UK hire: Scotland minus East Midlands | £7,144 | £4,739 | +2,405 GBP | Same regional table; subgroup n unknown. Not matched quotes. |
| Australia 2026: NSW minus ACT | A$18,662 | A$15,524 | +3,138 AUD | Same report map; venue packages and sample mixes differ. |
| Australia national: 2026 report minus 2025 report | A$17,518 | A$15,987 | +1,531 AUD | Difference of published report means; exact item periods unknown. Not measured venue-price inflation. |
| Hitched UK hire: 2022 minus 2021 | £8,400 | £7,600 | +800 GBP | Separate historical annual samples, nominal values. |
| US venue inclusions: rentals minus catering | 74% | 41% | +33 percentage points | Overlapping inclusion categories; not mutually exclusive market shares. |
Common questions
Does the US$12,900 venue average include food?
It covers varied venue packages. The companion US article says catering was included for 41% of its reception-venue respondents. It does not mean every reported venue bill includes food.
Does the UK £6,040 figure include catering?
No. The selected Bridebook hire column explicitly excludes catering. Its catering-inclusive figures use a different measure and are not merged into the hire-only tables.
Is a dry-hire venue always cheaper overall?
The hire fee alone cannot answer that. Compare the total required service list, including anything sourced separately, using an actual quote.
Can I multiply an average per-guest price by my headcount?
That may be a rough scenario if the package and eligible guests match. It does not account for fixed fees, minimums or services outside that price, and it does not become a survey statistic.
Do historical increases measure venue inflation?
They measure differences in nominal reported means. The selected sources do not hold guest counts, services, locations or venues constant, so no pure price-inflation estimate is calculated.
Why are Canadian prices missing?
No independently verified original national venue-cost benchmark was selected for Canada. US figures and currency conversions are not used as a substitute.
Are these national spending requirements?
No. They are selected commercial research results with unknown item bases. Actual quotes, event choices and contractual terms determine the relevant cost for a couple.
Research method and limitations
MyLittleDesire compiled selected original publisher reports and articles. AI assisted retrieval, organization and drafting. No new survey, respondent-level reanalysis, exhaustive systematic review, exchange-rate conversion, inflation adjustment or causal cost model was conducted. Selected PDF tables/maps and source methods were checked, alongside original article tables and definitions.
The 63 observations comprise 16 from S01, one from S02, 24 from S03, eight each from S04/S05 and six from S06. There are 12 US-dollar, 30 pound-sterling and 16 Australian-dollar cost figures, plus five related percentages. Four charts and ten calculations reuse these values. Full-survey lower bounds and exact unknown item bases remain separate.
- Shared sources: The Knot’s article and PDF share the main 2025 program. Hitched also belongs to The Knot Worldwide. Easy Weddings annual reports and Bridebook categories are not independent replications.
- Measurement: reported package spend and hire excluding catering stay distinct. Means do not supply medians or a distribution of every venue’s prices.
- Timing: actual historical wedding cohorts and report-only periods remain attached. Publication date is not silently used as interview or wedding date.
- Samples: commercial audiences and mixed planning/past respondents limit generalization. Exact venue-item and subgroup n stays unavailable rather than being replaced with report-wide totals.
- Missingness: US 2020 venue cost, Australia 2026 Tasmania and Australia 2025 Northern Territory are unavailable, with no zeros or interpolated values inserted.
- Comparisons: no currency pooling, adjusted national rankings, pure inflation estimate, marginal cost per guest or guaranteed saving is inferred.
Original sources and supporting records
- S01. The Knot / The Knot Worldwide. Average Wedding Venue Cost: The Truth About How Much Real Couples Spend. Publication: 2026-05-06 update. Actual period: Main 2025 US wedding cohort; source-published historical venue series 2016–2025 with 2020 unavailable. Main 2025 study n=10,474 adult couples. Exact venue-cost, inclusion, guest-group and historical-year answering n unavailable. Main report also uses ad hoc studies. Method: Publisher analysis accompanying its 2026 Real Weddings Study. Main newlywed sample recruited by email from The Knot/WeddingWire membership during 2025. Historical table reproduced by publisher; package-inclusion results transcribed with their reception-venue wording. Commercial member/platform sample, not a national probability sample. Venue spend may include rentals, catering and alcohol; not bare-space hire. Historical figures are nominal and are not a constant venue panel or a price index. Inclusion categories overlap. Exact item-specific interview windows not established. S02 uses the same main 2025 research program. Supporting records: record 1.
- S02. The Knot / The Knot Worldwide. 2026 Real Weddings Study: Data Read-Out. Publication: 2026 report; 2026-02-18 release. Actual period: US couples married January 1–December 31, 2025. Main study n=10,474. Exact valid venue-hiring item n unavailable. Do not reconstruct a respondent count from the rounded percentage. Method: Email recruitment from The Knot/WeddingWire membership during 2025; report includes additional ad hoc research. Main methods physical p.4 / printed02. Selected venue row physical p.12 / printed10. Same main program as S01. The venue-cost mean of US$12,900 is already counted in S01 and is not counted again. Hiring prevalence is related context, not a cost. Vendor spending categories can overlap through bundled packages. Supporting records: record 1, record 2.
- S03. Bridebook. Wedding Venue Cost: How Much Does a Wedding Venue Cost in the UK?. Publication: 2026-07-13 update. Actual period: 2026 UK Wedding Report as described in the public article; exact cost-item wedding cohorts and interview dates not established. Over 7,000 married and engaged couples overall. Exact total, completed-versus-planned cost split, item answering n and venue-type/regional n unavailable. Method: Original publisher article attributes national, venue-type and regional means to its 2026 UK Wedding Report. Selected venue-hire column excludes catering. Public tables checked directly; full underlying gated report and respondent data not independently accessed. Selected commercial audience; recruitment/weighting details and item bases not supplied in the checked article. Publication/report year is not assigned as exact wedding year. Hire-only means are not directly equivalent to US/Australian package spend. Venue types and regions differ in guest lists and services; no causal savings inferred. Supporting records: record 1.
- S04. Easy Weddings. 2026 Australian Wedding Industry Report. Publication: 2026 report; exact PDF publication day not stated. Actual period: 2026 industry report; mixed engaged/recently married audience, exact venue-item fieldwork and wedding periods not stated. More than 4,200 couples and 540 businesses, plus marketplace/Instagram inputs. Exact couple total, venue-item n and state/territory answering n unavailable. Method: Original annual industry report combines engaged/recently married couple surveys, business research and platform/community information. National and state/territory average venue costs transcribed from physical/printed p.19. Definitions supported by publisher venue-cost guide. Report edition is not a completed-wedding calendar-year census. Venue packages have varying inclusions and may include food/drink/service. Exact subgroup n unavailable. Tasmania is marked insufficient data, not zero. Cross-edition differences are not matched quotes or an inflation index. Supporting records: record 1, record 2.
- S05. Easy Weddings. 2025 Australian Wedding Industry Report. Publication: 2025 edition; publisher announcement updated 2025-02-06; exact PDF release day not stated. Actual period: 2025 industry report; planning/spending research for 2025 and beyond, exact venue-item wedding/fieldwork periods not stated. More than 4,000 couples and 800 businesses overall, plus spending/community data. Exact cost-item and state/territory n unavailable. Method: Original report foreword physical/printed p.2 describes survey and platform inputs. National and state/territory venue means transcribed from physical/printed p.19. Mixed report inputs and unknown item timing. Do not relabel as completed 2024 or 2025 attendance/spending. Packages vary and may bundle services. Northern Territory is marked insufficient data, not zero. Changes versus S04 are descriptive differences of published report means. Supporting records: record 1.
- S06. Hitched / The Knot Worldwide. How Much Does a Wedding Cost in 2026? Average UK Wedding Now Costs £21,990. Publication: 2026-01-12 update; selected historical sections refer to earlier surveys. Actual period: Selected UK wedding cohorts 2016, 2017, 2018, 2019, 2021 and 2022. 2021 full survey: 2,060 couples, online November 2021–January 2022. 2022 full survey: 2,457 UK individuals, email/social recruitment throughout 2022. Exact venue-item n and older cohort samples not established in selected sections. Method: Original publisher historical cost breakdowns. Separate annual retrospective surveys rather than a respondent/venue panel. Current page’s 2025 full-study sample is not assigned to the selected earlier cohorts. Historical nominal venue-hire means, not current quotes, inflation-adjusted prices or a forecast. Catering appears separately in the cost breakdowns. Annual selection and venue mix can vary. Hitched shares The Knot Worldwide ownership with S01/S02; not fully independent publisher evidence.
Supporting context, without additional numerical observations
- R01. Easy Weddings. How much does a wedding venue cost?. 2026-02-28 update. Supporting definitions and duplicate national/regional venue values. Explains minimum-spend, per-person and hire-fee pricing. National and six regional means agree with the 2026 PDF; Northern Territory is supplied by the PDF map. Generic expert per-head ranges are guidance, not additional survey observations. Article’s 45% budget share differs from the PDF’s 46%; neither share is adopted here.
- R02. Bridebook. 2026 UK Wedding Report public landing page. 2026 report. Report identity and overall audience context. Public context for the research cited by the venue article; selected cost values are attributed to the public original article. Full underlying report and exact cost-item bases not independently accessed; numerical observations use the public original venue article.
How to cite this resource
MyLittleDesire. Wedding Venue Cost Statistics 2027. https://mylittledesire.com/wedding-venue-cost-statistics/.