The Knot reports a mean of 117 guests for 2025 US weddings in its member-based research. That is a useful reference point for scale, alongside the kind of wedding, audience and country being measured. A planned list, an ideal list, a revised invitation list and completed attendance can produce different answers. The Knot / The Knot Worldwide [S01].
This resource contains 52 published numeric observations in 17 grouped findings: 44 guest-count means, two source-published gaps in guests and six related planning/logistics percentages. They come from six numerical source records across three contributing organizations. Repeated categories and subgroups are observations within research programs, rather than 52 independent studies.
117 guests
123 / 69
The Knot’s mean for the US wedding cohort.Main survey n=10,474; exact guest-item n unavailable. The Knot / The Knot Worldwide [S01]
Hometown / international destination means inUS research.Different selected wedding groups; exact subgroup n unavailable. The Knot / The Knot Worldwide [S02]
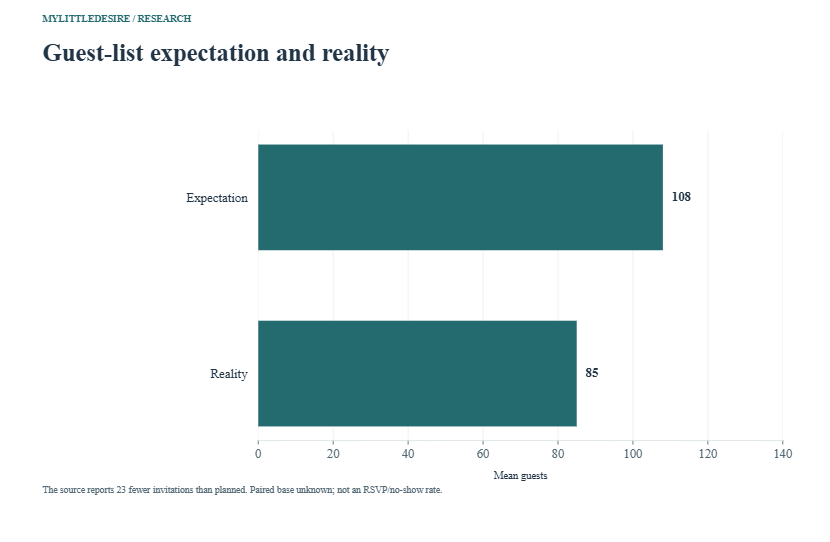
108 / 85
145 guests
Easy Weddings’ expectation / reality guest-list means. Australian report; mixed planning/past respondents. Easy Weddings [S04]
Zola’s average list among surveyed couples.Planning-stage audience; over 11,500 couples overall, exact item n unknown. Zola [S06]
What does a wedding guest count measure?
| Measure | What it tells you | What still needs checking |
|---|---|---|
| Ideal list | People a couple would like to include. | Whether budget, venue or invitation decisions have been applied. |
| Planned list | Intended event size when the question was asked. | Planning stage and whether the list later changed. |
| Invited people | People covered by invitations, including accepted plus-ones where defined. | Individuals versus invitation households and event eligibility. |
| Accepted RSVPs | Invited people who said yes. | Whether the denominator includes all invitees or only replies. |
| Actual attendance | People recorded as present at a defined event. | Ceremony, reception, evening-only guests and repeat attendance. |
| Mean guest count | An arithmetic average across measured weddings/lists. | The median, distribution and exact inclusion of children, vendors and wedding party may be unavailable. |
The selected sources do not supply a consistent definition covering all these stages. We preserve each publisher’s wording. A large wedding in one survey may be ordinary in another setting, and a mean does not tell you the share of weddings above a particular headcount.
Also Read:-
Premarital Counseling Statistics 2027
Relationship Arguments And Conflict Statistics 2027
First Date Safety Statistics 2027
First Date Safety Statistics 2027
How Couples Meet Statistics 2027
Dating After Divorce Statistics 2027
What is the average US wedding guest count?
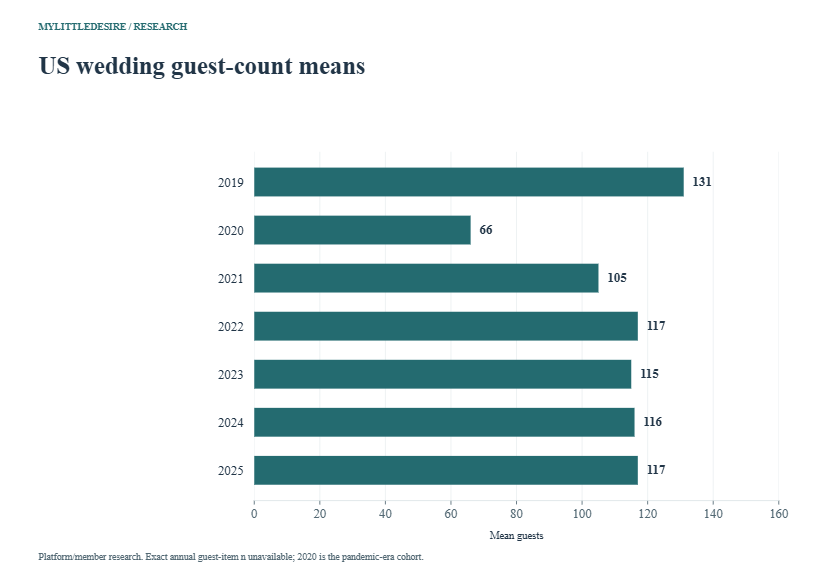
The Knot’s report reproduces a seven-point US series: 131 guests in 2019, a pandemic-era low of 66 in 2020, and 117. The latest point is one guest above 2024 and 14 below 2019. These are differences between published cohort means, without a common respondent panel or a causal explanation. The Knot / The Knot Worldwide [S01].
F01 The report’s historical mean guest-size series. Published annual means, not medians or a respondent panel. Exact item n unknown; 2020 is the pandemic-era point. Changes do not prove an underlying causal trend.
| Measure / group | Published result | Actual cohort or report period | Source |
|---|---|---|---|
| 2019 | 131 guests | 2019 wedding cohort, as reproduced in the report | Original source [S01] PDF physical p.5 / printed p.03, Weddings over the years |
| 2020 | 66 guests | 2020 wedding cohort, as reproduced in the report | Original source [S01] PDF physical p.5 / printed p.03, Weddings over the years |
| 2021 | 105 guests | 2021 wedding cohort, as reproduced in the report | Original source [S01] PDF physical p.5 / printed p.03, Weddings over the years |
| 2022 | 117 guests | 2022 wedding cohort, as reproduced in the report | Original source [S01] PDF physical p.5 / printed p.03, Weddings over the years |
| 2023 | 115 guests | 2023 wedding cohort, as reproduced in the report | Original source [S01] PDF physical p.5 / printed p.03, Weddings over the years |
| 2024 | 116 guests | 2024 wedding cohort, as reproduced in the report | Original source [S01] PDF physical p.5 / printed p.03, Weddings over the years |
| 2025 | 117 guests | 2025 wedding cohort, as reproduced in the report | Original source [S01] PDF physical p.5 / printed p.03, Weddings over the years |
How do guest lists differ by generation?
In the 2025 US research, Gen Z’s published mean is 129, compared with 112 for Millennials and 90 for Gen X. The global report separately gives US generation means for the 2024 newlywed cohort. Keep the two cohorts distinct. The generation labels do not establish that age itself determines the size of a wedding. The Knot / The Knot Worldwide [S02]; The Knot Worldwide [S03].
F02 Source-defined generation groups within the US wedding research. Exact generation n and cutoffs not specified beside the table. Differences describe selected groups, not an effect of age.
| Measure / group | Published result | Actual cohort or report period | Source |
|---|---|---|---|
| Gen Z | 129 guests | 2025 weddings; article published | Original source [S02] What Is the Average Wedding Size? / At a Glance |
| Millennials | 112 guests | 2025 weddings; article published | Original source [S02] What Is the Average Wedding Size? / At a Glance |
| Gen X | 90 guests | 2025 weddings; article published | Original source [S02] What Is the Average Wedding Size? / At a Glance |
F08 US generation results in the global report’s US trend discussion. Different cohort from the 2025 generation means. Overall US survey n=16,956 is not each generation’s answering n. Do not interpret as a matched cohort panel.
| Measure / group | Published result | Actual cohort or report period | Source |
|---|---|---|---|
| Gen Z | 131 guests | 2024 US newlyweds; 2025 Global Wedding Report | Original source [S03] Trendspotting across the globe, US generation discussion |
| Millennials | 113 guests | 2024 US newlyweds; 2025 Global Wedding Report | Original source [S03] Trendspotting across the globe, US generation discussion |
| Gen X | 88 guests | 2024 US newlyweds; 2025 Global Wedding Report | Original source [S03] Trendspotting across the globe, US generation discussion |
How do US regions compare?
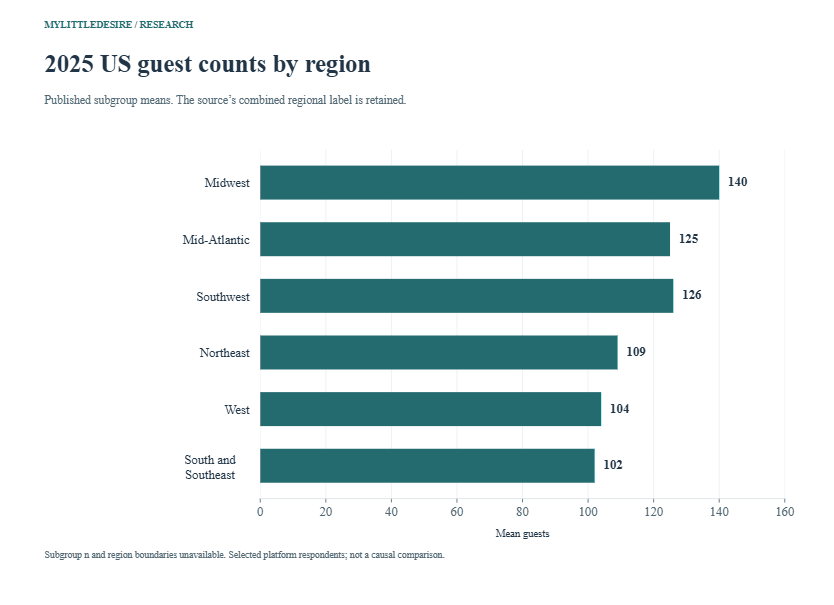
The 2025 article reports a Midwest mean of 140 guests and a mean of 102 for its combined “South and Southeast” label. Regional boundaries and subgroup counts are not supplied next to these results, so they should stay attached to the publisher’s labels. No regional weighting or map is reconstructed. The Knot / The Knot Worldwide [S02].
F03 Regional mean guest counts, using the article’s regional labels. Exact regional n and geographic boundaries not supplied. “South and Southeast” is one combined source label; do not split it into two observations.
| Measure / group | Published result | Actual cohort or report period | Source |
|---|---|---|---|
| Midwest | 140 guests | 2025 weddings | Original source [S02] Factors That Impact Wedding Guest Size, geographic paragraph |
| Mid-Atlantic | 125 guests | 2025 weddings | Original source [S02] Factors That Impact Wedding Guest Size, geographic paragraph |
| Southwest | 126 guests | 2025 weddings | Original source [S02] Factors That Impact Wedding Guest Size, geographic paragraph |
| Northeast | 109 guests | 2025 weddings | Original source [S02] Factors That Impact Wedding Guest Size, geographic paragraph |
| West | 104 guests | 2025 weddings | Original source [S02] Factors That Impact Wedding Guest Size, geographic paragraph |
| South and Southeast | 102 guests | 2025 weddings | Original source [S02] Factors That Impact Wedding Guest Size, geographic paragraph |
How many guests attend destination weddings?
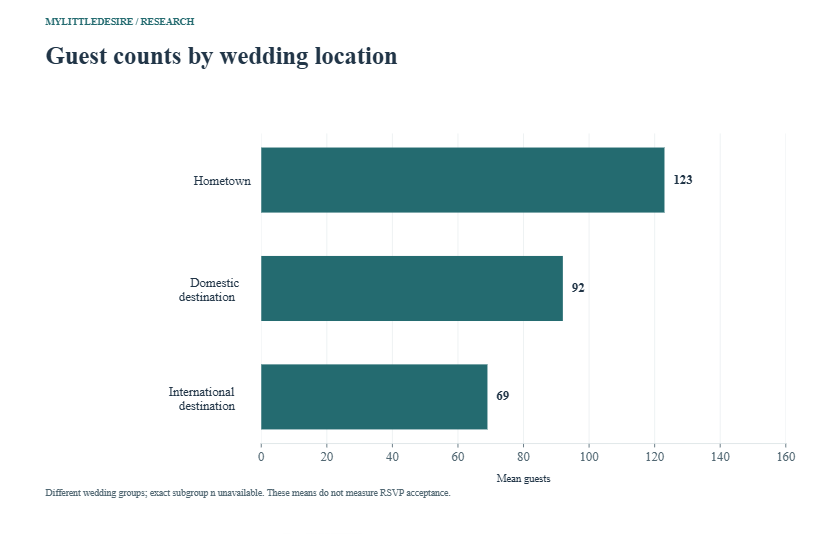
The Knot reports means of 123 for hometown weddings, 92 for domestic destination weddings and 69 for international destination weddings. These are group-level guest counts. They cannot tell a couple how many invited relatives will travel to a particular location. The Knot / The Knot Worldwide [S02].
F04 Hometown, domestic destination and international destination weddings. Exact subgroup n unknown. These selected group means do not estimate an individual invitee’s probability of attending and do not show that travel alone caused a smaller list.
| Measure / group | Published result | Actual cohort or report period | Source |
|---|---|---|---|
| Hometown | 123 guests | 2025 weddings | Original source [S02] Factors That Impact Wedding Guest Size, destination paragraph |
| Domestic destination | 92 guests | 2025 weddings | Original source [S02] Factors That Impact Wedding Guest Size, destination paragraph |
| International destination | 69 guests | 2025 weddings | Original source [S02] Factors That Impact Wedding Guest Size, destination paragraph |
F11 Mean guest count for destination weddings in the report. Destination includes interstate and overseas. Subgroup n and exact guest-item period unavailable; do not treat the overall-versus-destination difference as a travel effect.
| Measure / group | Published result | Actual cohort or report period | Source |
|---|---|---|---|
| Destination weddings | 55 guests | mixed engaged/recently married respondents, exact fieldwork and guest-item periods not stated | Original source [S04] PDF physical/printed p.43, destination wedding section |
Easy Weddings’ Australian report separately lists 55 guests for destination weddings, including interstate and overseas events. Its mixed report population and definition differ from the US groups. The figures are useful as separate references; averaging them would conceal those differences. Easy Weddings [S04].
Do guest counts vary across the calendar?
The US article’s largest calendar block is July–September at 123 guests, while October–December is 112. The blocks are quarters of the calendar. Their differences may reflect many choices and sample characteristics; they do not establish a weather-driven attendance effect. The Knot / The Knot Worldwide [S02].
F05 Published blocks of three calendar months. Quarter blocks are not standardized meteorological seasons. Exact subgroup n unknown; no causal weather or turnout claim.
| Measure / group | Published result | Actual cohort or report period | Source |
|---|---|---|---|
| January–March | 117 guests | 2025 weddings | Original source [S02] Factors That Impact Wedding Guest Size, seasonality paragraph |
| April–June | 121 guests | 2025 weddings | Original source [S02] Factors That Impact Wedding Guest Size, seasonality paragraph |
| July–September | 123 guests | 2025 weddings | Original source [S02] Factors That Impact Wedding Guest Size, seasonality paragraph |
| October–December | 112 guests | 2025 weddings | Original source [S02] Factors That Impact Wedding Guest Size, seasonality paragraph |
How do guest counts relate to spending?
The article reports 92 guests among weddings costing under US$12,000, around 117 in its middle band and 141 above US$41,000. Larger events and higher spending occur together in these groups. That association does not identify how much an individual couple saves by removing one invitation. The Knot / The Knot Worldwide [S02].
F06 Mean guests by reported wedding spending band, in US dollars. Association is not marginal cost per guest or guaranteed savings from removing an invitation. Middle-band mean is approximate in the source; subgroup n unknown.
| Measure / group | Published result | Actual cohort or report period | Source |
|---|---|---|---|
| Under US$12,000 | 92 guests | 2025 weddings | Original source [S02] Factors That Impact Wedding Guest Size, cost paragraph |
| US$12,000–US$41,000 | Around 117 guests | 2025 weddings | Original source [S02] Factors That Impact Wedding Guest Size, cost paragraph |
| Over US$41,000 | 141 guests | 2025 weddings | Original source [S02] Factors That Impact Wedding Guest Size, cost paragraph |
For wider spending context, see our wedding cost and budget statistics. For your own list, use the catering contract’s actual variable charges, venue minimums and fixed fees rather than multiplying a survey’s average total cost per guest by the names removed.
What do the international samples show?
The Knot Worldwide’s global report covers 2024 newlyweds across eight markets. Its total sample is 33,174, split between 16,956 US and 16,218 international respondents. The selected chart shows seven non-US guest means below. Exact country guest-item n is unavailable; the full sample is not each country’s denominator. The Knot Worldwide [S03].
F07 Country averages from the original global report’s at-a-glance chart, excluding the duplicate US point. Exact country/item n unknown. These are selected platform respondents, not national probability estimates or an adjusted comparison of cultures.
| Measure / group | Published result | Actual cohort or report period | Source |
|---|---|---|---|
| United Kingdom | 89 guests | 2024 newlywed cohort; Global Wedding Report | Original source [S03] Publisher-hosted Wedding Snapshot Around the World chart, Average Guest Size column |
| Spain | 116 guests | 2024 newlywed cohort; Global Wedding Report | Original source [S03] Publisher-hosted Wedding Snapshot Around the World chart, Average Guest Size column |
| Italy | 106 guests | 2024 newlywed cohort; Global Wedding Report | Original source [S03] Publisher-hosted Wedding Snapshot Around the World chart, Average Guest Size column |
| France | 97 guests | 2024 newlywed cohort; Global Wedding Report | Original source [S03] Publisher-hosted Wedding Snapshot Around the World chart, Average Guest Size column |
| Brazil | 121 guests | 2024 newlywed cohort; Global Wedding Report | Original source [S03] Publisher-hosted Wedding Snapshot Around the World chart, Average Guest Size column |
| Mexico | 140 guests | 2024 newlywed cohort; Global Wedding Report | Original source [S03] Publisher-hosted Wedding Snapshot Around the World chart, Average Guest Size column |
| India | 330 guests | 2024 newlywed cohort; Global Wedding Report | Original source [S03] Publisher-hosted Wedding Snapshot Around the World chart, Average Guest Size column |
These results describe the publisher’s surveyed audiences. Event scope, local customs and who uses a platform can differ. India’s sample mean of 330 does not establish a nationwide typical wedding or an adjusted country ranking. The chart’s US mean of 116 is already represented in the historical US series, so it is not counted again.
Australian guest-list expectations and reported reality
Easy Weddings’ 2026 report labels its means “expectation” at 108 and “reality” at 85. Its accompanying narrative says couples invite an average of 23 fewer guests than originally planned. The exact timing, guest-item denominator and paired base are unavailable. Treat this as a published planning/reported-list gap. Easy Weddings [S04].
F09 The report’s two published mean guest-list labels. Mixed engaged/recently married report; exact timing and paired base not established. The accompanying narrative describes inviting fewer guests. These are not invitation-versus-attendance counts.
| Measure / group | Published result | Actual cohort or report period | Source |
|---|---|---|---|
| Expectation | 108 guests | 2026 report; mixed engaged/recently married respondents, exact fieldwork and guest-item periods not stated | Original source [S04] PDF physical/printed p.7, How Many Guests |
| Reality | 85 guests | 2026 report; mixed engaged/recently married respondents, exact fieldwork and guest-item periods not stated | Original source [S04] PDF physical/printed p.7, How Many Guests |
F10 The report states couples invite an average of 23 fewer guests than originally planned. Source-published gap, reusing F09’s means rather than a new sample or independently calculated statistic. No RSVP acceptance/no-show rate inferred.
| Measure / group | Published result | Actual cohort or report period | Source |
|---|---|---|---|
| Fewer invited than originally planned | 23 fewer guests | 2026 report; mixed engaged/recently married respondents, exact fieldwork and guest-item periods not stated | Original source [S04] PDF physical/printed p.7, How Many Guests narrative |
The publisher’s 2025 report article separately gives 88 guests “now”, with earlier comparisons of 89, 92 and 98 under relative labels. It also reports a 28-guest shortfall from what couples would like. Those labels do not establish exact calendar wedding years, so the table retains them instead of inventing a harmonized annual Australian trend. Easy Weddings [S05].
F14 The 2025 report article’s “now”, “last year”, “year before” and “pre-COVID” guest-count labels. The source does not establish exact covered calendar years in the selected passage. Preserve relative labels rather than inventing annual dates; not harmonized with the 2026 report.
| Measure / group | Published result | Actual cohort or report period | Source |
|---|---|---|---|
| Now (2025 report wording) | 88 guests | 2025 report; source-relative “now”, “last year”, “year before” and “pre-COVID” labels | Original source [S05] Guest lists are shrinking section |
| Last year (relative source label) | 89 guests | 2025 report; source-relative “now”, “last year”, “year before” and “pre-COVID” labels | Original source [S05] Guest lists are shrinking section |
| Year before (relative source label) | 92 guests | 2025 report; source-relative “now”, “last year”, “year before” and “pre-COVID” labels | Original source [S05] Guest lists are shrinking section |
| Pre-COVID (source label) | 98 guests | 2025 report; source-relative “now”, “last year”, “year before” and “pre-COVID” labels | Original source [S05] Guest lists are shrinking section |
F15 The source says couples invite 28 fewer guests than they would like. Source-published gap, not RSVP attrition. Do not infer and count an unpublished ideal mean or claim every removed invitation resulted from one cause.
| Measure / group | Published result | Actual cohort or report period | Source |
|---|---|---|---|
| Fewer than would like | 28 fewer guests | 2025 report; source-relative “now”, “last year”, “year before” and “pre-COVID” labels | Original source [S05] Guest lists are shrinking section |
What planning surveys show?
Zola’s 2026 First Look surveyed over 11,500 couples getting married in 2026 and reports an average of 145 guests. The audience is engaged couples discussing their plans. It is not the same population or measurement stage as The Knot’s completed 2025 weddings, so the difference cannot be presented as national year-over-year growth. Zola [S06].
F16 Reported average guest list among couples getting married in 2026. Selected engaged-couple sample. A planning mean is not completed attendance and cannot be compared with The Knot’s 2025 mean as a same-sample trend.
| Measure / group | Published result | Actual cohort or report period | Source |
|---|---|---|---|
| 2026 surveyed couples’ guest list | 145 guests | Couples getting married in 2026; planning-stage survey, exact fieldwork dates not provided | Original source [S06] The average cost of a wedding remains $36,000 section, guest count paragraph |
For separate research on the lead-up to marriage, see our engagement and proposal statistics. A report’s publication year, intended wedding year and actual interview period are separate dates.
Guest-list stress, seating and extra events
The following six percentages concern list management and event plans. They broaden the practical context but are not six more guest-count averages. Exact item bases are unavailable in the selected report passages.
F12 Guest list appears among the report’s top planning stressors. Related logistics percentage, not a guest headcount, share of invitations lost or an exact population prevalence. Question eligibility and exact n unavailable.
| Measure / group | Published result | Actual cohort or report period | Source |
|---|---|---|---|
| Guest list among top stressors | 15% | 2026 report; mixed engaged/recently married respondents, exact fieldwork and guest-item periods not stated | Original source [S04] PDF physical/printed p.9, top wedding stressors |
F13 The report’s distribution of seating arrangements. Related logistics, not guest attendance. Published categories total 100%; exact item n and planning/completed split unavailable.
| Measure / group | Published result | Actual cohort or report period | Source |
|---|---|---|---|
| Allocated seating | 83% | 2026 report; mixed engaged/recently married respondents, exact fieldwork and guest-item periods not stated | Original source [S04] PDF physical/printed p.18, seating choices |
| Let guests choose | 9% | 2026 report; mixed engaged/recently married respondents, exact fieldwork and guest-item periods not stated | Original source [S04] PDF physical/printed p.18, seating choices |
| Stand-up celebration | 8% | 2026 report; mixed engaged/recently married respondents, exact fieldwork and guest-item periods not stated | Original source [S04] PDF physical/printed p.18, seating choices |
F17 Plans for extra events and multi-day wedding weekends. Related logistics percentages may overlap; do not add them or multiply guests by event days to estimate unique people. Exact item n unavailable.
| Measure / group | Published result | Actual cohort or report period | Source |
|---|---|---|---|
| At least one additional event | 37% | Couples getting married in 2026; planning-stage survey, exact fieldwork dates not provided | Original source [S06] The average cost of a wedding remains $36,000 section, extra-event bullet points |
| Full two-to-three-day wedding weekend | 18% | Couples getting married in 2026; planning-stage survey, exact fieldwork dates not provided | Original source [S06] The average cost of a wedding remains $36,000 section, extra-event bullet points |
The Easy Weddings seating categories total 100% in the report. Zola’s additional-event and wedding-weekend groups can overlap. A guest attending several events remains one unique person; neither an event share nor a multi-day plan can be multiplied into a unique guest total.
How to use guest-count statistics when planning
Use a benchmark to understand scale, then build the list around your own event. Keep a named-person list, a household/invitation list and separate event eligibility. Record invited, yes, no, pending and attended totals in different fields. Define how plus-ones and children are counted before comparing any totals.
For venue and catering decisions, confirm whether capacity and meal counts include the couple, wedding party, children, suppliers or evening-only guests. Record the contract’s deadline for the guaranteed count. A published mean cannot replace your guest replies or the venue’s actual limit. These are practical planning steps, rather than measured effects from the surveys above.
No verified turnout percentage is established here. An acceptance rate needs accepted people divided by invited people in the same eligible group. A no-show rate needs a defined attendance denominator, such as accepted guests. The selected guest means and planning gaps do not supply those matched counts.
Ten reproducible comparisons
The workbook reproduces these differences from stable observation IDs. Guest differences use guests; the final seating comparison uses percentage points. They reuse published observations and are not added to the 52-observation count.
| Comparison | First | Second | Difference | Qualification |
|---|---|---|---|---|
| US mean: 2025 minus 2024 | 117 | 116 | +1 guests | Source-published annual series; exact annual guest-item n unavailable. |
| US mean: 2025 minus 2019 | 117 | 131 | -14 guests | Descriptive difference between annual cohorts; no causal attribution. |
| US mean: 2020 minus 2019 | 66 | 131 | -65 guests | Pandemic-era cohort comparison, not a forecast of ordinary-year attendance. |
| 2025 US: Gen Z minus Gen X | 129 | 90 | +39 guests | Same article; selected subgroups with unknown answering n. |
| 2025 US: Midwest minus South and Southeast | 140 | 102 | +38 guests | Retains source’s combined regional label; unknown subgroup n. |
| 2025 US: hometown minus international destination | 123 | 69 | +54 guests | Different selected wedding groups; no attendance probability or causal travel effect. |
| 2025 US: July–September minus October–December | 123 | 112 | +11 guests | Calendar quarter blocks; no causal season/weather interpretation. |
| 2025 US: high spending minus low spending | 141 | 92 | +49 guests | Total spending bands, not marginal savings per invitation. |
| Easy Weddings 2026: expectation minus reality | 108 | 85 | +23 guests | Difference of published means matches the source-published gap; paired base unknown. Not a no-show rate. |
| Easy Weddings 2026: allocated minus self-chosen seating | 83% | 9% | +74 percentage points | Related logistics comparison; not a difference in guest counts. |
Common questions
Is 100 guests a small or large wedding?
There is no universal threshold in these sources. A headcount’s meaning depends on venue, community, country and the event being counted. A survey mean does not define a required wedding size.
What percentage of invited guests attend a wedding?
These sources do not establish a verified universal acceptance or attendance rate with matched invitations and attendance. Use your event’s replies and a clearly defined denominator.
Are destination wedding lists smaller?
The selected US and Australian sources report destination means, with the US groups lower than hometown weddings. The groups are self-selected and exact item n is unknown. The figures do not isolate a travel effect.
Does a 23-guest planning gap mean 23 people did not turn up?
No. Easy Weddings describes fewer invitations than originally planned. Its published means do not identify accepted guests who failed to attend.
Can the US, UK and Australian means be averaged?
A simple average would mix different populations, definitions and periods. No pooled worldwide estimate is calculated here.
Does this include Canada?
No independently verified Canadian national guest benchmark was selected. The US and UK values are not substituted for Canada.
Research method and limitations
MyLittleDesire compiled selected original publisher reports and articles. AI assisted retrieval, organization and drafting. This is a source-based compilation with descriptive arithmetic, not a new survey, respondent-level reanalysis, exhaustive systematic review, causal study or pooled estimate. Original selected tables, narratives and methods were checked.
The database contains 46 guest-unit observations, including 44 means and two source-published gaps, plus six related percentages. Source distribution is seven records from S01, 19 from S02, ten from S03, eight from S04, five from S05 and three from S06. Six source records come from three organizations. S01 and S02 share the same 2025 program. Repeated national figures are counted once; annual reports from the same publisher are not automatically independent samples.
- Selection: commercial platform/member and engaged-couple samples do not establish representative national averages for all weddings.
- Eligible bases: exact guest-item or subgroup n is not substituted with full-survey n. “More than” and “over” sample descriptions remain lower-bound wording rather than exact totals.
- Timing: wedding cohorts, publication dates, planning years and unknown fieldwork windows remain separate. Australia’s relative historical labels stay relative.
- Measurement: means, source-published gaps and logistics percentages retain their units. No median, uncertainty interval, invitation response rate or respondent count is reconstructed.
- Coverage: international results come from selected audiences; no Canada-specific benchmark or global pooled average is established. The UK public-page figures needing reconciled definitions remain withheld.
- Causality: subgroup differences do not identify effects of age, travel, weather, region or spending.
Original sources and withheld records
- S01. The Knot / The Knot Worldwide. 2026 Real Weddings Study: Data Read-Out. Publication: 2026-02-18 release; landing page updated 2026-02-17. Actual period: 2025 completed weddings; source-published historical series 2019–2025. Main 2025 newlywed survey n=10,474. Guest-count answering n and historical annual answering n are not specified in the selected table. Method: Email invitations to The Knot/WeddingWire membership throughout 2025. Main newlywed cohort married January 1–December 31, 2025. Report also incorporates ad hoc studies. Nonprobability platform-member sample; source-published historical series retained. Mean, not median. No exact guest-item n or harmonized annual sample details in the historical table. Not a national probability sample. Shared 2025 program with S02; the 2025 national mean is counted only once. Exact treatment of children, vendors and the wedding party is not established by the selected table. Supporting records: record 1, record 2.
- S02. The Knot / The Knot Worldwide. This Is the Average Wedding Guest List Size in the US. Publication: 2026-02-18 update. Actual period: 2025 weddings; article published in 2026. Main study n=10,474 couples. Exact subgroup and item answering n unavailable; article also notes ad hoc studies. Do not assign 10,474 to every subgroup. Method: Publisher analysis accompanying the 2026 Real Weddings Study. Main study recruited adult members of The Knot/WeddingWire by email during 2025; additional ad hoc studies acknowledged. Subgroup means transcribed from the original publisher article. Same main program as S01, not an independent replication. Regional definitions and exact item/subgroup bases are not supplied beside the values. Associations by generation, region, quarter, location and spending do not establish causation. Middle spending-band mean is approximate in the source.
- S03. The Knot Worldwide. 2025 Global Wedding Report. Publication: 2025-08-13 article; 2025-08-14 press release. Actual period: 2024 newlyweds; exact interview window not independently specified. Overall n=33,174: 16,956 US and 16,218 international. Exact country, generation and guest-item answering n unavailable. Method: Social-media and email recruitment from the publisher’s platforms in eight markets. Report includes additional ad hoc/behavioral sources; only identified guest-count chart and US generation narrative retained here. Chart read directly from publisher-hosted image. Nonprobability member/platform sample. Country cultures, event definitions and selection differ. Do not pool countries, infer national probability estimates or use overall n as a country denominator. The US mean of 116 duplicates S01’s 2024 point and is not recounted. Supporting records: record 1, record 2.
- S04. Easy Weddings. 2026 Australian Wedding Industry Report. Publication: 2026 report; exact publication day not stated. Actual period: 2026 report; mixed engaged/recently married respondents, exact fieldwork and guest-item periods not stated. More than 4,200 couples and 540 businesses, plus marketplace/Instagram inputs. Exact couple total, guest-item n, paired expectation/reality base and destination subgroup n unavailable. Method: Original annual industry report using engaged/recently married surveys, business research, marketplace data and Instagram community input. Selected guest-list means, source-published gap, stress and seating aggregates are retained separately. Report-wide inputs are not every item’s denominator. Expectation/reality wording is not a verified matched RSVP-versus-attendance measure. The source says couples invite fewer than planned. No no-show or acceptance rate inferred. Destination includes interstate/overseas; comparison with overall mean is descriptive only. Supporting records: record 1.
- S05. Easy Weddings. The Future of Weddings: 2025 Industry Insights. Publication: 2025-02-06 update. Actual period: 2025 report; source-relative “now”, “last year”, “year before” and “pre-COVID” labels. More than 4,000 couples and 800 businesses overall. Exact couple count, guest-item n and timing for the historical guest means unavailable. Method: Original publisher’s article presenting its annual report insights. Historical guest-count labels preserved exactly as relative labels; no unsupported mapping to calendar wedding years. Not a harmonized calendar-year series. “28 fewer than would like” is a source-published ideal-versus-reported gap, not a response or attendance rate. It does not identify the reason for every removed invitation. Sample overlap and year-specific guest bases are unspecified.
- S06. Zola. 2026 Wedding Trends: Zola’s First Look Report. Publication: 2026-10-16 update. Actual period: Couples getting married in 2026; planning-stage survey, exact fieldwork dates not provided. Over 11,500 couples overall. Exact total and guest-count/event-item answering n unavailable. Method: Publisher’s annual engaged-couple survey. Planning-stage mean guest list and related additional-event/weekend percentages selected from original report page. Intentions from a selected engaged audience, not a completed 2026 national attendance estimate. Extra-event and wedding-weekend percentages can overlap and cannot be summed. Multiple days do not multiply the number of unique guests.
Checked records not used for numerical observations
- R01. Bridebook. UK Wedding Report 2026 public page. Public headline guest metrics checked; 7,000+ mixed newly married/planning respondents reported. The page presents 80 guests and separate ceremony/evening figures whose populations/definitions are not reconciled on the checked page. Selected guest metrics and the 11% change are withheld pending full definitions and bases. Different populations could explain the figures; no definitive error is asserted.
- R02. The Wedding Report. 2025 Average Guest Count by State / methodology. State/DC table and proprietary mixed-source methodology checked. The method blends behavioral and survey inputs, including before/after wedding responses. Item/state-level guest bases and model comparability were not established. No state observations imported or added to the count; no comparison with unadjusted platform survey means.
How to cite this resource
MyLittleDesire. Wedding Guest Count Statistics 2027. https://mylittledesire.com/wedding-guest-count-statistics/. When quoting a value, also name its original publisher, population, measure and actual period.