In Zola’s 2025 wedding-planning cohort, 52% selected stressful and 49% selected overwhelming as words describing the process. The same survey also reports excitement and enjoyment. These feelings can overlap. A separate 2026 report identifies the gap between budget and online inspiration as a leading source of pressure, while dress-shopping research highlights its own distinct concerns. Zola [S02]; Zola [S01]; wed2b [S06].
This resource collects 65 published percentage observations in 21 groups, four charts and ten reproducible comparisons. Eight numerical source records come from five publisher labels. Several categories share a question, and three records are annual Zola cohorts. They are not 65 independent studies. Each table retains the actual period, eligible audience and available question base.
52%
60%
Selected stressful as a planning descriptor.Zola 2025 wedding cohort; exact item n unavailable. Zola [S02]
Identified the actual-budget versus online-inspiration gap as leading stressor.Zola 2026 wedding cohort; exact item n unavailable. Zola [S01]
24%
56.3%
Budget appeared as the leading stressor in the top-five list.Easy Weddings 2026 Australian report; exact item n unavailable. Easy Weddings [S04]
Named body-confidence concerns in dress-shopping stress multiple answers allowed. wed2b [S06]
What do wedding planning stress statistics measure?
A stress descriptor, an unexpected task and a shopping frustration answer different questions. Their percentages are useful when the wording stays attached. Selecting overwhelming does not tell us the intensity, duration or clinical significance of the feeling. Naming a budget as a stressor does not establish that every respondent exceeded it.
| Measure | What it describes | Interpretation limit |
|---|---|---|
| Planning descriptor | A word chosen to describe an experience | Several feelings can coexist; no diagnostic threshold |
| Unpreparedness | A task or demand respondents did not expect | Not necessarily the cause of severe distress |
| Pressure or added stress | A self-report about a person, role or platform | Respondent attribution does not prove causation |
| Workload split | Who reports doing planning work | Groups and measures may have different bases |
| Dress-shopping feeling | A purchase-specific experience | Cannot stand in for all wedding planning |
| Retrospective regret | How past respondents now view a decision | Not a prediction of current couples’ outcomes |
| Venue frustration | A particular service interaction | Does not measure overall mental health |
Also Read:-
Micro Wedding Elopement Statistics 2027
Destination Wedding Statistics 2027
AI Wedding Planning Statistics 2027
Engagement Ring Buying Statistics 2027
Wedding Guest Count Statistics 2027
How common are stress and overwhelm during planning?
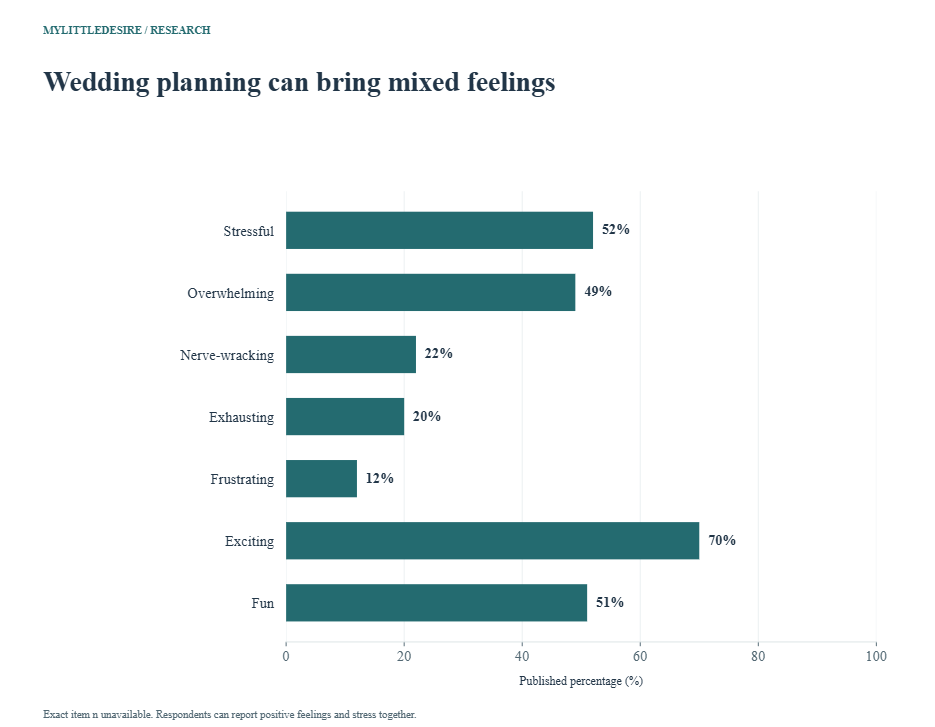
F01 Selected words chosen by Zola’s 2025 planning cohort. Overlapping descriptors; a respondent can feel excited and stressed. Not a diagnosis or complete list; do not add into an overall stress rate.
| Measure / response | Published result | Actual period and question base | Source |
|---|---|---|---|
| Chose stressful | 52% | Couples planning 2025 weddings; exact fieldwork dates not supplied Exact item n unavailable | Original source [S02] The Planning Process, words describing wedding planning |
| Chose overwhelming | 49% | Couples planning 2025 weddings; exact fieldwork dates not supplied Exact item n unavailable | Original source [S02] The Planning Process, words describing wedding planning |
| Chose nerve-wracking | 22% | Couples planning 2025 weddings; exact fieldwork dates not supplied Exact item n unavailable | Original source [S02] The Planning Process, words describing wedding planning |
| Chose exhausting | 20% | Couples planning 2025 weddings; exact fieldwork dates not supplied Exact item n unavailable | Original source [S02] The Planning Process, words describing wedding planning |
| Chose frustrating | 12% | Couples planning 2025 weddings; exact fieldwork dates not supplied Exact item n unavailable | Original source [S02] The Planning Process, words describing wedding planning |
| Chose exciting | 70% | Couples planning 2025 weddings; exact fieldwork dates not supplied Exact item n unavailable | Original source [S02] The Planning Process, words describing wedding planning |
| Chose fun | 51% | Couples planning 2025 weddings; exact fieldwork dates not supplied Exact item n unavailable | Original source [S02] The Planning Process, words describing wedding planning |
F02 Five historical pressure-related descriptors from the 2024 wedding cohort. Overlapping descriptors; separate cohort and unknown item n. No harmonized annual trend or new significance test. Published decimal precision retained.
| Measure / response | Published result | Actual period and question base | Source |
|---|---|---|---|
| Chose stressful | 52.50% | Couples planning 2024 weddings; exact fieldwork dates not supplied Exact item n unavailable | Original source [S03] Words used to describe wedding planning, before Pain Points section |
| Chose overwhelming | 46.64% | Couples planning 2024 weddings; exact fieldwork dates not supplied Exact item n unavailable | Original source [S03] Words used to describe wedding planning, before Pain Points section |
| Chose exhausting | 19.08% | Couples planning 2024 weddings; exact fieldwork dates not supplied Exact item n unavailable | Original source [S03] Words used to describe wedding planning, before Pain Points section |
| Chose nerve-wracking | 18.65% | Couples planning 2024 weddings; exact fieldwork dates not supplied Exact item n unavailable | Original source [S03] Words used to describe wedding planning, before Pain Points section |
| Chose frustrating | 11.46% | Couples planning 2024 weddings; exact fieldwork dates not supplied Exact item n unavailable | Original source [S03] Words used to describe wedding planning, before Pain Points section |
The earlier cohort supplies historical context. Comparing headline percentages alone would overlook question bases, fieldwork timing and cohort composition. This article therefore presents those results as dated observations, without declaring that wedding stress is rising or falling. The more useful immediate distinction is that difficult and positive feelings do not form opposite, exclusive groups.
How prepared do couples feel for the decisions?
F03 All four published responses about preparedness. Printed values total 101% because of rounding. No normalization, reconstructed raw counts or stress diagnosis.
| Measure / response | Published result | Actual period and question base | Source |
|---|---|---|---|
| A little prepared; needed research | 37% | Couples planning 2025 weddings; exact fieldwork dates not supplied Exact item n unavailable | Original source [S02] The Planning Process, preparedness before starting |
| Pretty prepared; some surprises | 35% | Couples planning 2025 weddings; exact fieldwork dates not supplied Exact item n unavailable | Original source [S02] The Planning Process, preparedness before starting |
| Not at all prepared | 23% | Couples planning 2025 weddings; exact fieldwork dates not supplied Exact item n unavailable | Original source [S02] The Planning Process, preparedness before starting |
| Super prepared; nothing surprising | 6% | Couples planning 2025 weddings; exact fieldwork dates not supplied Exact item n unavailable | Original source [S02] The Planning Process, preparedness before starting |
F04 Selected answers to the question about what respondents did not feel prepared for. Conditional eligibility/routing and exact n unavailable. These are unpreparedness selections, not proof that every named task caused clinical stress.
| Measure / response | Published result | Actual period and question base | Source |
|---|---|---|---|
| Number of decisions | 71% | Couples planning 2025 weddings; exact fieldwork dates not supplied Exact item n unavailable | Original source [S02] The Planning Process, what did you not feel prepared for |
| Managing a budget | 55% | Couples planning 2025 weddings; exact fieldwork dates not supplied Exact item n unavailable | Original source [S02] The Planning Process, what did you not feel prepared for |
| Managing the guest list | 49% | Couples planning 2025 weddings; exact fieldwork dates not supplied Exact item n unavailable | Original source [S02] The Planning Process, what did you not feel prepared for |
The preparedness question and the list of unexpected demands are separate items. A person can feel broadly prepared yet underestimate the number of decisions. For a planning checklist, the editorial implication is to distinguish decisions still to be made from tasks already assigned. These surveys do not test whether a particular checklist reduces stress.
How do family and relationships feature in planning pressure?
F05 Selected parties named as adding stress or making planning harder. Overlapping nominations, exact item n unknown. A party can provide support and add pressure; attribution is self-report, not a causal experiment.
| Measure / response | Published result | Actual period and question base | Source |
|---|---|---|---|
| Parents or guardians | 43% | Couples planning 2025 weddings; exact fieldwork dates not supplied Exact item n unavailable | Original source [S02] The Planning Process, parties causing more stress or difficulty |
| Other family members | 35% | Couples planning 2025 weddings; exact fieldwork dates not supplied Exact item n unavailable | Original source [S02] The Planning Process, parties causing more stress or difficulty |
| Partner | 19% | Couples planning 2025 weddings; exact fieldwork dates not supplied Exact item n unavailable | Original source [S02] The Planning Process, parties causing more stress or difficulty |
| Social media | 17% | Couples planning 2025 weddings; exact fieldwork dates not supplied Exact item n unavailable | Original source [S02] The Planning Process, parties causing more stress or difficulty |
F10 Two selected relationship responses. Selected responses total 84%, not the complete distribution. No residual assumed to mean harmed relationships. Self-report does not establish planning improves marriage outcomes.
| Measure / response | Published result | Actual period and question base | Source |
|---|---|---|---|
| Planning brought the couple closer | 44% | Couples planning 2026 weddings; exact fieldwork dates not supplied Exact item n unavailable | Original source [S01] Couples are prioritizing mental wellbeing and relationship health |
| Relationship remained steady and loving | 40% | Couples planning 2026 weddings; exact fieldwork dates not supplied Exact item n unavailable | Original source [S01] Couples are prioritizing mental wellbeing and relationship health |
A source of support can also create difficult decisions. The selected family nominations do not mean those relationships are uniformly negative. Similarly, the two positive relationship responses are only a partial list. Their unreported remainder cannot be labelled relationship damage, and the results do not forecast relationship quality after marriage.
How does the budget–inspiration gap affect planning?
F06 Couples identifying the gap between actual budget and online inspiration as their leading planning stressor. Exact item n and full instrument unavailable. The source’s ambiguous up-12% comparison is excluded; no causal media effect.
| Measure / response | Published result | Actual period and question base | Source |
|---|---|---|---|
| Actual budget versus online inspiration is leading stressor | 60% | Couples planning 2026 weddings; exact fieldwork dates not supplied Exact item n unavailable | Original source [S01] The budget v. inspiration gap continues to widen |
F12 Reporting a larger budget or shifted funds for something seen online. Combined increase-or-reallocation measure. Not solely new spend, overspending, debt or diagnosed financial stress; no causal amount estimated.
| Measure / response | Published result | Actual period and question base | Source |
|---|---|---|---|
| Increased budget or shifted money after online inspiration | 48% | Couples planning 2026 weddings; exact fieldwork dates not supplied Exact item n unavailable | Original source [S01] Couples are increasing budgets to achieve their online vision |
The inspiration-gap result describes a perceived mismatch; the budget-response result combines increasing a budget with moving existing money between categories. The latter should keep both parts of its wording. Neither supplies a measured dollar cost of social media, a debt rate or proof of financial harm. For distinctions between actual spending and planned budgets, see our wedding cost and budget statistics.
How do social media pressures differ by generation?
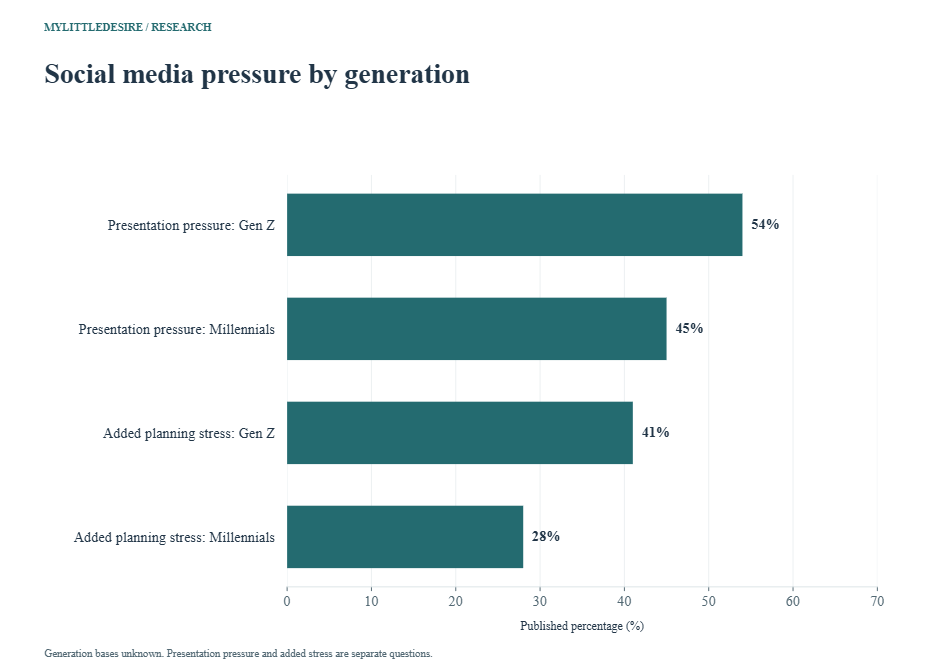
F07 Generation-specific responses on social presentation pressure. Different generation groups with unpublished bases. Cross-sectional contrast, not a causal generation effect or all-couple stress prevalence.
| Measure / response | Published result | Actual period and question base | Source |
|---|---|---|---|
| Gen Z: social-media-worthy wedding pressure | 54% | Couples planning 2026 weddings; exact fieldwork dates not supplied Exact item n unavailable | Original source [S01] Couples are increasing budgets to achieve their online vision |
| Millennials: social-media-worthy wedding pressure | 45% | Couples planning 2026 weddings; exact fieldwork dates not supplied Exact item n unavailable | Original source [S01] Couples are increasing budgets to achieve their online vision |
F08 Generation-specific self-reports about social media and stress. Unknown subgroup bases and question wording beyond publisher summary. Association and respondent attribution, not evidence of causation.
| Measure / response | Published result | Actual period and question base | Source |
|---|---|---|---|
| Gen Z: social media added planning stress | 41% | Couples planning 2026 weddings; exact fieldwork dates not supplied Exact item n unavailable | Original source [S01] Social media drives wedding decisions, stress paragraph |
| Millennials: social media added planning stress | 28% | Couples planning 2026 weddings; exact fieldwork dates not supplied Exact item n unavailable | Original source [S01] Social media drives wedding decisions, stress paragraph |
The report separates wanting the celebration to look shareable from reporting added stress. The generation comparisons in the workbook stay within each question. They describe different respondent groups at one time; they do not show that belonging to a generation, or using a platform, caused the difference.
Who carries the planning workload?
F09 Equal-split responses by relationship type and women’s majority-load report. Different eligible groups and question measures. The 84% women result is not a complement of the 13% equal split. No 71-point gap or overall gender effect inferred.
| Measure / response | Published result | Actual period and question base | Source |
|---|---|---|---|
| Opposite-sex couples: equal planning split | 13% | Couples planning 2026 weddings; exact fieldwork dates not supplied Exact item n unavailable | Original source [S01] Couples are prioritizing mental wellbeing and relationship health, workload paragraph |
| Women in opposite-sex couples: carrying most planning | 84% | Couples planning 2026 weddings; exact fieldwork dates not supplied Exact item n unavailable | Original source [S01] Couples are prioritizing mental wellbeing and relationship health, workload paragraph |
| Same-sex couples: equal planning split | 29% | Couples planning 2026 weddings; exact fieldwork dates not supplied Exact item n unavailable | Original source [S01] Couples are prioritizing mental wellbeing and relationship health, workload paragraph |
F11 Primary planners selecting a customary-role explanation. Restricted primary-planner audience with unpublished item n. This is a reported explanation, not proof that workload is inevitable or desirable.
| Measure / response | Published result | Actual period and question base | Source |
|---|---|---|---|
| Primary planners: unequal load is just how things are | 60% | Couples planning 2026 weddings; exact fieldwork dates not supplied Exact item n unavailable | Original source [S01] Relationship health, reasons primary planners give for lopsided load |
The workload figures use different eligible audiences. A percentage of women carrying most of the work cannot be treated as the complement of the percentage of opposite-sex couples sharing equally. The primary-planner explanation is narrower again. In practice, readers can use these distinctions to discuss who owns decisions, tracking and follow-up, while keeping the survey results separate from an evaluation of their own relationship.
What do Australian planning-stressor reports show?
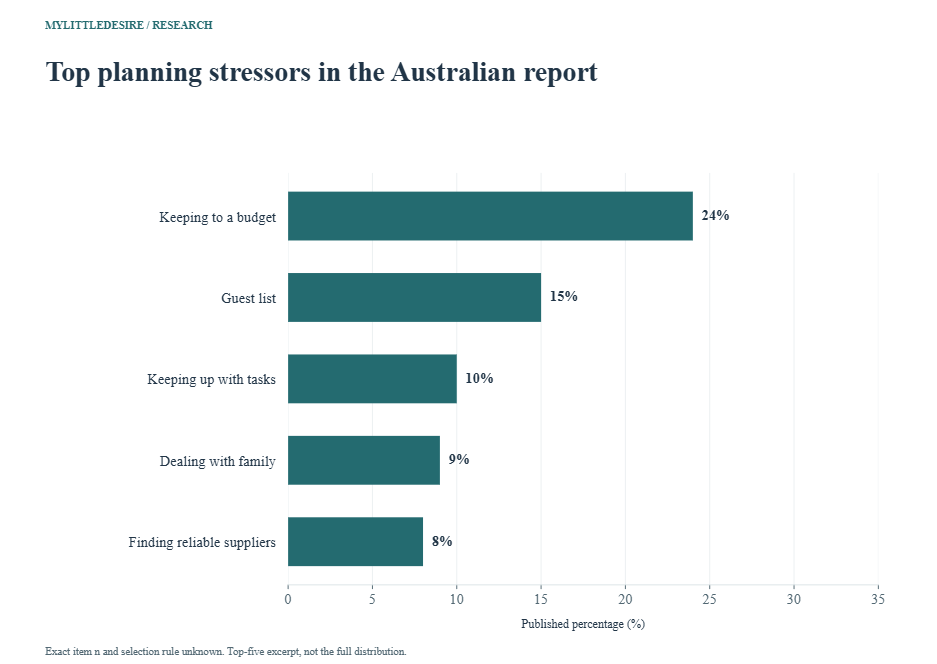
F13 All five explicitly printed top-stressor results. Top-five excerpt with unknown selection rule and exact item n. Not a complete distribution; no residual category, all-stress total or significant annual trend.
| Measure / response | Published result | Actual period and question base | Source |
|---|---|---|---|
| Keeping to a budget | 24% | 2026 report research with engaged/recently married audience; exact stressor field dates unavailable Exact item n unavailable | Original source [S04] Original PDF physical/printed p.9, Top 5 Stressors |
| Guest list | 15% | 2026 report research with engaged/recently married audience; exact stressor field dates unavailable Exact item n unavailable | Original source [S04] Original PDF physical/printed p.9, Top 5 Stressors |
| Keeping up with tasks | 10% | 2026 report research with engaged/recently married audience; exact stressor field dates unavailable Exact item n unavailable | Original source [S04] Original PDF physical/printed p.9, Top 5 Stressors |
| Dealing with family | 9% | 2026 report research with engaged/recently married audience; exact stressor field dates unavailable Exact item n unavailable | Original source [S04] Original PDF physical/printed p.9, Top 5 Stressors |
| Finding reliable suppliers | 8% | 2026 report research with engaged/recently married audience; exact stressor field dates unavailable Exact item n unavailable | Original source [S04] Original PDF physical/printed p.9, Top 5 Stressors |
F14 All five explicitly printed top-stressor results. Top-five excerpt with unknown selection rule and exact item n. Not a complete distribution; no residual category, all-stress total or significant annual trend.
| Measure / response | Published result | Actual period and question base | Source |
|---|---|---|---|
| Keeping to a budget | 25% | 2025-titled research, planning audience including 2025 and beyond; exact item field dates unavailable Exact item n unavailable | Original source [S05] Original PDF physical/printed p.7, Top 5 Stressors |
| Guest list | 15% | 2025-titled research, planning audience including 2025 and beyond; exact item field dates unavailable Exact item n unavailable | Original source [S05] Original PDF physical/printed p.7, Top 5 Stressors |
| Keeping up with tasks | 10% | 2025-titled research, planning audience including 2025 and beyond; exact item field dates unavailable Exact item n unavailable | Original source [S05] Original PDF physical/printed p.7, Top 5 Stressors |
| Dealing with family | 8% | 2025-titled research, planning audience including 2025 and beyond; exact item field dates unavailable Exact item n unavailable | Original source [S05] Original PDF physical/printed p.7, Top 5 Stressors |
| Finding reliable suppliers | 10% | 2025-titled research, planning audience including 2025 and beyond; exact item field dates unavailable Exact item n unavailable | Original source [S05] Original PDF physical/printed p.7, Top 5 Stressors |
The two annual reports provide top-five lists with the original percentages. They do not publish the full selection rule or exact valid question bases in the selected pages. The list’s remainder is unknown, so subtracting the five values from a total would not establish a no-stress category. Small changes between editions are not tested here as a statistical trend.
What do dress-shopping stress statistics show?
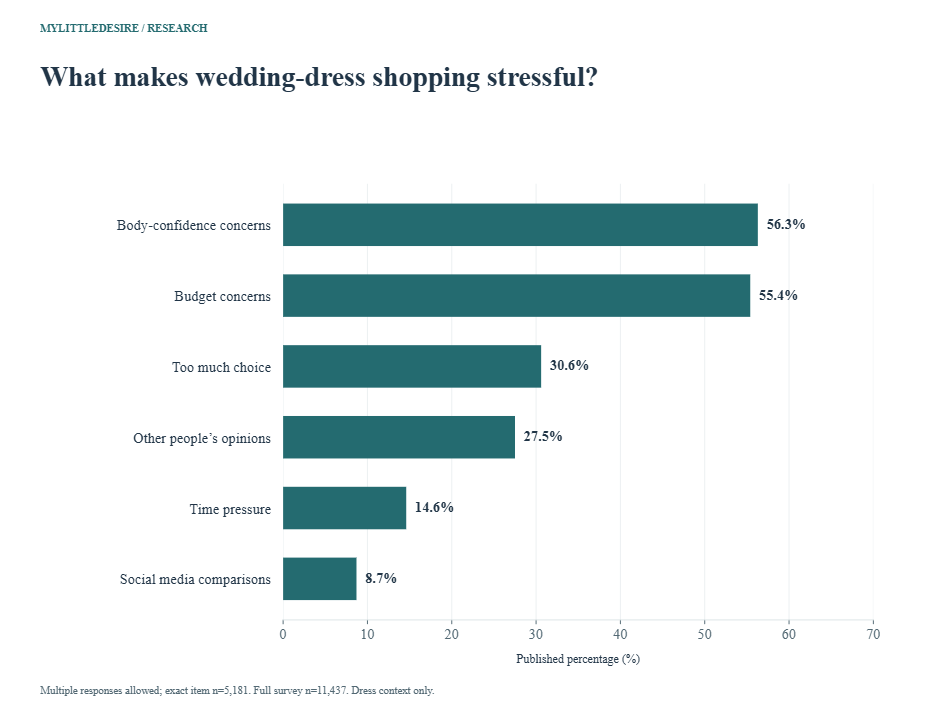
F15 Six published dress-stress causes; respondents could choose multiple answers. Exact item n=5,181, distinct from full 11,437. Dress-shopping context, not all wedding stress. Overlapping categories must not be summed.
| Measure / response | Published result | Actual period and question base | Source |
|---|---|---|---|
| Body-confidence concerns | 56.3% | 2026 Wedding Survey; exact fieldwork dates unavailable Exact item n=5,181 | Original source [S06] Cause-of-dress-stress table and n=5,181 footnote |
| Budget concerns | 55.4% | 2026 Wedding Survey; exact fieldwork dates unavailable Exact item n=5,181 | Original source [S06] Cause-of-dress-stress table and n=5,181 footnote |
| Too much choice | 30.6% | 2026 Wedding Survey; exact fieldwork dates unavailable Exact item n=5,181 | Original source [S06] Cause-of-dress-stress table and n=5,181 footnote |
| Other people’s opinions | 27.5% | 2026 Wedding Survey; exact fieldwork dates unavailable Exact item n=5,181 | Original source [S06] Cause-of-dress-stress table and n=5,181 footnote |
| Time pressure | 14.6% | 2026 Wedding Survey; exact fieldwork dates unavailable Exact item n=5,181 | Original source [S06] Cause-of-dress-stress table and n=5,181 footnote |
| Social media comparisons | 8.7% | 2026 Wedding Survey; exact fieldwork dates unavailable Exact item n=5,181 | Original source [S06] Cause-of-dress-stress table and n=5,181 footnote |
F16 Two selected emotional responses to dress spending. Exact item n unavailable; selected responses do not form a complete distribution. Anxiety/stress/guilt is a combined response, not a validated anxiety diagnosis.
| Measure / response | Published result | Actual period and question base | Source |
|---|---|---|---|
| Dress budget prompted anxiety, stress or guilt | 36.6% | 2026 Wedding Survey; exact fieldwork dates unavailable Exact item n unavailable | Original source [S06] Key takeaways, emotional response to dress budget |
| Felt confident and comfortable about dress budget | 14% | 2026 Wedding Survey; exact fieldwork dates unavailable Exact item n unavailable | Original source [S06] Key takeaways, emotional response to dress budget |
F17 Overwhelm and warm welcome in the boutique-shopping context. Exact item bases not supplied. Different feelings can coexist; do not subtract to estimate a group or claim staff caused a reduction in distress.
| Measure / response | Published result | Actual period and question base | Source |
|---|---|---|---|
| Felt overwhelmed visiting bridal boutiques | 30.8% | 2026 Wedding Survey; exact fieldwork dates unavailable Exact item n unavailable | Original source [S06] Key takeaways, boutique experience |
| Felt warmly welcomed by boutique staff | 75.4% | 2026 Wedding Survey; exact fieldwork dates unavailable Exact item n unavailable | Original source [S06] Key takeaways, boutique experience |
F18 Two different indicators of dress-related outside pressure. Other-people pressure is rating at least 3 out of 5, not any pressure; social-media difficulty is a separate question. Unknown item bases; no comparison between their rates.
| Measure / response | Published result | Actual period and question base | Source |
|---|---|---|---|
| Other people’s dress expectations: pressure rated 3–5 of 5 | 46.8% | 2026 Wedding Survey; exact fieldwork dates unavailable Exact item n unavailable | Original source [S06] Key takeaways and social-media comparison FAQ |
| Social media made choosing a dress harder | 27.4% | 2026 Wedding Survey; exact fieldwork dates unavailable Exact item n unavailable | Original source [S06] Key takeaways and social-media comparison FAQ |
The dress-stress table is unusual in supplying an exact question base, which is smaller than the full survey. Other dress and boutique items do not supply that same verified denominator. The pressure-rating item also has a specific threshold: a score of at least three on a five-point scale. It should not be renamed any pressure or severe pressure.
Source-presentation qualification: An earlier wed2b research overview uses different rounded body-confidence and positive-shopping figures. Their item/base alignment is not established here. This resource uses one selected article, preserves its explicit dress-stress base and treats the companion page as context rather than another independent survey. wed2b [S06].
What do retrospective stress and regret reports show?
F19 Four selected stress-related results in a survey of people married within ten years. Full n=500 people; item n and selection rule unavailable. Not solely 2025 weddings or an exclusive distribution; recall may affect responses.
| Measure / response | Published result | Actual period and question base | Source |
|---|---|---|---|
| Making the day perfect | 49% | Survey published August 2025; respondents married within prior ten years; exact field dates unavailable Exact item n unavailable | Original source [S07] What Brits find most stressful about weddings |
| Managing the budget | 48% | Survey published August 2025; respondents married within prior ten years; exact field dates unavailable Exact item n unavailable | Original source [S07] What Brits find most stressful about weddings |
| Guest-list decisions | 30% | Survey published August 2025; respondents married within prior ten years; exact field dates unavailable Exact item n unavailable | Original source [S07] What Brits find most stressful about weddings |
| Pressure to please everyone | 36% | Survey published August 2025; respondents married within prior ten years; exact field dates unavailable Exact item n unavailable | Original source [S07] What Brits find most stressful about weddings |
F20 Three selected retrospective regrets. Exact item n unknown; overlapping regrets possible. Not evidence that a specific stressor caused later regret or a prediction for current couples.
| Measure / response | Published result | Actual period and question base | Source |
|---|---|---|---|
| Spending so much time worrying | 37% | Survey published August 2025; respondents married within prior ten years; exact field dates unavailable Exact item n unavailable | Original source [S07] What Brits find most stressful, retrospective regrets |
| Letting other people influence the plans | 31% | Survey published August 2025; respondents married within prior ten years; exact field dates unavailable Exact item n unavailable | Original source [S07] What Brits find most stressful, retrospective regrets |
| Overspending | 28% | Survey published August 2025; respondents married within prior ten years; exact field dates unavailable Exact item n unavailable | Original source [S07] What Brits find most stressful, retrospective regrets |
thortful describes a survey of people who married within the prior decade. Its results therefore include a broad retrospective window, rather than only weddings held in the report year. The regret results describe hindsight. They do not establish that one particular pressure caused overspending or that current couples will feel the same way.
How often do venue communications cause frustration?
F21 Overall headline about venue communication early in the journey. Question-specific service frustration, not overall stress prevalence or diagnosed anxiety. Exact valid item n unavailable; no causal or national extrapolation.
| Measure / response | Published result | Actual period and question base | Source |
|---|---|---|---|
| Frustrated with venue responses at the start | 81% | 2026 report with engaged/newly married audience; exact venue-frustration field dates unavailable Exact item n unavailable | Original source [S08] Original UK Wedding Report 2026 PDF physical/printed p.21 |
Bridebook’s headline concerns early venue responses. The report discusses unanswered questions, response style, access to information and speed as possible sources of frustration. The selected overall figure should remain a communication finding; it is not a substitute for asking how stressed a couple feels about the whole planning process. Bridebook [S08].
How can readers use these findings in their own planning?
The following are editorial questions prompted by the research, rather than interventions tested in these surveys. They can help turn a broad feeling of pressure into a concrete planning discussion.
| Area | Question to discuss | What the evidence can support |
|---|---|---|
| Budget and inspiration | Does this idea fit current quotes and the amount available? | Distinguish an inspiration gap from actual overspending |
| Decision volume | Which decisions need action this week, and who owns them? | Separate unpreparedness from completed task volume |
| Family involvement | Whose input is useful, and who makes the final choice? | Recognize self-reported pressure without blaming all relatives |
| Planning roles | Who remembers deadlines and follows up as well as completing tasks? | Workload reports prompt discussion; they do not assess your partner |
| Dress shopping | Which concern is specific to the purchase or visit? | Keep body, budget, choice and outside-pressure questions distinct |
| Venue replies | Which price, availability or visit question remains unanswered? | Treat communication frustration as a specific service issue |
Ten reproducible descriptive comparisons
These differences reuse the published observations. Each is first value minus second in percentage points, not relative growth. Matching units and measure types are required. A difference between overlapping responses does not reveal how many unique people selected only one, and none is a causal effect.
| Comparison | Published inputs | Difference | Interpretation |
|---|---|---|---|
| Stressful minus overwhelming descriptors | 52% − 49% | 3 percentage points | Overlapping feelings in one cohort; difference does not identify exclusive respondent groups. |
| Exciting minus stressful descriptors | 70% − 52% | 18 percentage points | Both feelings may be selected by the same person; no positivity-versus-stress binary. |
| A little prepared minus not at all prepared | 37% − 23% | 14 percentage points | Same rounded preparedness item; the four categories total 101% as published. |
| Decision volume minus budget management surprise | 71% − 55% | 16 percentage points | Same unpreparedness item; routing and exact item n unknown. |
| Parents minus partner as added-stress source | 43% − 19% | 24 percentage points | Overlapping self-reported nominations; no experimental causal effect. |
| Social presentation pressure: Gen Z minus Millennials | 54% − 45% | 9 percentage points | Cross-sectional generation contrast; unknown group bases, no significance test. |
| Social-media-added stress: Gen Z minus Millennials | 41% − 28% | 13 percentage points | Different generation groups in one cohort; respondent attribution, not a causal media effect. |
| Dress stress: body confidence minus budget | 56.3% − 55.4% | 0.9 percentage points | Same multiple-response question, exact item n=5,181; difference does not measure unique people. |
| Australian budget minus guest-list stressor, 2026 | 24% − 15% | 9 percentage points | Top-five results; unknown selection rule and valid question n. |
| Retrospective guest-list minus perfection stressor | 30% − 49% | -19 percentage points | Full survey of 500 people married within ten years; item n/selection rule unavailable. |
Common questions
What percentage of couples find wedding planning stressful?
Zola’s 2025 wedding cohort reports 52% selecting stressful as a descriptor. That is an attributed survey response with an unknown exact valid item base, rather than a universal rate. Different studies use different questions and populations.
Can couples enjoy planning and feel overwhelmed?
Yes, the selected descriptor questions allow feelings to overlap. Positive and difficult words must not be treated as a single either-or distribution.
What is the biggest wedding-planning stressor?
Budget-related concerns lead the selected Zola and Easy Weddings summaries, but their question wording differs. Zola asks about the inspiration gap, while the Australian top-five list names keeping to a budget. Dress-shopping research asks a narrower purchase-specific question.
Do these figures diagnose anxiety or burnout?
No. The selected findings are published feelings, pressures, task experiences and service frustrations. They are not clinical prevalence estimates or validated diagnostic results.
Do dress-shopping results apply to the entire wedding?
No. The dress-stress table has a specific audience and exact item base of 5,181. Its multiple-response causes remain separate from all-planning descriptors and other dress questions.
Research method and limitations
The collection has 65 percentage observations in 21 groups, eight numerical records and five publisher labels. Zola supplies 35 observations across three annual wedding cohorts; Easy Weddings supplies ten across two annual reports; wed2b supplies twelve; thortful seven; Bridebook one. Those concentrations and shared questions prevent treating the observations as independent studies. Charts and comparisons add no new survey observations.
Original publisher reports and question lists were checked. Easy Weddings physical/printed pages 9 (2026) and 7 (2025), and Bridebook page 21, were rendered and visually inspected. wed2b’s original indexed table and sample note were rechecked when direct access later met a client challenge. Six dress-cause observations have the explicit question n=5,181. The other 59 exact item bases remain unavailable and blank in the data. Full survey samples stay separate.
All selected studies have commercial publishers. Recruitment, weighting, exact field dates and question bases are often incompletely disclosed. These findings are not asserted to be nationally representative or globally comparable. Selection favored directly relevant published numerical results, with question categories grouped and original precision retained. Source review is a check of published aggregates, not an independent audit of respondent records.
Excluded interpretations: A measured 2027 rate; pooled global prevalence; clinical diagnoses; sums of overlapping feelings; causal effects of social media or planning; an invented relationship-harm remainder; the ambiguous Zola up-12% change; incompatible workload subtractions; repaired source totals; and an annual stress trend based on separate cohorts. No original Canadian or Indian benchmark was verified in this selected set.
No original survey, respondent-level reanalysis, meta-analysis or new significance tests were conducted. This resource does not evaluate a treatment or planning intervention. Search metrics, traffic, editorial placements and backlinks were not measured.
Original sources and screened context
- S01. Zola. 2026 Wedding Trends: First Look Report. Actual period: Couples planning 2026 weddings; exact fieldwork dates not supplied. Exact bases for social-media, gender, relationship-type and primary-planner items not supplied. Do not assign the full lower bound to subgroups. Method: Original report sections on budget/inspiration, social pressure, relationship health and planning workload read. Source-specific eligible audiences retained. Commercial planning-platform research, not established national probability prevalence. Self-report and attitudes, not clinical diagnoses or causal effects. Source says budget gap is up 12% without clarifying relative versus percentage points; that change is excluded.
- S02. Zola. 2025 Wedding Trends: First Look Report Data Deep Dive. Actual period: Couples planning 2025 weddings; exact fieldwork dates not supplied. Question bases and any conditional routing are unavailable; unpreparedness results stay attached to that question. Method: Original question lists and printed percentages checked. Selected descriptors are overlapping feelings. All four preparedness categories retained and total 101% as printed. Commercial self-report, not a clinical scale or global prevalence. Selected lists are not complete distributions. The separate item labelled single biggest pain point has categories summing well above 100%; its full distribution is not used here.
- S03. Zola. 2024 Wedding Trends: First Look Report Data Deep Dive. Actual period: Couples planning 2024 weddings; exact fieldwork dates not supplied. Exact descriptor-item n unavailable; close-to total is approximate and not an item base. Method: Original planning-words question read; five selected pressure-related descriptors retain published two-decimal precision. Historical overlapping descriptors from a separate cohort. Update date is not fieldwork year. No harmonized year-on-year stress trend, significance test or exact respondent count inferred.
- S04. Easy Weddings. 2026 Australian Wedding Industry Report, top planning stressors. Official file path dated February 2026. Actual period: 2026 report research with engaged/recently married audience; exact stressor field dates unavailable. Exact stressor-item n unavailable. Business and social-community counts are not added to couple denominators. Method: Original PDF physical/printed p.9 visually inspected. All five explicitly printed top-stressor percentages read in correct order. Foreword p.2 describes mixed research inputs. Top-five excerpt, not full distribution or total share experiencing any stress. Selection rule and exact item base not printed; no residual invented or precise population prevalence asserted.
- S05. Easy Weddings. 2025 Australian Wedding Industry Report, top planning stressors. Original official file path dated October 2024. Actual period: 2025-titled research, planning audience including 2025 and beyond; exact item field dates unavailable. Exact top-stressor item n unavailable; report-wide couples total is not the valid item base. Method: Original PDF physical/printed p.7 visually inspected; all five printed stressor percentages transcribed. Foreword p.2 checked. Historical top-five results, not all categories. Report edition differs from exact fieldwork; independent annual samples/selection rules not fully described. No statistically established stress trend.
- S06. wed2b. Overwhelmed by wedding planning? What 11,437 brides told us. Displayed as 02|09|2026. Actual period: 2026 Wedding Survey; exact fieldwork dates unavailable. Six dress-stress causes have explicit item n=5,181, multiple responses allowed. Other selected item bases not supplied on checked material. Method: Original publisher article retrieved, with full table, sample footnote and numerical paragraphs. Direct retrieval subsequently met a client challenge; original indexed text independently rechecked. Companion research page describes UK and European audience. Retailer-owned, limited recruitment/weighting detail. Dress-shopping stress is narrower than wedding-planning stress overall. Earlier companion page reports different rounded body-confidence/positive-experience figures; do not merge or treat it as an independent study. Supporting records: record 1.
- S07. thortful. The 2025 wedding report. Respondents married within prior ten years; exact field dates unavailable. Full n=500; exact valid stressor and regret item bases not provided. Method: Original publisher article stress and retrospective-regret paragraphs read; only its own survey results included. Commercial retrospective self-report across a decade. Recruitment, weights and full questionnaire not published. Top-stressor selection rule unclear; percentages not summed or treated as one exclusive distribution. Regret association is not causal prediction.
- S08. Bridebook. UK Wedding Report 2026, venue communication frustrations. Publication: 2026 report edition; exact publication day not supplied. Actual period: 2026 report with engaged/newly married audience; exact venue-frustration field dates unavailable. Exact venue-response question n unavailable; approximate full report sample not assigned to it. Method: Original publicly linked PDF physical/printed p.21 rendered and visually checked. Only the explicitly printed overall headline is included. Specific service frustration, not overall planning stress or diagnosed anxiety. No venue ranking, causal relationship effect or unpublished subgroup counts inferred. Supporting records: record 1.
Supporting and screened context, without added observations
- R01. wed2b. Wedding dress shopping research overview. Describes UK/Europe bride research; gives 57% body-confidence and 73.8% positive-shopping figures in an earlier presentation. Do not count a second independent survey or merge with selected article’s 56.3% stress cause / 74.1% enjoyment presentation. Exact same-item/base alignment unavailable.
- R02. Zola. 2026 First Look, ambiguous change and mental-health population wording. Says budget–inspiration stressor is up 12%; nearby mental-health priority wording mentions Gen Z and 32% of couples. No relative-growth versus point-change assumption, or assignment of ambiguous 32% denominator. Neither included as an observation. Therapy and medication figures not used as stress diagnoses.
How to cite this resource
MyLittleDesire. Wedding Planning Stress Statistics 2027 https://mylittledesire.com/wedding-planning-stress-statistics/.