
The Knot’s 2026 Real Weddings Study reports state ceremony-and-reception means ranging from US$17,000 in Wyoming to US$57,000 in New Jersey for weddings held in 2025. Its state table excludes the engagement ring. These are published survey averages across different weddings, rather than the price of an identical wedding in each state. The Knot / The Knot Worldwide [S01].
This resource includes a complete 50-state mean-cost lookup, a separate table of 49 Zola state ranges, three national context values, four charts and ten reproducible comparisons. That is 102 published data records in four groups: each range counts once, with both endpoints retained. Three numerical documents come from two publisher labels; the two Knot documents share a research program.
50 states
US$57,000
Complete state means from one source and cohort.The Knot 2026 study of 2025 weddings. The Knot / The Knot Worldwide [S01]
Highest published state mean: New Jersey.Ceremony/reception, excluding engagement ring. The Knot / The Knot Worldwide [S01]
US$17,000
49 ranges
Lowest published state mean: Wyoming.Unknown exact state item base and precision. The Knot / The Knot Worldwide [S01]
Separate index/planning ranges, each counted once.Zola 2026 guide; North Dakota absent from its table. Zola [S03]
What do these state wedding-cost figures measure?
A state mean describes the weddings in a publisher’s research. It is not a required budget, a statewide price ceiling or a quote for one venue. A cost-index range is a different measure again. Keep the source, cohort, location, spending basket and statistic attached whenever citing a number.
| Measure | What the selected source supplies | What it does not establish |
|---|---|---|
| The Knot state mean | Reported ceremony/reception average in a source-labelled state | State median, minimum price, identical guest count or causal location premium |
| The Knot national mean / median | National summary measures in the web guide and PDF | An unweighted average of state means or a median for every state |
| Zola state range | Two published cost-index/planning endpoints for one state | Mean, confidence interval, percentile band or universal minimum and maximum |
| Full survey sample | Main study size across the research program | Valid state cost-item n or equal sample sizes across states |
Also Read:-
Wedding Planning Stress Statistics 2027
Micro Wedding Elopement Statistics 2027
Destination Wedding Statistics 2027
AI Wedding Planning Statistics 2027
Engagement Ring Buying Statistics 2027
What is the average wedding cost in every US state?
States appear alphabetically. Every mean below comes from The Knot’s original state table, attributed to its 2026 study of 2025 weddings. The main survey contains 10,474 couples, but the exact number answering the cost item in each state is not published in the selected material. The Knot / The Knot Worldwide [S01].
F01 Fifty source-labelled state ceremony/reception means in the 2026 study of 2025 weddings.
Engagement ring excluded; ceremony/reception spending, not venue hire alone. Exact state item bases and precision unavailable. Rounded numerical rankings are descriptive, not statistically significant differences or matched-wedding savings.
Which states have the highest reported wedding-cost means?
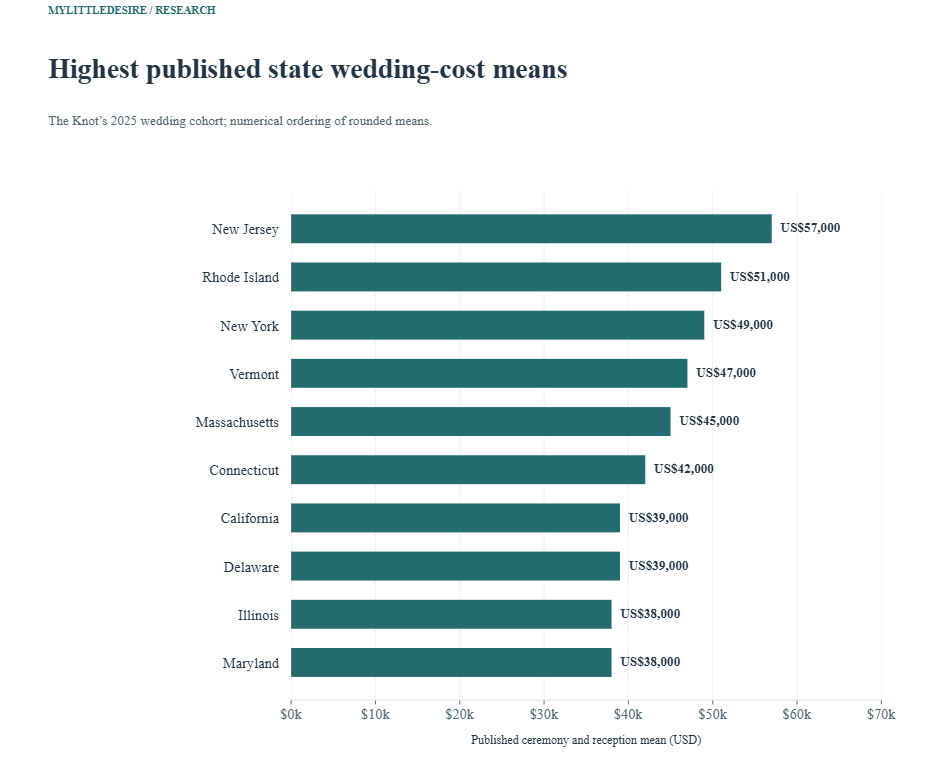
New Jersey has the highest published mean in this particular table. The ordering follows the reported dollar values and retains ties. It does not show that every wedding in one state costs more than every wedding elsewhere. Without state-level sample counts and precision estimates, these ranks cannot be treated as statistically distinct positions.
Which states have lower reported means?

The lower-cost chart shows every state at or below the stated threshold. It includes all ties. A lower mean may reflect smaller events, different vendor or venue choices, and the weddings represented in the sample. The data do not isolate the amount an otherwise identical couple would save by changing states.
How do selected state benchmarks compare?

For selected comparisons, using one source and cohort makes the meaning easier to follow. California’s published mean exceeds Texas’s by US$8,000, while Colorado and Texas have the same published mean. Those calculations reuse the table values; they add no new survey observations and do not account for travel or differences in the events themselves.
How do state figures relate to the national average?
F02 One explicitly published national benchmark in the companion state-cost article. US$34,200 is the web-guide display; PDF uses US$34,000. Neither is computed by taking an unweighted mean of the 50 state figures. Unknown exact valid item n.
F03 Two national cost-distribution benchmarks printed in the 2026 PDF. Mean and median are different statistics. PDF displayed precision remains intact; exact valid cost n unknown. National median does not supply any state median.
| Published measure | Value | Original location | Qualification |
|---|---|---|---|
| National mean, web guide | US$34,200 | The Knot / The Knot Worldwide [S01] At a Glance / What is the average cost of a wedding? | US$34,200 is the web-guide display; PDF uses US$34,000. Neither is computed by taking an unweighted mean of the 50 state figures. Unknown exact valid item n. |
| National mean, PDF display | US$34,000 | The Knot / The Knot Worldwide [S02] Physical p.15 / printed13, Distribution of Wedding Costs | Mean and median are different statistics. PDF displayed precision remains intact; exact valid cost n unknown. National median does not supply any state median. |
| National median, PDF | US$24,000 | The Knot / The Knot Worldwide [S02] Physical p.15 / printed13, Distribution of Wedding Costs | Mean and median are different statistics. PDF displayed precision remains intact; exact valid cost n unknown. National median does not supply any state median. |
The web guide displays a US$34,200 national mean; the PDF displays US$34,000 and a US$24,000 median. The different published mean precision is visible here rather than silently reconciled. A mean and a median summarize a distribution differently. The national median does not supply state medians. For broader distinctions between budgets and actual spending, see our wedding cost and budget statistics.
Averaging the fifty state means would give each state equal weight. That would not establish the average wedding’s cost across the country. State wedding frequencies, valid survey counts and relevant weighting are not available here, so no replacement national mean is calculated.
What separate cost ranges does Zola publish by state?
Zola’s guide publishes a different kind of state table: cost-index ranges derived from a mix of couple budgets, final Budget Tool records and vendor-reported prices. The exact state data windows, valid record counts and range construction are not supplied. Its separate post-wedding survey is not the denominator for this index table. Zola [S03].
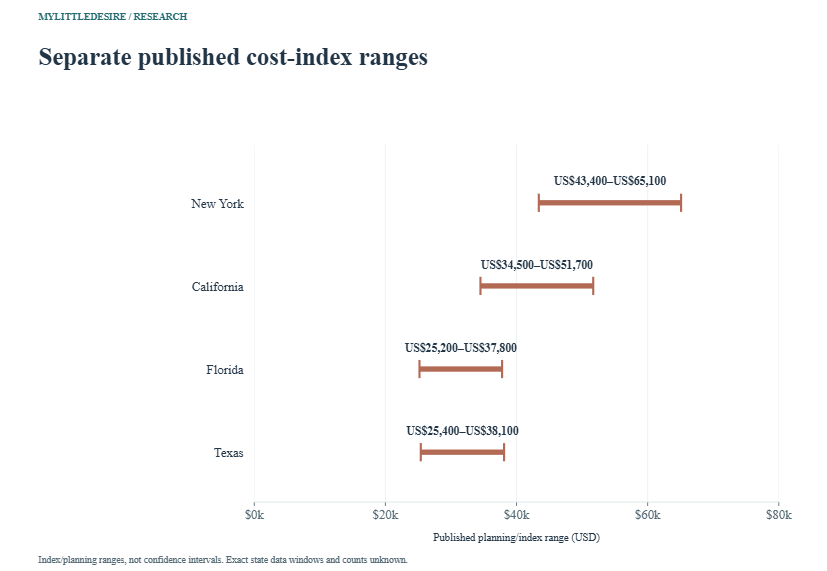
F04 Forty-nine published index/planning ranges; each pair of endpoints is one record.
Not confidence intervals, means, guaranteed quotes or universal min/max prices. Exact state counts, common guest-count basis, inclusion alignment and underlying date windows unavailable. North Dakota absent; no value imputed. Workbook D is lower endpoint and T is upper endpoint on these rows.
| State | Published range (USD) | Source |
|---|---|---|
| Alabama | US$25,000–US$37,600 | Original table [S03] |
| Alaska | US$29,600–US$44,300 | Original table [S03] |
| Arizona | US$28,800–US$43,300 | Original table [S03] |
| Arkansas | US$21,600–US$32,400 | Original table [S03] |
| California | US$34,500–US$51,700 | Original table [S03] |
| Colorado | US$27,000–US$40,400 | Original table [S03] |
| Connecticut | US$31,500–US$47,300 | Original table [S03] |
| Delaware | US$21,900–US$32,900 | Original table [S03] |
| Florida | US$25,200–US$37,800 | Original table [S03] |
| Georgia | US$25,500–US$38,300 | Original table [S03] |
| Hawaii | US$31,800–US$47,700 | Original table [S03] |
| Idaho | US$20,700–US$31,000 | Original table [S03] |
| Illinois | US$32,000–US$48,000 | Original table [S03] |
| Indiana | US$21,500–US$32,300 | Original table [S03] |
| Iowa | US$23,800–US$35,700 | Original table [S03] |
| Kansas | US$18,100–US$27,100 | Original table [S03] |
| Kentucky | US$24,000–US$36,000 | Original table [S03] |
| Louisiana | US$23,800–US$35,700 | Original table [S03] |
| Maine | US$30,600–US$45,900 | Original table [S03] |
| Maryland | US$29,700–US$44,500 | Original table [S03] |
| Massachusetts | US$34,100–US$51,100 | Original table [S03] |
| Michigan | US$25,500–US$38,300 | Original table [S03] |
| Minnesota | US$24,100–US$36,100 | Original table [S03] |
| Mississippi | US$20,700–US$31,100 | Original table [S03] |
| Missouri | US$23,100–US$34,700 | Original table [S03] |
| Montana | US$29,900–US$44,800 | Original table [S03] |
| Nebraska | US$22,500–US$33,800 | Original table [S03] |
| Nevada | US$36,600–US$54,800 | Original table [S03] |
| New Hampshire | US$33,300–US$49,900 | Original table [S03] |
| New Jersey | US$32,800–US$49,200 | Original table [S03] |
| New Mexico | US$20,800–US$31,300 | Original table [S03] |
| New York | US$43,400–US$65,100 | Original table [S03] |
| North Carolina | US$25,700–US$38,500 | Original table [S03] |
| Ohio | US$22,700–US$34,000 | Original table [S03] |
| Oklahoma | US$18,900–US$28,300 | Original table [S03] |
| Oregon | US$24,800–US$37,300 | Original table [S03] |
| Pennsylvania | US$25,800–US$38,700 | Original table [S03] |
| Rhode Island | US$28,600–US$42,900 | Original table [S03] |
| South Carolina | US$25,900–US$38,800 | Original table [S03] |
| South Dakota | US$20,100–US$30,100 | Original table [S03] |
| Tennessee | US$24,300–US$36,500 | Original table [S03] |
| Texas | US$25,400–US$38,100 | Original table [S03] |
| Utah | US$19,700–US$29,600 | Original table [S03] |
| Vermont | US$29,300–US$43,900 | Original table [S03] |
| Virginia | US$29,000–US$43,400 | Original table [S03] |
| Washington | US$26,100–US$39,100 | Original table [S03] |
| West Virginia | US$25,400–US$38,100 | Original table [S03] |
| Wisconsin | US$23,500–US$35,300 | Original table [S03] |
| Wyoming | US$41,000–US$61,500 | Original table [S03] |
Coverage gap: North Dakota is absent from the selected Zola table. It remains available in The Knot’s complete mean table above. Washington, DC is not a state and is absent from both selected state tables; city-level DC figures are not substituted for a state record.
Why do publishers report different state costs?
The sources differ in input records, cost definitions, timing and statistical presentation. A survey mean cannot be merged with a range just because both are expressed in dollars. A range midpoint is an arithmetic construction, not a measured mean supplied by the publisher.
Wyoming illustrates the problem clearly. It has The Knot’s lowest published state mean, while Zola’s separate table gives a much higher planning/index range. Both original entries were checked. This resource preserves the discrepancy and the methods limits. It does not invent a correction, infer an error solely from disagreement or describe either table as confirming the other.
| Check | Why it matters |
|---|---|
| Actual period | A report year, guide update and wedding cohort can differ |
| Spending basket | Ceremony/reception, venue-only and out-of-pocket spending are not interchangeable |
| Statistic | A mean, median and pair of range endpoints answer different questions |
| Audience and inputs | Member surveys, platform budgets and vendor prices cover different records |
| Guests and package scope | State averages do not hold guest count and service inclusions constant |
| Missing bases | Full survey size does not establish state precision or a confidence interval |
How should couples use state wedding-cost statistics?
Use the state number as background for comparing local quotes. First define the guest list and the services that the quoted package covers. Then compare actual offers for the same date, place and scope. The editorial implication of these tables is to make the comparison more specific; the tables themselves do not test a budgeting method or guarantee a saving.
State boundaries are broad. A city, rural venue and destination property within the same state can offer very different packages. Travel, accommodation and the engagement ring may also sit outside the ceremony/reception comparison. Those decisions need their own prices rather than an assumed share of the state mean.
Ten reproducible state comparisons
Each result is the first published state mean minus the second, in nominal US dollars. All ten use The Knot’s same source table and wedding cohort. No currency conversion, inflation uplift or cross-publisher range comparison is used.
| Comparison | Published inputs | Difference (USD) | Interpretation |
|---|---|---|---|
| New Jersey minus Wyoming | US$57,000 − US$17,000 | US$40,000 | Descriptive difference between published rounded state means in the same 2025 cohort. Not a matched-wedding saving, causal location effect or significance test; state item bases unavailable. |
| New York minus California | US$49,000 − US$39,000 | US$10,000 | Descriptive difference between published rounded state means in the same 2025 cohort. Not a matched-wedding saving, causal location effect or significance test; state item bases unavailable. |
| California minus Texas | US$39,000 − US$31,000 | US$8,000 | Descriptive difference between published rounded state means in the same 2025 cohort. Not a matched-wedding saving, causal location effect or significance test; state item bases unavailable. |
| Florida minus Texas | US$33,000 − US$31,000 | US$2,000 | Descriptive difference between published rounded state means in the same 2025 cohort. Not a matched-wedding saving, causal location effect or significance test; state item bases unavailable. |
| Rhode Island minus New York | US$51,000 − US$49,000 | US$2,000 | Descriptive difference between published rounded state means in the same 2025 cohort. Not a matched-wedding saving, causal location effect or significance test; state item bases unavailable. |
| Connecticut minus Illinois | US$42,000 − US$38,000 | US$4,000 | Descriptive difference between published rounded state means in the same 2025 cohort. Not a matched-wedding saving, causal location effect or significance test; state item bases unavailable. |
| Massachusetts minus Maryland | US$45,000 − US$38,000 | US$7,000 | Descriptive difference between published rounded state means in the same 2025 cohort. Not a matched-wedding saving, causal location effect or significance test; state item bases unavailable. |
| Pennsylvania minus North Carolina | US$36,000 − US$29,000 | US$7,000 | Descriptive difference between published rounded state means in the same 2025 cohort. Not a matched-wedding saving, causal location effect or significance test; state item bases unavailable. |
| Colorado minus Texas | US$31,000 − US$31,000 | US$0 | Descriptive difference between published rounded state means in the same 2025 cohort. Not a matched-wedding saving, causal location effect or significance test; state item bases unavailable. |
| Ohio minus Michigan | US$28,000 − US$29,000 | −US$1,000 | Descriptive difference between published rounded state means in the same 2025 cohort. Not a matched-wedding saving, causal location effect or significance test; state item bases unavailable. |
Common questions
Which state has the highest average wedding cost?
New Jersey has the highest reported ceremony/reception mean in the selected Knot table, at US$57,000 for 2025 weddings. This is a source-specific rounded mean, not a prediction for every wedding.
Which state has the lowest average wedding cost?
Wyoming is lowest in that same table at US$17,000. The separate Zola range table uses a different method and does not establish the same ordering.
Does the state average include the engagement ring?
The Knot explicitly describes the state figures as ceremony/reception costs excluding the engagement ring. The Zola ranges are a different index measure and are not assumed to have a fully harmonized basket.
Can I use a Zola range midpoint as the average?
No measured mean can be inferred from the midpoint alone. The range construction, distribution and weights are not supplied, so both endpoints stay labelled as a published range.
How many couples were surveyed in each state?
The main Knot study contains 10,474 couples overall. Exact valid state cost-item bases are not supplied in the selected material. Zola likewise does not supply exact state index record counts.
Why is North Dakota missing from the range table?
It is absent from the original selected Zola state table. No reason is established here and no value is imputed. The Knot mean table does include North Dakota.
Can the state means be averaged to obtain a national cost?
An unweighted average would give states equal weight rather than weddings equal weight. Required state frequencies and relevant weights are unavailable, so this resource retains the publisher’s national summaries instead.
Research method and limitations
This collection contains 102 records in four grouped findings: 50 state means, 49 state ranges and three national context values. Each range is one record with two endpoints. Three numerical source documents come from two publisher labels. The Knot web guide and PDF use the same main research program; they are not independent surveys. Fifty state categories are not fifty studies.
Original state tables were checked in the publishers’ current pages and fresh text captures. Coverage checks find exactly fifty unique Knot states and forty-nine Zola state ranges, with North Dakota absent only from the latter. The Knot PDF’s methods and cost-distribution pages were rendered and visually inspected. No value was read from an unlabeled map color or estimated from a chart height.
The full Knot sample is 10,474 adult member couples married in 2025, recruited by email from The Knot/WeddingWire membership. Exact state and valid cost-item bases remain unavailable. Zola describes mixed platform and vendor inputs, not the same sampling design. Its separate post-wedding spend-survey size is not assigned to state ranges. All 102 exact valid item-base fields remain blank in the research data.
Limits to retain: Commercial selected audiences; unknown state counts, precision and weighting; non-identical guest lists and spending baskets; rounded mean ties; unknown Zola state windows and range construction; no state medians; no pooled national mean; no causal location saving; no confidence intervals; and no measured 2027 prices.
No original survey, private-record audit, respondent-level reanalysis, meta-analysis, adjusted state model or new significance test was performed. Costs remain in nominal US dollars. Search volume, ranking difficulty, traffic and backlinks were not measured.
Original sources and supporting records
- S01. The Knot / The Knot Worldwide. The Average Wedding Cost, According to The Knot Data. Actual period: US weddings January 1–December 31, 2025; published in 2026. Main n=10,474. Exact state cost-item counts, weighting and state precision estimates not provided in selected article. National cost valid n also unavailable. Method: All 50 state values transcribed from original Wedding Location table and checked against fresh original-page extraction. Main methodology recruits members by email during 2025. Article explicitly defines state costs as ceremony/reception excluding engagement ring. Source-labelled state assignment rules are not elaborated. Commercial member sample, not a national/state probability sample or census. State means differ in guests, services and event mix. Unknown state bases and errors prevent significance claims. Published amounts are in whole thousands; preserve ties. National web mean US$34,200 differs in displayed precision from PDF US$34,000; keep attributed, not merged. Supporting records: record 1, record 2.
- S02. The Knot / The Knot Worldwide. The Knot 2026 Real Weddings Study: Data Read-Out. Actual period: US weddings January 1–December 31, 2025. Main n=10,474; exact valid mean/median cost-item n unavailable. Not assigned to state cells. Method: Original PDF methods physical p.4 / printed02 and cost distribution physical p.15 / printed13 visually checked. Main member invitations during 2025; report also contains ad hoc studies. Selected two national values supply context, not additional state estimates. Same underlying program as S01. Report displays mean US$34,000 and median US$24,000; web guide displays US$34,200 mean. Do not silently substitute one precision for another, average the two means, or claim either is an average calculated from the 50 state means. Supporting records: record 1.
- S03. Zola. Average Cost of Weddings in 2026: A Real Numbers Guide, state ranges. 2026-titled Wedding Cost Index guide; exact underlying state data windows not supplied. State item counts and common fixed guest-count basis not given. North Dakota and DC absent from selected state table. Separate n=720 post-wedding survey is not assigned to these ranges. Method: All 49 original state ranges checked in table, with both endpoints retained. Companion index methodology describes real couple budgets, vendor prices and final Budget Tool data processed with proprietary algorithms. No probability/percentile definition of published range supplied. Published planning/index ranges, not state means, confidence intervals, minimum/maximum prices or guaranteed quotes. Do not derive means from midpoints, compare range endpoints as equivalent to Knot means, infer the same wedding scope or use range width as statistical uncertainty. Exact field/cohort dates, state bases, weighting and full inclusion basket unavailable. Supporting records: record 1.
Supporting and screened records without added observations
- R01. Zola. Inside the Zola Wedding Cost Index: Data Methodology and Breakdown. Describes couple budgets, final Budget Tool records, vendor prices and proprietary algorithms; index is not the separate post-wedding spend survey. No exact state denominators, state range percentiles, confidence level or full harmonization with The Knot. Methodology counts and example costs not used to pad observations.
- R02. Zola. Average-cost guide, national scope qualification. National figure wording mixes overall wedding cost and out-of-pocket after family contributions. National Zola headline not added to counted observations or cross-publisher arithmetic. State ranges remain exactly attributed; scope alignment with Knot is unestablished.
How to cite this resource
MyLittleDesire. Wedding Cost by State Statistics 2027. https://mylittledesire.com/wedding-cost-by-state-statistics/.