
Romantic gift giving research shows different measures of intention, preference and spending. A plan to buy a partner a present is different from a completed purchase, and a popular gift is not necessarily what a particular partner wants.
This reference brings together 54 observations in 17 groups from four source collections, with four charts and ten reproducible comparisons. It focuses on gifts exchanged with a romantic partner, including Valentine’s Day and Christmas, rather than the whole holiday retail market.
81%
US$132
planned to give their partner a Valentine’s gift in LendingTree’s January 2026 in-relationship findings.Original source [S01]
was the reported mean planned spending on a partner in that study; zero-spender treatment was unreported.Original source [S01]
13%
92%
of U.S. partner-celebrators planned no gifts in YouGov’s January 2023 survey.Original source [S02]
was the Christmas partner-giving percentage in YouGov’s 2025 article, using its partner-eligible rebase.Original source [S03]
What do romantic gift giving statistics cover?
The selected evidence covers planned partner gifts, desired gifts, hypothetical financial pressure, no-gift celebrations and Christmas partner budgets. It includes survey responses about typical behavior and expected spending, with each original population retained. For holiday-wide spending and celebration, see our Valentine’s Day statistics.
| Collection | Selected scope | Actual period | Full and selected bases |
|---|---|---|---|
| LendingTree / QuestionPro [S01] | U.S. consumers age 18–80 who were in a relationship; exact selected item/subgroup bases unreported | January 2, 2026; plans for Valentine’s Day 2026 | 2,000 full survey respondents age 18–80, not the selected in-relationship item base. All 20 selected exact item/subgroup bases unknown. Full 2,000 is not substituted. |
| YouGov — U.S. January 2023 [S02] | U.S. adults age 18+ planning to celebrate Valentine’s Day with a romantic partner; selected gender/age groups | January 2023; exact fieldwork days unreported | 1,181 full survey respondents. Exact partner-celebrating item/gender/age bases unreported. All 11 selected exact item/group bases unknown; full n=1,181 not substituted. |
| YouGov — GB Christmas survey [S03] | GB adults; partner giving rebased as in publisher article, spending bands among typical partner gift buyers | November 19–20, 2025; typical Christmas behavior/expected spending | 2,088 full GB adult sample. Original partner-spending item prints asked n=1,324; exact gender subset n unavailable. Ten overall partner-spending band rows retain printed eligible asked n=1,324, not asserted item-complete or weighted n. Five giving/gender rows have unknown selected bases. |
| YouGov — GB January 2024 [S04] | GB adults and selected men/women as described in article; exact gift-item eligibility/filter unreported | January 25, 2024; Valentine’s Day 2024 intentions/preferences | 1,500 full GB adults. Selected gift-item/gender bases and full question/filter text unreported. All eight exact selected item/group bases unknown; full n=1,500 not used as item n. |
Also Read:-
International Friendship Day Statistics 2027
Sympathy Card Condolence Practices Statistics 2027
Thank You Notes Appreciation Statistics 2027
Social Support During Life Changes Statistics 2027
What do partners plan to give and hope to receive?
F01 Planned to give a partner a Valentine’s Day gift. January 2026 nonprobability survey. Selected partnered item base unknown; planned/wanted, not actual purchases or matched couples. Categories overlap.
| Measure / group | Published value | Actual period and base | Original source |
|---|---|---|---|
| Plan to give partner a gift | 81% | January 2, 2026; plans for Valentine’s Day 2026 Exact selected item/group n unavailable | Original source [S01] Average spending section, first paragraph |
F02 Nominal U.S. dollar means for own planned spending and expected partner spending. Publisher’s in-relationship means; item bases and zero-spender treatment unknown. Not realized spending or a recommended budget.
| Measure / group | Published value | Actual period and base | Original source |
|---|---|---|---|
| Mean planned spending on partner | US$132 | January 2, 2026; plans for Valentine’s Day 2026 Exact selected item/group n unavailable | Original source [S01] Average spending section; own mean and expected partner mean |
| Mean expected spending by partner | US$118 | January 2, 2026; plans for Valentine’s Day 2026 Exact selected item/group n unavailable | Original source [S01] Average spending section; own mean and expected partner mean |
F03 Separate giving and receiving responses for chocolate or candy. January 2026 nonprobability survey. Selected partnered item base unknown; planned/wanted, not actual purchases or matched couples. Categories overlap.
| Measure / group | Published value | Actual period and base | Original source |
|---|---|---|---|
| Plan to give: Chocolate or candy | 30% | January 2, 2026; plans for Valentine’s Day 2026 Exact selected item/group n unavailable | Original source [S01] Average spending section, wanted and most-gifted lists |
| Wish to receive: Chocolate or candy | 22% | January 2, 2026; plans for Valentine’s Day 2026 Exact selected item/group n unavailable | Original source [S01] Average spending section, wanted and most-gifted lists |
F04 Separate giving and receiving responses for greeting card. January 2026 nonprobability survey. Selected partnered item base unknown; planned/wanted, not actual purchases or matched couples. Categories overlap.
| Measure / group | Published value | Actual period and base | Original source |
|---|---|---|---|
| Plan to give: Greeting card | 27% | January 2, 2026; plans for Valentine’s Day 2026 Exact selected item/group n unavailable | Original source [S01] Average spending section, wanted and most-gifted lists |
| Wish to receive: Greeting card | 20% | January 2, 2026; plans for Valentine’s Day 2026 Exact selected item/group n unavailable | Original source [S01] Average spending section, wanted and most-gifted lists |
F05 Separate giving and receiving responses for special meal at home. January 2026 nonprobability survey. Selected partnered item base unknown; planned/wanted, not actual purchases or matched couples. Categories overlap.
| Measure / group | Published value | Actual period and base | Original source |
|---|---|---|---|
| Plan to give: Special meal at home | 23% | January 2, 2026; plans for Valentine’s Day 2026 Exact selected item/group n unavailable | Original source [S01] Average spending section, wanted and most-gifted lists |
| Wish to receive: Special meal at home | 19% | January 2, 2026; plans for Valentine’s Day 2026 Exact selected item/group n unavailable | Original source [S01] Average spending section, wanted and most-gifted lists |
F06 Separate giving and receiving responses for flowers. January 2026 nonprobability survey. Selected partnered item base unknown; planned/wanted, not actual purchases or matched couples. Categories overlap.
| Measure / group | Published value | Actual period and base | Original source |
|---|---|---|---|
| Plan to give: Flowers | 21% | January 2, 2026; plans for Valentine’s Day 2026 Exact selected item/group n unavailable | Original source [S01] Average spending section, wanted and most-gifted lists |
| Wish to receive: Flowers | 18% | January 2, 2026; plans for Valentine’s Day 2026 Exact selected item/group n unavailable | Original source [S01] Average spending section, wanted and most-gifted lists |
F07 Separate giving and receiving responses for experiential gift. January 2026 nonprobability survey. Selected partnered item base unknown; planned/wanted, not actual purchases or matched couples. Categories overlap.
| Measure / group | Published value | Actual period and base | Original source |
|---|---|---|---|
| Plan to give: Experiential gift | 16% | January 2, 2026; plans for Valentine’s Day 2026 Exact selected item/group n unavailable | Original source [S01] Average spending section, wanted and most-gifted lists |
| Wish to receive: Experiential gift | 15% | January 2, 2026; plans for Valentine’s Day 2026 Exact selected item/group n unavailable | Original source [S01] Average spending section, wanted and most-gifted lists |
F08 Separate giving and receiving responses for jewelry. January 2026 nonprobability survey. Selected partnered item base unknown; planned/wanted, not actual purchases or matched couples. Categories overlap.
| Measure / group | Published value | Actual period and base | Original source |
|---|---|---|---|
| Plan to give: Jewelry | 12% | January 2, 2026; plans for Valentine’s Day 2026 Exact selected item/group n unavailable | Original source [S01] Average spending section, wanted and most-gifted lists |
| Wish to receive: Jewelry | 13% | January 2, 2026; plans for Valentine’s Day 2026 Exact selected item/group n unavailable | Original source [S01] Average spending section, wanted and most-gifted lists |

The giving and receiving questions describe separate responses within the same survey. Their differences are aggregate arithmetic, not evidence that a particular giver bought too much or that a recipient was disappointed. The two dollar means also compare expectations rather than recorded transactions.
What spending pressure surrounds romantic gifts?
F09 Separate in-relationship survey findings, not an additive response distribution. The 36% this-year answer is included within 47% affordability finding. Debt is possible/hypothetical, not verified borrowing. Beliefs do not establish relationship benefits. Exact item bases unknown.
| Measure / group | Published value | Actual period and base | Original source |
|---|---|---|---|
| Inflation made gifts harder to afford | 47% | January 2, 2026; plans for Valentine’s Day 2026 Exact selected item/group n unavailable | Original source [S01] Key takeaways; Amid inflation; Love is worth the financial pain |
| Harder to afford specifically this year | 36% | January 2, 2026; plans for Valentine’s Day 2026 Exact selected item/group n unavailable | Original source [S01] Key takeaways; Amid inflation; Love is worth the financial pain |
| Might take on credit-card debt | 25% | January 2, 2026; plans for Valentine’s Day 2026 Exact selected item/group n unavailable | Original source [S01] Key takeaways; Amid inflation; Love is worth the financial pain |
| Would be upset if partner took on holiday credit-card debt | 72% | January 2, 2026; plans for Valentine’s Day 2026 Exact selected item/group n unavailable | Original source [S01] Key takeaways; Amid inflation; Love is worth the financial pain |
| Overspending worth it to show care | 33% | January 2, 2026; plans for Valentine’s Day 2026 Exact selected item/group n unavailable | Original source [S01] Key takeaways; Amid inflation; Love is worth the financial pain |

The affordability findings overlap: 36% naming this year is included in the broader 47%. They should not be added. A response about possible credit-card debt is also different from borrowing actually incurred. The overspending belief does not demonstrate that a more expensive gift creates a better relationship.
Can couples celebrate without exchanging gifts?
F10 Planned gifts among U.S. adults celebrating Valentine’s Day with a romantic partner. Original combined categories, multiple responses. Conditional population; exact selected base unknown. Historical intentions, not purchases.
| Measure / group | Published value | Actual period and base | Original source |
|---|---|---|---|
| Food or dinner | 52% | January 2023; exact fieldwork days unreported Exact selected item/group n unavailable | Original source [S02] Original gift types paragraph |
| Greeting cards | 35% | January 2023; exact fieldwork days unreported Exact selected item/group n unavailable | Original source [S02] Original gift types paragraph |
| Clothes or jewelry | 17% | January 2023; exact fieldwork days unreported Exact selected item/group n unavailable | Original source [S02] Original gift types paragraph |
| Event tickets | 6% | January 2023; exact fieldwork days unreported Exact selected item/group n unavailable | Original source [S02] Original gift types paragraph |
| Travel | 5% | January 2023; exact fieldwork days unreported Exact selected item/group n unavailable | Original source [S02] Original gift types paragraph |
F11 No-gift plan, overall and original gender/age groups. All groups are partner-celebrators; exact item/gender/age bases unknown. Related subgroup observations, not independent studies or unwillingness to show care.
| Measure / group | Published value | Actual period and base | Original source |
|---|---|---|---|
| All partner-celebrators | 13% | January 2023; exact fieldwork days unreported Exact selected item/group n unavailable | Original source [S02] Original no-gift paragraph immediately after gift types |
| Women | 17% | January 2023; exact fieldwork days unreported Exact selected item/group n unavailable | Original source [S02] Original no-gift paragraph immediately after gift types |
| Men | 10% | January 2023; exact fieldwork days unreported Exact selected item/group n unavailable | Original source [S02] Original no-gift paragraph immediately after gift types |
| Age 18–34 | 7% | January 2023; exact fieldwork days unreported Exact selected item/group n unavailable | Original source [S02] Original no-gift paragraph immediately after gift types |
| Age 35–54 | 13% | January 2023; exact fieldwork days unreported Exact selected item/group n unavailable | Original source [S02] Original no-gift paragraph immediately after gift types |
| Age 55+ | 18% | January 2023; exact fieldwork days unreported Exact selected item/group n unavailable | Original source [S02] Original no-gift paragraph immediately after gift types |
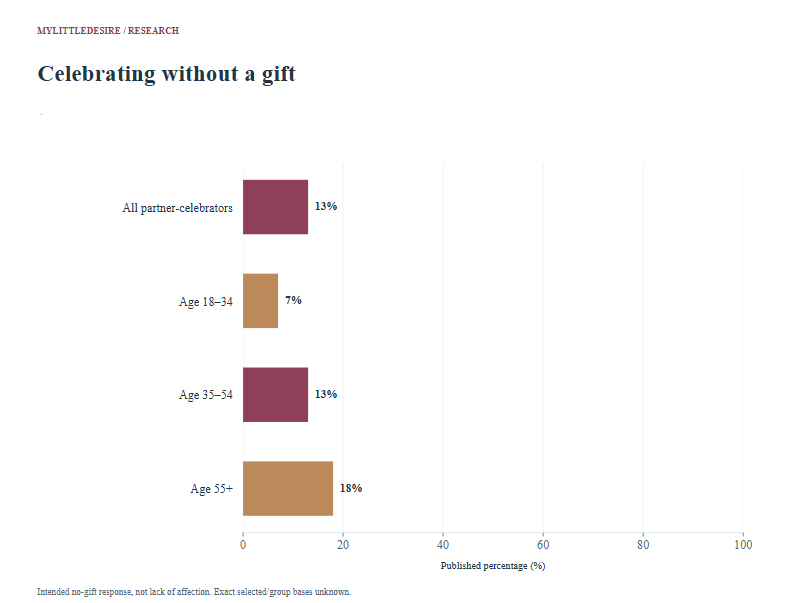
YouGov’s 2023 denominator is people celebrating with a romantic partner. It is not all people in relationships. The survey’s combined food-or-dinner and clothes-or-jewelry categories stay intact; they cannot be split into separate gift rates or directly compared with differently worded categories.
How much do people budget for Christmas gifts for a partner?
F12 Typical partner giving, as rebased and reported in YouGov article. Article partner-eligible percentages; raw table has a different gift-buyer denominator including people without a partner. Retain publisher 92/95/89 without reconstructing from rounded cells. Exact selected bases unknown.
| Measure / group | Published value | Actual period and base | Original source |
|---|---|---|---|
| Partner-eligible adults, as article reports | 92% | November 19–20, 2025; typical Christmas behavior/expected spending Exact selected item/group n unavailable | Original source [S03] Giving article, Who do Britons give presents to? partner paragraph |
| Men in a relationship, as article reports | 95% | November 19–20, 2025; typical Christmas behavior/expected spending Exact selected item/group n unavailable | Original source [S03] Giving article, Who do Britons give presents to? partner paragraph |
| Women in a relationship, as article reports | 89% | November 19–20, 2025; typical Christmas behavior/expected spending Exact selected item/group n unavailable | Original source [S03] Giving article, Who do Britons give presents to? partner paragraph |
F13 Original expected-spending bands, among those who typically give a partner a Christmas present. Percent in each GBP-denominated spending band, not currency-valued observations. £51–100 includes £100. Printed eligible asked n=1,324; weighted/item-complete n unknown. Rounded categories total 99%. Preserve reported 0% as numeric zero.
| Measure / group | Published value | Actual period and base | Original source |
|---|---|---|---|
| £5 or less | 0% | November 19–20, 2025; typical Christmas behavior/expected spending Printed eligible asked n=1,324; item-complete/weighted n unknown | Original source [S03] Original crosstab printed/PDF page 7; Your partner spending item |
| £6–10 | 1% | November 19–20, 2025; typical Christmas behavior/expected spending Printed eligible asked n=1,324; item-complete/weighted n unknown | Original source [S03] Original crosstab printed/PDF page 7; Your partner spending item |
| £11–20 | 3% | November 19–20, 2025; typical Christmas behavior/expected spending Printed eligible asked n=1,324; item-complete/weighted n unknown | Original source [S03] Original crosstab printed/PDF page 7; Your partner spending item |
| £21–30 | 5% | November 19–20, 2025; typical Christmas behavior/expected spending Printed eligible asked n=1,324; item-complete/weighted n unknown | Original source [S03] Original crosstab printed/PDF page 7; Your partner spending item |
| £31–50 | 11% | November 19–20, 2025; typical Christmas behavior/expected spending Printed eligible asked n=1,324; item-complete/weighted n unknown | Original source [S03] Original crosstab printed/PDF page 7; Your partner spending item |
| £51–100 | 26% | November 19–20, 2025; typical Christmas behavior/expected spending Printed eligible asked n=1,324; item-complete/weighted n unknown | Original source [S03] Original crosstab printed/PDF page 7; Your partner spending item |
| £101–150 | 16% | November 19–20, 2025; typical Christmas behavior/expected spending Printed eligible asked n=1,324; item-complete/weighted n unknown | Original source [S03] Original crosstab printed/PDF page 7; Your partner spending item |
| £151–200 | 12% | November 19–20, 2025; typical Christmas behavior/expected spending Printed eligible asked n=1,324; item-complete/weighted n unknown | Original source [S03] Original crosstab printed/PDF page 7; Your partner spending item |
| More than £200 | 16% | November 19–20, 2025; typical Christmas behavior/expected spending Printed eligible asked n=1,324; item-complete/weighted n unknown | Original source [S03] Original crosstab printed/PDF page 7; Your partner spending item |
| Don’t know | 9% | November 19–20, 2025; typical Christmas behavior/expected spending Printed eligible asked n=1,324; item-complete/weighted n unknown | Original source [S03] Original crosstab printed/PDF page 7; Your partner spending item |
F14 Original published >£100 partner-gift spending percentages by gender. Publisher NETs overlap original bands; not additional independent samples. Exact eligible gender n unknown; full-sample gender bases not substituted.
| Measure / group | Published value | Actual period and base | Original source |
|---|---|---|---|
| Men buying partner a gift: more than £100 | 50% | November 19–20, 2025; typical Christmas behavior/expected spending Exact selected item/group n unavailable | Original source [S03] Cost article, partner spending gender paragraph |
| Women buying partner a gift: more than £100 | 39% | November 19–20, 2025; typical Christmas behavior/expected spending Exact selected item/group n unavailable | Original source [S03] Cost article, partner spending gender paragraph |
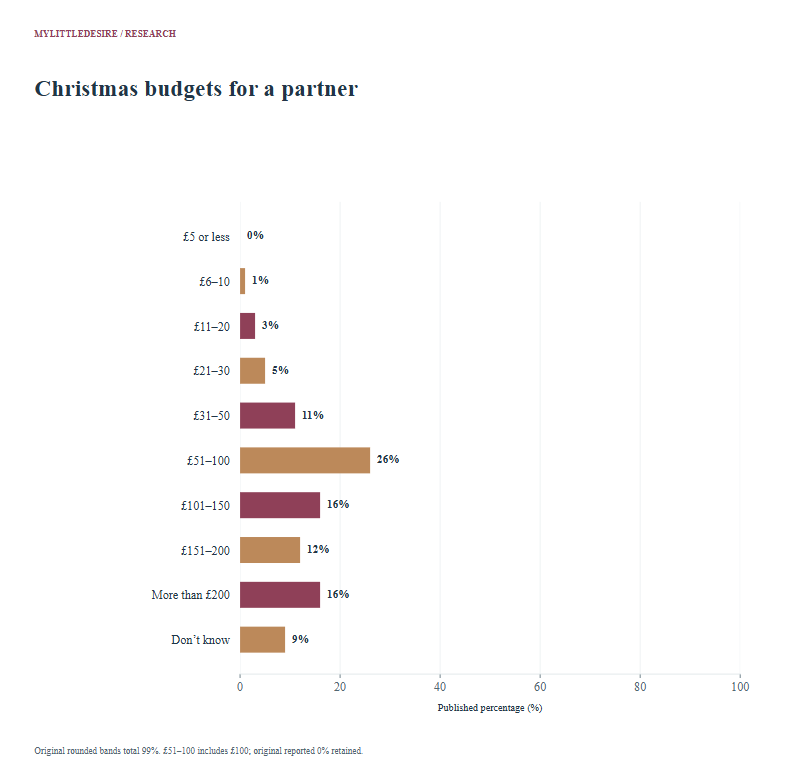
The original £51–100 spending band includes £100. This resource therefore presents the original bands rather than calling the lower-band total strictly “less than £100.” The ten rounded responses total 99%; they have not been adjusted to force 100%. A reported 0% remains a numeric zero, not missing data. The published men/women percentages above £100 are overlapping NETs, not extra independent samples.
What did GB Valentine’s gift research report?
F15 Article-published desired receiving percentages for selected gift types. Exact item eligibility/filter and bases unavailable in article. Do not assert an all-adult or all-partnered denominator. Choices overlap; intentions/preferences, not purchases or matched couples.
| Measure / group | Published value | Actual period and base | Original source |
|---|---|---|---|
| Greeting card | 48% | January 25, 2024; Valentine’s Day 2024 intentions/preferences Exact selected item/group n unavailable | Original source [S04] Original standard gifting trinity prose paragraph |
| Flowers | 27% | January 25, 2024; Valentine’s Day 2024 intentions/preferences Exact selected item/group n unavailable | Original source [S04] Original standard gifting trinity prose paragraph |
| Food or drink | 27% | January 25, 2024; Valentine’s Day 2024 intentions/preferences Exact selected item/group n unavailable | Original source [S04] Original standard gifting trinity prose paragraph |
F16 Article-published intended giving percentages for selected gift types. Exact item eligibility/filter and bases unavailable in article. Do not assert an all-adult or all-partnered denominator. Choices overlap; intentions/preferences, not purchases or matched couples.
| Measure / group | Published value | Actual period and base | Original source |
|---|---|---|---|
| Greeting card | 57% | January 25, 2024; Valentine’s Day 2024 intentions/preferences Exact selected item/group n unavailable | Original source [S04] Original standard gifting trinity prose paragraph |
| Food or drink | 30% | January 25, 2024; Valentine’s Day 2024 intentions/preferences Exact selected item/group n unavailable | Original source [S04] Original standard gifting trinity prose paragraph |
| Flowers | 29% | January 25, 2024; Valentine’s Day 2024 intentions/preferences Exact selected item/group n unavailable | Original source [S04] Original standard gifting trinity prose paragraph |
F17 Article-reported intention to give flowers as a Valentine’s gift. Exact gift-item eligibility and gender bases unreported. Preserve article description without generalizing to every British man or woman.
| Measure / group | Published value | Actual period and base | Original source |
|---|---|---|---|
| Men, as article reports | 50% | January 25, 2024; Valentine’s Day 2024 intentions/preferences Exact selected item/group n unavailable | Original source [S04] Original flower-giving gender paragraph |
| Women, as article reports | 9% | January 25, 2024; Valentine’s Day 2024 intentions/preferences Exact selected item/group n unavailable | Original source [S04] Original flower-giving gender paragraph |
These are the percentages reported in the January 2024 GB article. Its full sample was 1,500 adults, but the gift-item filter, exact question and selected group bases were not provided in the inspected article. They are retained as article-reported findings without assigning an all-adult or all-partnered denominator. They do not form a country ranking or trend against the other surveys.
Ten reproducible descriptive comparisons
Each calculation subtracts compatible published inputs within a source and construct. Percentages produce percentage-point differences; the spending means produce a nominal USD difference. These comparisons are descriptive, without new significance tests.
| ID | Comparison | First | Second | Difference | Qualification |
|---|---|---|---|---|---|
| C01 | Candy: planned giving minus desired receiving | 30% | 22% | +8 percentage points | Aggregate response gap, not a matched-couple shortfall or excess. Descriptive arithmetic; no significance or causal inference. |
| C02 | Card: planned giving minus desired receiving | 27% | 20% | +7 percentage points | Aggregate response gap, not a matched-couple shortfall or excess. Descriptive arithmetic; no significance or causal inference. |
| C03 | Home meal: planned giving minus desired receiving | 23% | 19% | +4 percentage points | Aggregate response gap, not a matched-couple shortfall or excess. Descriptive arithmetic; no significance or causal inference. |
| C04 | Flowers: planned giving minus desired receiving | 21% | 18% | +3 percentage points | Aggregate response gap, not a matched-couple shortfall or excess. Descriptive arithmetic; no significance or causal inference. |
| C05 | Experiential gift: planned giving minus desired receiving | 16% | 15% | +1 percentage points | Aggregate response gap, not a matched-couple shortfall or excess. Descriptive arithmetic; no significance or causal inference. |
| C06 | Jewelry: planned giving minus desired receiving | 12% | 13% | -1 percentage points | Aggregate response gap, not a matched-couple shortfall or excess. Descriptive arithmetic; no significance or causal inference. |
| C07 | Own planned minus expected partner spending | US$132 | US$118 | +14 USD | USD difference between publisher means; not recommended spending or actual imbalance. Descriptive arithmetic; no significance or causal inference. |
| C08 | No-gift plan: age 55+ minus age 18–34 | 18% | 7% | +11 percentage points | Only 2023 partner-celebrators, not all partnered adults. Descriptive arithmetic; no significance or causal inference. |
| C09 | Christmas partner giving: men minus women | 95% | 89% | +6 percentage points | Publisher rebased percentages; exact selected bases unavailable. Descriptive arithmetic; no significance or causal inference. |
| C10 | GB flower-giving plan: men minus women | 50% | 9% | +41 percentage points | Article-reported groups with unreported exact item filter/bases. Descriptive arithmetic; no significance or causal inference. |
Common questions
How much should someone spend on a romantic gift?
These studies report expectations and categories, not a recommended budget. The U.S. means are nominal 2026 figures with unreported zero-spender treatment.
What romantic gifts were popular?
Selected surveys reported cards, food, flowers and other gifts. Their question wording, population, occasion and date differ; popularity does not identify one partner’s preference.
Do all couples exchange Valentine’s gifts?
No. In the selected 2023 study, 13% of people celebrating with a partner planned no gifts. This is not a rate for every partnered adult.
Does the giving-versus-wanting gap measure unhappy couples?
No. It compares aggregate responses, without matched giver-recipient pairs or reported gift satisfaction.
Is the Christmas £51–100 band below £100?
It includes £100. Retain the published band boundary.
Does spending more improve a relationship?
The selected surveys do not establish that causal effect.
Research method and limitations
Selection and concentration. The database contains 54 observations: LendingTree/QuestionPro 20, U.S. YouGov 2023 eleven, GB Christmas 2025 fifteen and GB YouGov 2024 eight. Four research collections come from two publishers. YouGov supplies 34 observations and LendingTree 20. Two Christmas articles share one study. Related gift categories, gender/age groups, overlapping NETs and nested affordability answers are not 54 independent studies. MyLittleDesire conducted no survey.
Verification. Forty-four selected values were independently matched to original first-party HTML prose/lists, excluding scripts. Ten original Christmas budget cells were matched to the crosstab total column, with their printed eligibility and original zero checked. The full study methods and collection dates were reviewed. The two Christmas publication pages do not multiply the study count.
Bases and uncertainty. Ten spending-band rows retain printed eligible asked n=1,324, without asserting a complete-answer or weighted base. Forty-four selected item/group bases remain unknown. All selected weighted counts and estimate-specific confidence intervals remain blank. Full study samples are recorded separately and are not assigned to filtered questions.
Units and limits. Fifty-two observations are percentages, including percentages in GBP budget bands; two are nominal USD means. No currency conversion or inflation adjustment is made. Preserve intended giving, desired receiving, typical behavior, expected amounts and hypothetical debt as distinct measures. Unknown eligibility for the GB 2024 items is explicit. No global total, forecast, country ranking or causal relationship benefit is calculated.
Original sources
- LendingTree / QuestionPro. Love Costs More: Valentine’s Spending Slips as Prices Rise [S01]
Published: February 2, 2026.
Period: January 2, 2026; plans for Valentine’s Day 2026.
Population: U.S. consumers age 18–80 who were in a relationship; exact selected item/subgroup bases unreported.
Sample: 2,000 full survey respondents age 18–80, not the selected in-relationship item base.
Bases: All 20 selected exact item/subgroup bases unknown. Full 2,000 is not substituted.
Method: First-party report of QuestionPro online survey commissioned by LendingTree; nonprobability sample with quotas and response quality review. Original report prose/lists checked. Selected data are survey responses, not its separate product-price audit.
Limits: Plans, wishes, hypothetical debt and beliefs are not completed purchases, partner-matched preferences or relationship outcomes. Exact selected item bases/weighted counts/intervals and questionnaire unavailable. USD means are nominal, publisher-reported in-relationship means; zero-spender treatment is unreported. Multiple gift categories overlap. Thirty-six percent is nested within the 47% inflation finding. Commercial publisher. - YouGov — U.S. January 2023. Valentine’s is coming – How will Americans spend their time and money? [S02]
Published: January 31, 2023.
Period: January 2023; exact fieldwork days unreported.
Population: U.S. adults age 18+ planning to celebrate Valentine’s Day with a romantic partner; selected gender/age groups.
Sample: 1,181 full survey respondents. Exact partner-celebrating item/gender/age bases unreported.
Bases: All 11 selected exact item/group bases unknown; full n=1,181 not substituted.
Method: Original first-party article; custom YouGov online survey. Publisher describes nationally representative sample and weighting by age, gender, education, region and race. Original gift and no-gift prose percentages retained.
Limits: Historical intended behavior, not 2027 or completed purchases. Conditional on celebrating with a partner, unlike all partnered adults. Food/dinner and clothes/jewelry are original combined categories. Do not split them or compare directly with differently worded categories. Exact selected bases/intervals unavailable. - YouGov — GB Christmas survey. Big Survey on Christmas: partner giving and spending [S03]
Published: November 28, 2025 (both articles).
Period: November 19–20, 2025; typical Christmas behavior/expected spending.
Population: GB adults; partner giving rebased as in publisher article, spending bands among typical partner gift buyers.
Sample: 2,088 full GB adult sample. Original partner-spending item prints asked n=1,324; exact gender subset n unavailable.
Bases: Ten overall partner-spending band rows retain printed eligible asked n=1,324, not asserted item-complete or weighted n. Five giving/gender rows have unknown selected bases.
Method: Original first-party giving/cost articles plus linked 28-page crosstab checked. Online weighted YouGov survey; original total-column partner-spending bands on printed/PDF p.7 and eligibility retained. Partner-giving figures 92/95/89 are publisher article rebased percentages, not recomputed from rounded crosstab.
Limits: Same single study behind two articles, not two independent surveys. Raw gift-buyer table includes people without a partner and shows 70% giving; article’s partner-eligible 92% uses a different denominator. Preserve publisher rebase without inventing n. Original £51–100 band includes £100; do not call its lower-band aggregate strictly less than £100. Published >£100 gender NETs overlap spending bands. Typical/expected Christmas behavior, not realized annual romantic spending.
Supporting record 1 · Supporting record 2 - YouGov — GB January 2024. In the name of love: how Britons plan to spend Valentine’s Day 2024 [S04]
Published: February 5, 2024.
Period: January 25, 2024; Valentine’s Day 2024 intentions/preferences.
Population: GB adults and selected men/women as described in article; exact gift-item eligibility/filter unreported.
Sample: 1,500 full GB adults. Selected gift-item/gender bases and full question/filter text unreported.
Bases: All eight exact selected item/group bases unknown; full n=1,500 not used as item n.
Method: Original first-party prose checked. YouGov Surveys: Self-serve poll weighted by age, gender, race, political affiliation, education and region, as article reports. Retain intended giving versus desired receiving separately.
Limits: Exact item filter/denominator unavailable. Report as article-published gift findings rather than asserting all GB adults or all partnered adults were asked. Not actual purchases or partner-matched demand. Men/women flower figures are reported groups, not personal rules. No direct trend or country ranking against other surveys.
How to cite this resource
MyLittleDesire. Romantic Gift Giving Statistics 2027. https://mylittledesire.com/romantic-gift-giving-statistics/.