A thank-you note can be physical or digital, and the format someone likes to send may differ from the format they prefer to receive. Appreciation research also examines how a message feels to its recipient and how people experience recognition at work. These are related subjects with different measures.
This reference contains 57 published observations in 16 groups from three research source collections, with four original charts and ten descriptive comparisons. One collection is a multi-experiment paper; another contains several workplace-survey waves. They are not three independent single studies, and the observations should not be counted as 57 independent studies.
42%
40%
preferred to send a physical thank-you note in YouGov’s June 2023 U.S. survey. Physical does not necessarily mean handwritten.Original source [S01]
had no format preference when receiving a note in the same survey; 29% preferred physical and 19% digital.Original source [S01]
9.54 / 10
22%
was the mean recipient-rated warmth composite in one gratitude-letter experiment; 78 matched pairs.Original source [S02]
strongly agreed they received the right amount of workplace recognition in the 2024 Gallup/Workhuman report.Original source [S03]
What do thank-you and appreciation statistics measure?
Format preference describes what a person favors. Perceived prevalence describes what they think is common. Writer mood and recipient ratings are reports on specified scales. Workplace recognition covers organisational practices that may include praise, feedback and other acknowledgment. None of these alone is a universal measure of gratitude.
| Source collection | Population | Actual collection / publication context | Sample context |
|---|---|---|---|
| YouGov [S01] | U.S. adults age 18+; selected overall answers and age-group breakdowns | June 14, 2023 | 12,105 U.S. adults printed on each of three same-day questions; not three independent samples or an exact age-group n. |
| Amit Kumar & Nicholas Epley / Psychological Science [S02] | Selected MBA students/laboratory participants and the recipients they chose; experiment-specific analysis samples | Collection dates not stated in main article; publication 2018. Distinct experiments retained separately. | Multi-experiment paper, not one full sample: selected mood bases 99/107 in Experiment 1 and 100 in Experiment 2; 78 matched pairs for Experiment 4 composites; 98 participants for Experiment 3b choices. |
| Gallup / Workhuman [S03] | Employed U.S. adults age 18+; senior-leader subset and recognition-quality groups for selected results | Primary survey April 16–30, 2024; some results May 7–21, 2024; selected 2022 comparison values retained as published | Report cites 4,439 primary April 2024 respondents and 21,543 in a May 2024 survey. It also discusses a separate 3,447-person 2022–2024 turnover cohort; no turnover figure selected. No single full n assigned to all selected results. |
Personal expressions of thanks also occur within friendships and families. See our friendship statistics for broader relationship measures. The present reference does not estimate etiquette for every occasion or culture.
Which thank-you-note formats did adults prefer?
F01 Preferred format when thanking someone with a note. Final archived June 2023 answers. Full asked n=12,105, not asserted item-complete n. Physical does not necessarily mean handwritten. Rounded totals preserved; no new combined rate.
| Measure / group | Published result and unit | Population, period and base | Original source |
|---|---|---|---|
| A physical thank you note | 42% percent | U.S. adults age 18+; selected overall answers and age-group breakdowns June 14, 2023 · Full printed survey base n=12,105; item-valid n unconfirmed | Original source [S01] June 14, 2023 question 1, all adults, original public results object |
| A digital thank you note | 25% percent | U.S. adults age 18+; selected overall answers and age-group breakdowns June 14, 2023 · Full printed survey base n=12,105; item-valid n unconfirmed | Original source [S01] June 14, 2023 question 1, all adults, original public results object |
| No preference | 20% percent | U.S. adults age 18+; selected overall answers and age-group breakdowns June 14, 2023 · Full printed survey base n=12,105; item-valid n unconfirmed | Original source [S01] June 14, 2023 question 1, all adults, original public results object |
| I never send thank you notes | 9% percent | U.S. adults age 18+; selected overall answers and age-group breakdowns June 14, 2023 · Full printed survey base n=12,105; item-valid n unconfirmed | Original source [S01] June 14, 2023 question 1, all adults, original public results object |
| Not sure | 5% percent | U.S. adults age 18+; selected overall answers and age-group breakdowns June 14, 2023 · Full printed survey base n=12,105; item-valid n unconfirmed | Original source [S01] June 14, 2023 question 1, all adults, original public results object |
F02 Preferred format when someone else thanks the respondent with a note. Final archived June 2023 answers. Full asked n=12,105, not asserted item-complete n. Physical does not necessarily mean handwritten. Rounded totals preserved; no new combined rate.
| Measure / group | Published result and unit | Population, period and base | Original source |
|---|---|---|---|
| A physical thank you note | 29% percent | U.S. adults age 18+; selected overall answers and age-group breakdowns June 14, 2023 · Full printed survey base n=12,105; item-valid n unconfirmed | Original source [S01] June 14, 2023 question 2, all adults, original public results object |
| A digital thank you note | 19% percent | U.S. adults age 18+; selected overall answers and age-group breakdowns June 14, 2023 · Full printed survey base n=12,105; item-valid n unconfirmed | Original source [S01] June 14, 2023 question 2, all adults, original public results object |
| No preference | 40% percent | U.S. adults age 18+; selected overall answers and age-group breakdowns June 14, 2023 · Full printed survey base n=12,105; item-valid n unconfirmed | Original source [S01] June 14, 2023 question 2, all adults, original public results object |
| I don’t want to be sent thank you notes | 6% percent | U.S. adults age 18+; selected overall answers and age-group breakdowns June 14, 2023 · Full printed survey base n=12,105; item-valid n unconfirmed | Original source [S01] June 14, 2023 question 2, all adults, original public results object |
| Not sure | 5% percent | U.S. adults age 18+; selected overall answers and age-group breakdowns June 14, 2023 · Full printed survey base n=12,105; item-valid n unconfirmed | Original source [S01] June 14, 2023 question 2, all adults, original public results object |
F03 Perception of the relative prevalence of physical and digital notes, not measured sending behavior. Final archived June 2023 answers. Full asked n=12,105, not asserted item-complete n. Physical does not necessarily mean handwritten. Rounded totals preserved; no new combined rate.
| Measure / group | Published result and unit | Population, period and base | Original source |
|---|---|---|---|
| A physical thank you note | 12% percent | U.S. adults age 18+; selected overall answers and age-group breakdowns June 14, 2023 · Full printed survey base n=12,105; item-valid n unconfirmed | Original source [S01] June 14, 2023 question 3, all adults, original public results object |
| A digital thank you note | 61% percent | U.S. adults age 18+; selected overall answers and age-group breakdowns June 14, 2023 · Full printed survey base n=12,105; item-valid n unconfirmed | Original source [S01] June 14, 2023 question 3, all adults, original public results object |
| Equally common | 14% percent | U.S. adults age 18+; selected overall answers and age-group breakdowns June 14, 2023 · Full printed survey base n=12,105; item-valid n unconfirmed | Original source [S01] June 14, 2023 question 3, all adults, original public results object |
| Not sure | 12% percent | U.S. adults age 18+; selected overall answers and age-group breakdowns June 14, 2023 · Full printed survey base n=12,105; item-valid n unconfirmed | Original source [S01] June 14, 2023 question 3, all adults, original public results object |
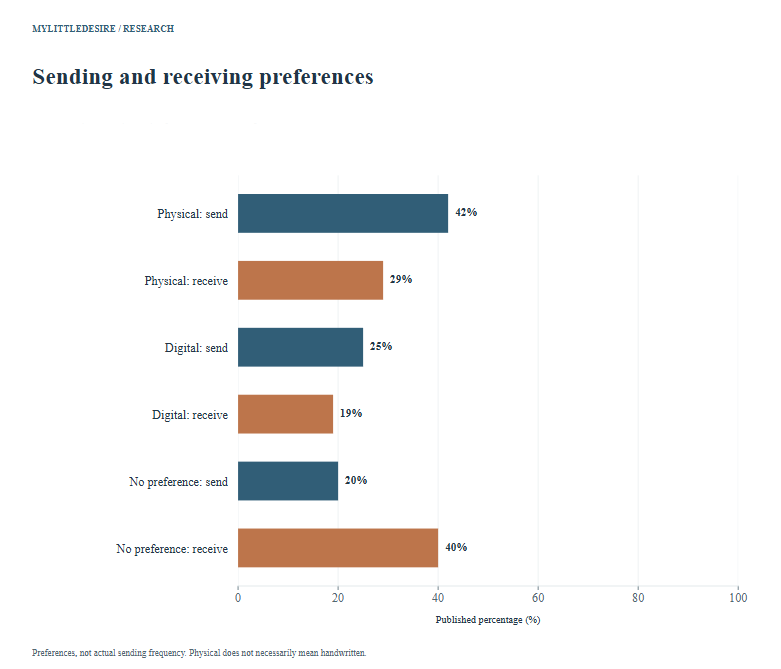
Physical was the largest named sending-format category at 42%, but it was not a majority of all adults. No preference was the largest receiving category at 40%. The questions do not show how often people actually send notes, whether a physical note is handwritten, or whether the same individual’s answers changed across contexts.
The 61% saying digital notes were more common described a perception. It is not a measured market share or count of notes sent. The three questions share one June 14, 2023 collection and a printed full survey total of 12,105; they are not three independent polls. Rounded category totals are preserved even where they sum to 99 or 101.
Also Read:-
Social Support During Life Changes Statistics 2027
Neighbor Relationships And Community Connection Statistics 2027
Online vs In Person Friendship Statistics 2027
Making Friends as an Adult Statistics 2027
How did note preferences differ by age?
F04 A physical thank you note within each age group. Cross-sectional age groups, not individual aging. Exact subgroup bases/CIs unknown; full n=12,105 not substituted.
| Measure / group | Published result and unit | Population, period and base | Original source |
|---|---|---|---|
| Age 18-29 | 35% percent | U.S. adults, age 18-29 June 14, 2023 · Exact selected item/group n unavailable | Original source [S01] June 14, 2023 question 1, Age / 18-29 / A physical thank you note |
| Age 30-44 | 40% percent | U.S. adults, age 30-44 June 14, 2023 · Exact selected item/group n unavailable | Original source [S01] June 14, 2023 question 1, Age / 30-44 / A physical thank you note |
| Age 45-64 | 44% percent | U.S. adults, age 45-64 June 14, 2023 · Exact selected item/group n unavailable | Original source [S01] June 14, 2023 question 1, Age / 45-64 / A physical thank you note |
| Age 65+ | 47% percent | U.S. adults, age 65+ June 14, 2023 · Exact selected item/group n unavailable | Original source [S01] June 14, 2023 question 1, Age / 65+ / A physical thank you note |
F05 A digital thank you note within each age group. Cross-sectional age groups, not individual aging. Exact subgroup bases/CIs unknown; full n=12,105 not substituted.
| Measure / group | Published result and unit | Population, period and base | Original source |
|---|---|---|---|
| Age 18-29 | 30% percent | U.S. adults, age 18-29 June 14, 2023 · Exact selected item/group n unavailable | Original source [S01] June 14, 2023 question 2, Age / 18-29 / A digital thank you note |
| Age 30-44 | 24% percent | U.S. adults, age 30-44 June 14, 2023 · Exact selected item/group n unavailable | Original source [S01] June 14, 2023 question 2, Age / 30-44 / A digital thank you note |
| Age 45-64 | 12% percent | U.S. adults, age 45-64 June 14, 2023 · Exact selected item/group n unavailable | Original source [S01] June 14, 2023 question 2, Age / 45-64 / A digital thank you note |
| Age 65+ | 13% percent | U.S. adults, age 65+ June 14, 2023 · Exact selected item/group n unavailable | Original source [S01] June 14, 2023 question 2, Age / 65+ / A digital thank you note |
F06 No preference within each age group. Cross-sectional age groups, not individual aging. Exact subgroup bases/CIs unknown; full n=12,105 not substituted.
| Measure / group | Published result and unit | Population, period and base | Original source |
|---|---|---|---|
| Age 18-29 | 28% percent | U.S. adults, age 18-29 June 14, 2023 · Exact selected item/group n unavailable | Original source [S01] June 14, 2023 question 2, Age / 18-29 / No preference |
| Age 30-44 | 32% percent | U.S. adults, age 30-44 June 14, 2023 · Exact selected item/group n unavailable | Original source [S01] June 14, 2023 question 2, Age / 30-44 / No preference |
| Age 45-64 | 48% percent | U.S. adults, age 45-64 June 14, 2023 · Exact selected item/group n unavailable | Original source [S01] June 14, 2023 question 2, Age / 45-64 / No preference |
| Age 65+ | 51% percent | U.S. adults, age 65+ June 14, 2023 · Exact selected item/group n unavailable | Original source [S01] June 14, 2023 question 2, Age / 65+ / No preference |
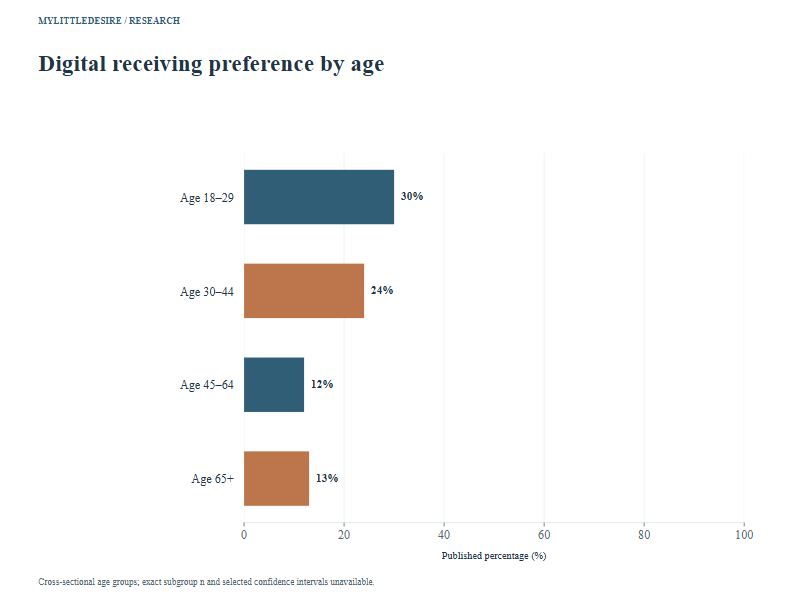
Older and younger respondents reported different preferences. These are different people at one point in time, not the same people tracked as they age. Having no preference about receiving format also differs from not wanting a note at all. Exact age-group bases are unavailable and are not replaced with the full survey total.
How did letter writers describe their mood?
F07 Experiment 1 reported writer mood averages. Mood rated −5 (more negative than usual) to +5 (more positive than usual), with 0 no different. Descriptive reported means, not percentages or clinical outcomes. No randomized no-letter control in this comparison. Baseline n=99 and post-writing n=107 differ; subtracting these marginals is not the source’s paired-change estimate.
| Measure / group | Published result and unit | Population, period and base | Original source |
|---|---|---|---|
| Baseline writer mood | 0.46 points −5 to +5 mood points | Selected MBA students/laboratory participants and the recipients they chose; experiment-specific analysis samples Collection dates not stated in main article; publication 2018. Distinct experiments retained separately. · Reported experiment-specific base n=99 | Original source [S02] Original article printed page 1425 (PDF page 3), Experiment 1 Procedure/Results |
| Post-writing writer mood | 2.58 points −5 to +5 mood points | Selected MBA students/laboratory participants and the recipients they chose; experiment-specific analysis samples Collection dates not stated in main article; publication 2018. Distinct experiments retained separately. · Reported experiment-specific base n=107 | Original source [S02] Original article printed page 1425 (PDF page 3), Experiment 1 Procedure/Results |
F08 Experiment 2 reported writer mood averages. Mood rated −5 (more negative than usual) to +5 (more positive than usual), with 0 no different. Descriptive reported means, not percentages or clinical outcomes. No randomized no-letter control in this comparison.
| Measure / group | Published result and unit | Population, period and base | Original source |
|---|---|---|---|
| Baseline writer mood | 0.77 points −5 to +5 mood points | Selected MBA students/laboratory participants and the recipients they chose; experiment-specific analysis samples Collection dates not stated in main article; publication 2018. Distinct experiments retained separately. · Reported experiment-specific base n=100 | Original source [S02] Original article printed page 1427 (PDF page 5), Experiment 2 Results |
| Post-writing writer mood | 2.56 points −5 to +5 mood points | Selected MBA students/laboratory participants and the recipients they chose; experiment-specific analysis samples Collection dates not stated in main article; publication 2018. Distinct experiments retained separately. · Reported experiment-specific base n=100 | Original source [S02] Original article printed page 1427 (PDF page 5), Experiment 2 Results |
Mood in these tasks used a scale from −5 to +5, with zero meaning no different than usual. A score of 2.58 therefore is not 2.58% of writers or a clinical improvement rate. These samples were recruited in university/laboratory settings, and the selected before/after comparisons did not randomize participants against a no-letter control group.
Different bases in Experiment 1. The baseline average uses 99 writers; the reported post-writing average uses 107. We retain both original means and bases. Subtracting those two marginal averages would not reproduce the paper’s paired-change estimate, so no such comparison is included in the workbook.
How did writers’ predictions compare with recipients’ ratings?
F09 Experiment 4 composite of wording-fit and articulateness ratings. Mean composite points on 0–10 scales, not percentages. Matched analysis n=78 pairs, not all 127 recruited writers. Selected recipient response and convenience sampling apply. Authors report paired competence miscalibration 2.28; do not replace it with 2.29 from rounded marginal means.
| Measure / group | Published result and unit | Population, period and base | Original source |
|---|---|---|---|
| Sender prediction | 6.99 / 10 0–10 composite points | Selected MBA students/laboratory participants and the recipients they chose; experiment-specific analysis samples Collection dates not stated in main article; publication 2018. Distinct experiments retained separately. · Reported matched analysis n=78 sender–recipient pairs | Original source [S02] Original article printed page 1431 (PDF page 9), Experiment 4 composite Results |
| Recipient report | 9.28 / 10 0–10 composite points | Selected MBA students/laboratory participants and the recipients they chose; experiment-specific analysis samples Collection dates not stated in main article; publication 2018. Distinct experiments retained separately. · Reported matched analysis n=78 sender–recipient pairs | Original source [S02] Original article printed page 1431 (PDF page 9), Experiment 4 composite Results |
F10 Experiment 4 composite of perceived warmth and sincerity. Mean composite points on 0–10 scales, not percentages. Matched analysis n=78 pairs, not all 127 recruited writers. Selected recipient response and convenience sampling apply. Prediction-versus-report comparison does not test handwritten superiority.
| Measure / group | Published result and unit | Population, period and base | Original source |
|---|---|---|---|
| Sender prediction | 8.40 / 10 0–10 composite points | Selected MBA students/laboratory participants and the recipients they chose; experiment-specific analysis samples Collection dates not stated in main article; publication 2018. Distinct experiments retained separately. · Reported matched analysis n=78 sender–recipient pairs | Original source [S02] Original article printed page 1431 (PDF page 9), Experiment 4 composite Results |
| Recipient report | 9.54 / 10 0–10 composite points | Selected MBA students/laboratory participants and the recipients they chose; experiment-specific analysis samples Collection dates not stated in main article; publication 2018. Distinct experiments retained separately. · Reported matched analysis n=78 sender–recipient pairs | Original source [S02] Original article printed page 1431 (PDF page 9), Experiment 4 composite Results |
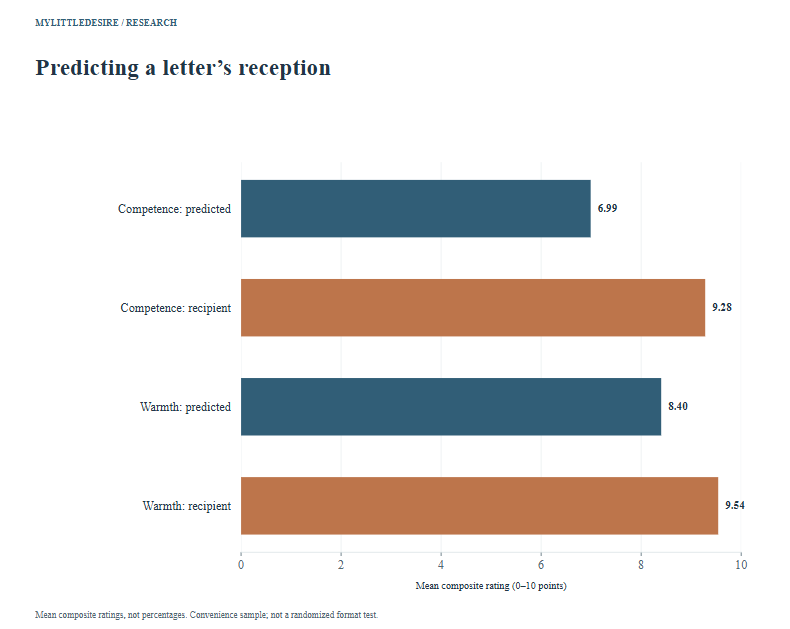
Experiment 4 compares writers’ predictions with recipients’ reports on competence and warmth composites. Both use 0–10 scales, but they measure different qualities. The matched analysis has 78 pairs, rather than all 127 recruited writers. This is not evidence that handwritten notes outperform digital ones.
Preserve original rounding when discussing the competence result. The displayed means 9.28 and 6.99 differ by 2.29, while the authors report paired competence miscalibration as 2.28. The latter is not replaced by arithmetic on rounded means. The workbook’s composite comparison uses warmth, where the two rounded means differ by 1.14 points.
What guided the choice of whom to thank?
F11 Experiment 3b choice between two targets on each of three separate dimensions. Three separate choice tasks among the same 98 participants; not mutually exclusive categories. Original published precision retained. Surprise preference was not statistically significant (p=.54); no new significance test.
| Measure / group | Published result and unit | Population, period and base | Original source |
|---|---|---|---|
| Preferred target expected to be more surprised | 53.05% percent | Selected MBA students/laboratory participants and the recipients they chose; experiment-specific analysis samples Collection dates not stated in main article; publication 2018. Distinct experiments retained separately. · Reported experiment-specific base n=98 | Original source [S02] Original article printed page 1430 (PDF page 8), Experiment 3b Results |
| Preferred target expected to feel especially positive | 88.78% percent | Selected MBA students/laboratory participants and the recipients they chose; experiment-specific analysis samples Collection dates not stated in main article; publication 2018. Distinct experiments retained separately. · Reported experiment-specific base n=98 | Original source [S02] Original article printed page 1430 (PDF page 8), Experiment 3b Results |
| Preferred target expected not to feel awkward | 84.69% percent | Selected MBA students/laboratory participants and the recipients they chose; experiment-specific analysis samples Collection dates not stated in main article; publication 2018. Distinct experiments retained separately. · Reported experiment-specific base n=98 | Original source [S02] Original article printed page 1430 (PDF page 8), Experiment 3b Results |
F12 Experiment 3b final selected letter recipient among six nominated targets. Same 98 participants as preference tasks, not another sample. Publisher’s rounded percentages retained; chosen target type does not prove target’s actual emotional response.
| Measure / group | Published result and unit | Population, period and base | Original source |
|---|---|---|---|
| Expected very positive mood | 32% percent | Selected MBA students/laboratory participants and the recipients they chose; experiment-specific analysis samples Collection dates not stated in main article; publication 2018. Distinct experiments retained separately. · Reported experiment-specific base n=98 | Original source [S02] Original article printed pages 1430–1431 (PDF pages 8–9), final-recipient choice paragraph |
| Expected no awkwardness | 26% percent | Selected MBA students/laboratory participants and the recipients they chose; experiment-specific analysis samples Collection dates not stated in main article; publication 2018. Distinct experiments retained separately. · Reported experiment-specific base n=98 | Original source [S02] Original article printed pages 1430–1431 (PDF pages 8–9), final-recipient choice paragraph |
| Expected high surprise | 22% percent | Selected MBA students/laboratory participants and the recipients they chose; experiment-specific analysis samples Collection dates not stated in main article; publication 2018. Distinct experiments retained separately. · Reported experiment-specific base n=98 | Original source [S02] Original article printed pages 1430–1431 (PDF pages 8–9), final-recipient choice paragraph |
| Expected low surprise | 16% percent | Selected MBA students/laboratory participants and the recipients they chose; experiment-specific analysis samples Collection dates not stated in main article; publication 2018. Distinct experiments retained separately. · Reported experiment-specific base n=98 | Original source [S02] Original article printed pages 1430–1431 (PDF pages 8–9), final-recipient choice paragraph |
| Expected not to feel positive | 3% percent | Selected MBA students/laboratory participants and the recipients they chose; experiment-specific analysis samples Collection dates not stated in main article; publication 2018. Distinct experiments retained separately. · Reported experiment-specific base n=98 | Original source [S02] Original article printed pages 1430–1431 (PDF pages 8–9), final-recipient choice paragraph |
| Expected awkwardness | 1% percent | Selected MBA students/laboratory participants and the recipients they chose; experiment-specific analysis samples Collection dates not stated in main article; publication 2018. Distinct experiments retained separately. · Reported experiment-specific base n=98 | Original source [S02] Original article printed pages 1430–1431 (PDF pages 8–9), final-recipient choice paragraph |
The preference questions in Experiment 3b were three separate choices made by the same 98 participants. Their percentages should not be added as mutually exclusive groups. Preference for a more-surprised recipient was not statistically significant in the original analysis (p=.54). The final six-way recipient choice is a separate task by those same participants.
The target categories describe how the writers expected a recipient to react. They do not establish that each chosen recipient actually felt that way. The article’s reported percentages are retained, without reconstructing more precise percentages from its rounded values or participant counts.
What did employees and leaders report about recognition?
F13 Strong agreement that the organisation’s senior leadership values employee recognition. Original 2022 and 2024 comparison values; exact item/year/subgroup bases unknown. Primary April 2024 n=4,439 and other report samples are not substituted. Repeated survey results, not a randomized recognition intervention.
| Measure / group | Published result and unit | Population, period and base | Original source |
|---|---|---|---|
| 2022 senior leaders | 28% percent | Employed U.S. adults age 18+; senior-leader subset and recognition-quality groups for selected results Primary survey April 16–30, 2024; some results May 7–21, 2024; selected 2022 comparison values retained as published · Exact selected item/group n unavailable | Original source [S03] Report printed page 7 (PDF page 9), leadership recognition paragraph |
| 2024 senior leaders | 42% percent | Employed U.S. adults age 18+; senior-leader subset and recognition-quality groups for selected results Primary survey April 16–30, 2024; some results May 7–21, 2024; selected 2022 comparison values retained as published · Exact selected item/group n unavailable | Original source [S03] Report printed page 7 (PDF page 9), leadership recognition paragraph |
F14 Reported presence of a recognition program. Original 2022 and 2024 comparison values; exact item/year/subgroup bases unknown. Primary April 2024 n=4,439 and other report samples are not substituted. Repeated survey results, not a randomized recognition intervention.
| Measure / group | Published result and unit | Population, period and base | Original source |
|---|---|---|---|
| 2022 employees | 34% percent | Employed U.S. adults age 18+; senior-leader subset and recognition-quality groups for selected results Primary survey April 16–30, 2024; some results May 7–21, 2024; selected 2022 comparison values retained as published · Exact selected item/group n unavailable | Original source [S03] Report printed page 7 (PDF page 9), recognition-program paragraph |
| 2024 employees | 40% percent | Employed U.S. adults age 18+; senior-leader subset and recognition-quality groups for selected results Primary survey April 16–30, 2024; some results May 7–21, 2024; selected 2022 comparison values retained as published · Exact selected item/group n unavailable | Original source [S03] Report printed page 7 (PDF page 9), recognition-program paragraph |
F15 Selected five-pillar measures in the original report. Exact item bases unknown. Four items use strongly agree; personalization uses yes to ever being asked a recognition preference. These are different statements/thresholds; do not add or treat as one score. Recognition is broader than thank-you notes.
| Measure / group | Published result and unit | Population, period and base | Original source |
|---|---|---|---|
| Strongly agree: right amount of recognition | 22% percent | Employed U.S. adults age 18+; senior-leader subset and recognition-quality groups for selected results Primary survey April 16–30, 2024; some results May 7–21, 2024; selected 2022 comparison values retained as published · Exact selected item/group n unavailable | Original source [S03] Report printed page 9 (PDF page 11), five directly labeled bars |
| Strongly agree: recognition is authentic | 31% percent | Employed U.S. adults age 18+; senior-leader subset and recognition-quality groups for selected results Primary survey April 16–30, 2024; some results May 7–21, 2024; selected 2022 comparison values retained as published · Exact selected item/group n unavailable | Original source [S03] Report printed page 9 (PDF page 11), five directly labeled bars |
| Strongly agree: comparable recognition at similar performance | 25% percent | Employed U.S. adults age 18+; senior-leader subset and recognition-quality groups for selected results Primary survey April 16–30, 2024; some results May 7–21, 2024; selected 2022 comparison values retained as published · Exact selected item/group n unavailable | Original source [S03] Report printed page 9 (PDF page 11), five directly labeled bars |
| Strongly agree: recognition important in culture | 17% percent | Employed U.S. adults age 18+; senior-leader subset and recognition-quality groups for selected results Primary survey April 16–30, 2024; some results May 7–21, 2024; selected 2022 comparison values retained as published · Exact selected item/group n unavailable | Original source [S03] Report printed page 9 (PDF page 11), five directly labeled bars |
| Yes: ever asked preferred recognition approach | 11% percent | Employed U.S. adults age 18+; senior-leader subset and recognition-quality groups for selected results Primary survey April 16–30, 2024; some results May 7–21, 2024; selected 2022 comparison values retained as published · Exact selected item/group n unavailable | Original source [S03] Report printed page 9 (PDF page 11), five directly labeled bars |
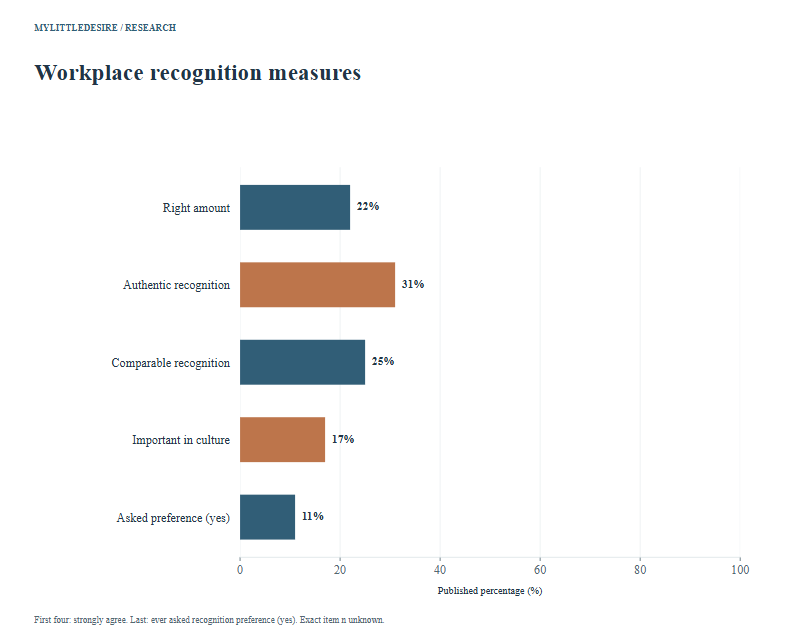
Gallup and Workhuman report that leadership valuation and the presence of recognition programs were higher in 2024 than in 2022. These repeated survey comparisons have different eligible populations: one concerns senior leaders and the other employees generally. Their exact selected bases are not given here.
Response thresholds differ. Four quality statements report strong agreement. The personalization item instead asks whether anyone had ever asked how the employee likes to be recognised. Its 11% yes response is not the percentage receiving personalized recognition, and the five figures should not be added into a combined quality score.
How did recognition quality and engagement differ?
F16 Percent engaged within each number-of-pillars-fulfilled group. Within-group engagement rates, not distribution of employees/recognition experiences across groups. Observational association, not proof a thank-you note causes engagement. Exact group n unknown.
| Measure / group | Published result and unit | Population, period and base | Original source |
|---|---|---|---|
| No pillars | 10% percent | Employed U.S. adults age 18+; senior-leader subset and recognition-quality groups for selected results Primary survey April 16–30, 2024; some results May 7–21, 2024; selected 2022 comparison values retained as published · Exact selected item/group n unavailable | Original source [S03] Report printed page 8 (PDF page 10), left engagement chart |
| One pillar | 29% percent | Employed U.S. adults age 18+; senior-leader subset and recognition-quality groups for selected results Primary survey April 16–30, 2024; some results May 7–21, 2024; selected 2022 comparison values retained as published · Exact selected item/group n unavailable | Original source [S03] Report printed page 8 (PDF page 10), left engagement chart |
| Two pillars | 57% percent | Employed U.S. adults age 18+; senior-leader subset and recognition-quality groups for selected results Primary survey April 16–30, 2024; some results May 7–21, 2024; selected 2022 comparison values retained as published · Exact selected item/group n unavailable | Original source [S03] Report printed page 8 (PDF page 10), left engagement chart |
| Three pillars | 75% percent | Employed U.S. adults age 18+; senior-leader subset and recognition-quality groups for selected results Primary survey April 16–30, 2024; some results May 7–21, 2024; selected 2022 comparison values retained as published · Exact selected item/group n unavailable | Original source [S03] Report printed page 8 (PDF page 10), left engagement chart |
| Four or five pillars | 90% percent | Employed U.S. adults age 18+; senior-leader subset and recognition-quality groups for selected results Primary survey April 16–30, 2024; some results May 7–21, 2024; selected 2022 comparison values retained as published · Exact selected item/group n unavailable | Original source [S03] Report printed page 8 (PDF page 10), left engagement chart |
The engagement figures apply within recognition-quality groups. For example, 90% is the engaged share in the four-or-five-pillars group; it is not the share of all workers receiving that kind of recognition. These observational associations do not show that sending a thank-you note causes engagement or prevents someone from leaving a job.
The report’s methodology includes a primary April 2024 sample of 4,439 employed adults and another May sample of 21,543. It also discusses a separate longitudinal turnover cohort. Those totals are kept separate, and no single report total is assigned to all selected 2022/2024 items or subgroups. Workhuman’s partnership with Gallup is disclosed in the source record.
Ten reproducible descriptive comparisons
Nine calculations subtract published percentages and report percentage points. The tenth subtracts two mean warmth ratings and reports points on the original 0–10 composite scale. Comparisons stay within a source and compatible construct; no new significance tests are performed.
| ID | Comparison | First | Second | Difference and unit | Qualification |
|---|---|---|---|---|---|
| C01 | Preferred sending format: physical minus digital | 42% | 25% | +17 percentage points | Preference, not frequency or handwritten superiority. Rounded published inputs; no new significance test. |
| C02 | Preferred receiving format: physical minus digital | 29% | 19% | +10 percentage points | Receiving preference differs from sending preference. Rounded published inputs; no new significance test. |
| C03 | Perceived prevalence: digital minus physical | 61% | 12% | +49 percentage points | Perception, not observed market share. Rounded published inputs; no new significance test. |
| C04 | Physical sending preference: age 65+ minus age 18–29 | 47% | 35% | +12 percentage points | Cross-sectional age groups; exact subgroup n unknown. Rounded published inputs; no new significance test. |
| C05 | Digital receiving preference: age 18–29 minus age 65+ | 30% | 13% | +17 percentage points | Cross-sectional age groups, not an individual aging effect. Rounded published inputs; no new significance test. |
| C06 | No receiving-format preference: age 65+ minus age 18–29 | 51% | 28% | +23 percentage points | No preference is not a rejection of notes. Rounded published inputs; no new significance test. |
| C07 | Recipient preference: expected positive mood minus no awkwardness | 88.78% | 84.69% | +4.09 percentage points | Separate choices by same 98 participants, not independent categories. Rounded published inputs; no new significance test. |
| C08 | Leadership recognition valuation: 2024 minus 2022 | 42% | 28% | +14 percentage points | Senior-leader subgroup n unknown; repeated surveys. Rounded published inputs; no new significance test. |
| C09 | Recognition program presence: 2024 minus 2022 | 40% | 34% | +6 percentage points | Exact year/item bases unknown; not a randomized intervention. Rounded published inputs; no new significance test. |
| C10 | Warmth composite: recipient report minus sender prediction | 9.54 / 10 | 8.40 / 10 | +1.14 0–10 composite points | Mean scale points on 0–10 composite; n=78 matched pairs. Not percentage points. Rounded published inputs; no new significance test. |
Common questions
Do most Americans prefer handwritten thank-you notes?
The selected survey asked physical, not handwritten. Physical was the largest sending-format category at 42%, below a majority.
Is no receiving-format preference the same as not wanting a note?
No. The survey lists those as separate answers.
Does the digital-prevalence question measure notes actually sent?
No. It asks which type people think is more common.
Are the gratitude-letter ratings percentages?
No. Mood uses −5 to +5 points; warmth and competence composites use 0–10 points.
Do these experiments prove one note format is superior?
No. The selected studies do not provide a randomized handwritten-versus-digital superiority test.
Can the first experiment’s before/after means be treated as paired change?
The reported marginal bases differ. The resource preserves those means and does not substitute their difference for the paired statistic.
Does workplace recognition mean a thank-you note?
Recognition is broader and can involve several forms of acknowledgment and organisational practice.
Does 90% engagement mean 90% receive high-quality recognition?
No. It is an engagement rate within a particular recognition-quality group.
Research method and limitations
Selection and concentration. There are 57 observations in 16 groups: YouGov 26, Kumar/Epley 17 and Gallup/Workhuman 14. These are three source collections, not three independent single studies. They include same-day question categories, age groups, multiple experiments and workplace waves. MyLittleDesire conducted no survey.
Source checking. Twenty-six public YouGov result cells were independently matched from the exact question objects in original archived HTML. Seventeen original paper values and four original Gallup prose values were independently matched. Ten directly labeled Gallup chart values were read visually. No bar-height digitisation, respondent-record audit or new significance test is claimed.
Bases and units. Fourteen rows retain a published full survey base, and seventeen retain experiment-specific reported/analysis bases. Twenty-six selected bases remain unknown. Forty-nine values are percentages and eight are mean scale points. All 57 weighted-base counts and estimate-specific confidence intervals remain unavailable; full source samples and uncertainty are not invented.
Limits. Keep preferences separate from behavior, perceptions from measured prevalence, marginal means from paired change, and workplace recognition from note-specific effects. Do not equate physical with handwritten or convert scale means into rates. Findings are context-specific, with convenience samples and selected recipient responses in the paper. No global etiquette rule, causal health claim or universal appreciation effect is inferred.
Original sources
- YouGov. Daily Questions, June 14, 2023: thank-you note sending, receiving and perceived prevalence [S01]
Published: June 14, 2023. Collection context: June 14, 2023.
Population: U.S. adults age 18+; selected overall answers and age-group breakdowns.
Full sample: 12,105. 12,105 U.S. adults printed on each of three same-day questions; not three independent samples or an exact age-group n.
Bases: Fourteen overall rows retain the published full asked base 12,105, not asserted item-complete n. Twelve age-group bases unknown; full n is not substituted.
Method: Original three archived Daily Questions and exact public result objects embedded in their HTML checked. YouGov general methods describe online nonprobability-panel sampling and weighted final Daily Questions, excluding open website/app opt-ins from the final representative release. Historical item-specific weight/count details are not supplied here.
Limits: Preferences and perceptions, not an audit of notes actually sent. Physical is not necessarily handwritten. Same-day send/receive items differ in direction and wording. Rounded categories may total 99 or 101; no normalization. Age comparisons are cross-sectional, not changes as the same person ages. Exact subgroup n, weighted base counts and estimate-specific CIs unavailable.
Supporting record 1 · Supporting record 2 · Supporting record 3 - Amit Kumar & Nicholas Epley / Psychological Science. Undervaluing Gratitude: Expressers Misunderstand the Consequences of Showing Appreciation [S02]
Published: First published June 27, 2018; September 2018 issue, 29(9), 1423–1435. Collection context: Collection dates not stated in main article; publication 2018. Distinct experiments retained separately..
Population: Selected MBA students/laboratory participants and the recipients they chose; experiment-specific analysis samples.
Full sample: No single exact full n assigned. Multi-experiment paper, not one full sample: selected mood bases 99/107 in Experiment 1 and 100 in Experiment 2; 78 matched pairs for Experiment 4 composites; 98 participants for Experiment 3b choices.
Bases: All seventeen selected experiment-specific bases retained. Experiment 1 baseline n=99 and post-writing n=107 are different reported marginal bases; not a published paired-change estimate. Composite means use 78 matched sender/recipient pairs, not all 127 recruited writers.
Method: Original published article downloaded through the author’s publication page. Selected prose statistics, scales, sample descriptions and exclusions checked. Experiments 1/2 include letter writing and mood reporting; Experiment 3b compares recipient choices; Experiment 4 compares sender predictions with recipient reports. Source graph bars are not digitized.
Limits: Convenience samples and selected recipient responses limit generalization. Baseline/post-writing and predicted/actual comparisons do not establish a universally controlled causal effect. Mood uses −5 to +5 points; competence/warmth composites use 0–10 points; means are not percentages. Gratitude letters were not exclusively handwritten, and formats were not randomized as a superiority test. Rounded competence means 9.28 and 6.99 differ by 2.29, while authors report paired miscalibration 2.28; do not substitute one for the other. Percentage choices are different tasks, not independent experiments.
Supporting record 1 · Supporting record 2 · Supporting record 3 - Gallup / Workhuman. The Human-Centered Workplace: Building Organizational Cultures That Thrive [S03]
Published: September 18, 2024. Collection context: Primary survey April 16–30, 2024; some results May 7–21, 2024; selected 2022 comparison values retained as published.
Population: Employed U.S. adults age 18+; senior-leader subset and recognition-quality groups for selected results.
Full sample: No single exact full n assigned. Report cites 4,439 primary April 2024 respondents and 21,543 in a May 2024 survey. It also discusses a separate 3,447-person 2022–2024 turnover cohort; no turnover figure selected. No single full n assigned to all selected results.
Bases: All fourteen exact item/subgroup/year bases unknown. Report-level primary totals are not substituted for senior-leader, recognition-group or 2022 bases.
Method: Original partnership report and methodology checked. Selected 2022/2024 prevalence values from prose; ten directly labeled chart values visually read. April and May Gallup Panel employed-adult surveys are separate. Partnership with recognition provider Workhuman disclosed.
Limits: Workplace recognition is broader than thank-you notes. Observational group associations do not show that a note causes engagement or retention. First four pillar items report strongly agree; personalization asks yes/no, so those thresholds differ. Engagement percentages are within recognition-quality groups, not the distribution of workers across those groups. No turnover effect or wellbeing treatment claim inferred. Item-specific intervals are not constructed from report-level margins.
Supporting record 1 · Supporting record 2
How to cite this resource
MyLittleDesire. Thank You Notes And Appreciation Statistics. https://mylittledesire.com/thank-you-notes-appreciation-statistics/.