
Online and in-person contact often belong to the same friendship. In Statistics Canada’s 2025 published distribution, 87.8% used both virtual and in-person contact in the past month. Virtual included telephone calls as well as Internet communication. The figure describes contact modes, not the share of friendships that began online. Statistics Canada [S02].
This resource brings together 79 published observations in 21 groups from four studies and three publisher labels. It separates close-friend communication, views about online relationships, online-community experiences and friend-level reports. Four charts and ten descriptive comparisons retain the original populations, units and dates.
87.8%
61%
used both virtual and in-person contact in the Canadian published past-month distribution, 2025.Original source [S02]
of U.S. close-friend holders texted at least a few times weekly in September 2024.Original source [S03]
34%
36%
thought personal relationships formed online could be just as meaningful as in-person ones in May–June 2026.Original source [S01]
of online-community members said their most-visited community had in-person gatherings in 2026.Original source [S01]
What does online versus in-person friendship mean?
A friendship’s origin, current communication methods and emotional quality are separate questions. Someone can first meet a friend at school, keep in touch by text and meet in person later. Community membership is broader still: belonging to a group does not necessarily mean having a close friend there. See our friendship statistics for wider context.
| Source | Measure | Population / unit | Actual fieldwork |
|---|---|---|---|
| Statistics Canada [S02] | Past-month contact modes and associated outcomes | Published Canadian survey populations, target age 15+; virtual includes phone | April 11–June 22, 2025 |
| Pew Research Center [S03] | Close-friend contact frequency | U.S. adult close-friend holders; people | September 3–15, 2024 |
| Pew Research Center [S01] | Personal-relationship views and online communities | All U.S. adults or community members, depending on item | May 26–June 1, 2026 |
| American Friendship Project [S04] | At-least-monthly friend communication | Reported friend ties in an adult quota sample | June 9–24, 2023 |
Also Read:-
Making Friends as an Adult Statistics 2027
Intergenerational Friendship Statistics 2027
Friendship After 50 Statistics 2027
Women Friendship Statistics 2027
Male Friendship Statistics 2027
How often do people combine virtual and in-person contact?
F10 Published distribution of friend-contact modes. Past-month published classification. Virtual includes telephone and Internet. Exact unweighted analytic n/exclusions unavailable; no reconstructed denominator or claim about where friendships began.
| Measure / group | Published result | Population, fieldwork and reported base | Original source |
|---|---|---|---|
| In-person only | 2.0% | Published Canadian friendship-communication population, survey target age 15+ in ten provinces April 11–June 22, 2025 · Exact selected analytic/subgroup n unavailable | Original source [S02] Table1 Total row, exact CSV values |
| Virtual only | 10.2% | Published Canadian friendship-communication population, survey target age 15+ in ten provinces April 11–June 22, 2025 · Exact selected analytic/subgroup n unavailable | Original source [S02] Table1 Total row, exact CSV values |
| Both in-person and virtual | 87.8% | Published Canadian friendship-communication population, survey target age 15+ in ten provinces April 11–June 22, 2025 · Exact selected analytic/subgroup n unavailable | Original source [S02] Table1 Total row, exact CSV values |

The Canadian categories refer to the preceding month. “Virtual only” does not mean a friend has never been met face to face, and “in-person only” does not mean the person never uses digital communication. The release does not supply exact analytic counts or all exclusions behind this three-way classification, so no denominator is reconstructed here.
How does virtual-only contact vary across Canadian groups?
F11 Virtual-only share within six published age groups. Past-month published classification. Virtual includes telephone and Internet. Exact unweighted analytic n/exclusions unavailable; no reconstructed denominator or claim about where friendships began. Age15–24 includes minors; cross-sectional groups, not aging trajectories.
| Measure / group | Published result | Population, fieldwork and reported base | Original source |
|---|---|---|---|
| Age 15–24 | 5.8% | Published Canadian friendship-communication population, survey target age 15+ in ten provinces, age 15–24 April 11–June 22, 2025 · Exact selected analytic/subgroup n unavailable | Original source [S02] Table1 Age group rows, virtual-only column |
| Age 25–34 | 11.8% | Published Canadian friendship-communication population, survey target age 15+ in ten provinces, age 25–34 April 11–June 22, 2025 · Exact selected analytic/subgroup n unavailable | Original source [S02] Table1 Age group rows, virtual-only column |
| Age 35–44 | 12.5% | Published Canadian friendship-communication population, survey target age 15+ in ten provinces, age 35–44 April 11–June 22, 2025 · Exact selected analytic/subgroup n unavailable | Original source [S02] Table1 Age group rows, virtual-only column |
| Age 45–54 | 12.2% | Published Canadian friendship-communication population, survey target age 15+ in ten provinces, age 45–54 April 11–June 22, 2025 · Exact selected analytic/subgroup n unavailable | Original source [S02] Table1 Age group rows, virtual-only column |
| Age 55–64 | 10.9% | Published Canadian friendship-communication population, survey target age 15+ in ten provinces, age 55–64 April 11–June 22, 2025 · Exact selected analytic/subgroup n unavailable | Original source [S02] Table1 Age group rows, virtual-only column |
| Age 65+ | 8.6% | Published Canadian friendship-communication population, survey target age 15+ in ten provinces, age 65+ April 11–June 22, 2025 · Exact selected analytic/subgroup n unavailable | Original source [S02] Table1 Age group rows, virtual-only column |
F12 Virtual-only share within published immigration groups. Past-month published classification. Virtual includes telephone and Internet. Exact unweighted analytic n/exclusions unavailable; no reconstructed denominator or claim about where friendships began. Recent means immigration in previous 10 years; no causal immigration effect.
| Measure / group | Published result | Population, fieldwork and reported base | Original source |
|---|---|---|---|
| Non-immigrant | 8.4% | Published Canadian friendship-communication population, survey target age 15+ in ten provinces, non-immigrant April 11–June 22, 2025 · Exact selected analytic/subgroup n unavailable | Original source [S02] Table1 Immigrant status rows, virtual-only column |
| Recent immigrant | 15.6% | Published Canadian friendship-communication population, survey target age 15+ in ten provinces, recent immigrant April 11–June 22, 2025 · Exact selected analytic/subgroup n unavailable | Original source [S02] Table1 Immigrant status rows, virtual-only column |
| Established immigrant | 12.7% | Published Canadian friendship-communication population, survey target age 15+ in ten provinces, established immigrant April 11–June 22, 2025 · Exact selected analytic/subgroup n unavailable | Original source [S02] Table1 Immigrant status rows, virtual-only column |
F13 Selected contact modes by total household income in Canadian dollars. Past-month published classification. Virtual includes telephone and Internet. Exact unweighted analytic n/exclusions unavailable; no reconstructed denominator or claim about where friendships began. Selected income extremes only; no income effect or significance test inferred.
| Measure / group | Published result | Population, fieldwork and reported base | Original source |
|---|---|---|---|
| Below CAD40,000 — both modes | 83.3% | Published Canadian friendship-communication population, survey target age 15+ in ten provinces, household income Below CAD40,000 April 11–June 22, 2025 · Exact selected analytic/subgroup n unavailable | Original source [S02] Table1 Total household income rows, both/virtual columns |
| Below CAD40,000 — virtual only | 13.6% | Published Canadian friendship-communication population, survey target age 15+ in ten provinces, household income Below CAD40,000 April 11–June 22, 2025 · Exact selected analytic/subgroup n unavailable | Original source [S02] Table1 Total household income rows, both/virtual columns |
| CAD150,000 or more — both modes | 90.4% | Published Canadian friendship-communication population, survey target age 15+ in ten provinces, household income CAD150,000 or more April 11–June 22, 2025 · Exact selected analytic/subgroup n unavailable | Original source [S02] Table1 Total household income rows, both/virtual columns |
| CAD150,000 or more — virtual only | 8.8% | Published Canadian friendship-communication population, survey target age 15+ in ten provinces, household income CAD150,000 or more April 11–June 22, 2025 · Exact selected analytic/subgroup n unavailable | Original source [S02] Table1 Total household income rows, both/virtual columns |
The age, immigration and income rows compare different surveyed groups at one point in time. They do not show how a particular person’s friendships changed with age, immigration or income. Income labels refer to total household income in Canadian dollars.
How is contact mode associated with satisfaction and support?
F14 Satisfied or very satisfied with friendships. Cross-sectional association, not a causal effect of contact mode. Rounded original prose percentages retained. In-person-only outcomes not provided because of small numbers.
| Measure / group | Published result | Population, fieldwork and reported base | Original source |
|---|---|---|---|
| Both virtual and in-person contact | 87% | Published Canadian friendship-communication population, survey target age 15+ in ten provinces, both virtual and in-person contact April 11–June 22, 2025 · Exact selected analytic/subgroup n unavailable | Original source [S02] Release section Poorer relationship satisfaction, respective outcome paragraph |
| Virtual-only contact | 63% | Published Canadian friendship-communication population, survey target age 15+ in ten provinces, virtual-only contact April 11–June 22, 2025 · Exact selected analytic/subgroup n unavailable | Original source [S02] Release section Poorer relationship satisfaction, respective outcome paragraph |
F15 Always or often having people to depend on. Cross-sectional association, not a causal effect of contact mode. Rounded original prose percentages retained. In-person-only outcomes not provided because of small numbers.
| Measure / group | Published result | Population, fieldwork and reported base | Original source |
|---|---|---|---|
| Both virtual and in-person contact | 79% | Published Canadian friendship-communication population, survey target age 15+ in ten provinces, both virtual and in-person contact April 11–June 22, 2025 · Exact selected analytic/subgroup n unavailable | Original source [S02] Release section Poorer relationship satisfaction, respective outcome paragraph |
| Virtual-only contact | 61% | Published Canadian friendship-communication population, survey target age 15+ in ten provinces, virtual-only contact April 11–June 22, 2025 · Exact selected analytic/subgroup n unavailable | Original source [S02] Release section Poorer relationship satisfaction, respective outcome paragraph |
F16 Always or often feeling lonely. Cross-sectional association, not a causal effect of contact mode. Rounded original prose percentages retained. In-person-only outcomes not provided because of small numbers.
| Measure / group | Published result | Population, fieldwork and reported base | Original source |
|---|---|---|---|
| Both virtual and in-person contact | 15% | Published Canadian friendship-communication population, survey target age 15+ in ten provinces, both virtual and in-person contact April 11–June 22, 2025 · Exact selected analytic/subgroup n unavailable | Original source [S02] Release section Poorer relationship satisfaction, respective outcome paragraph |
| Virtual-only contact | 24% | Published Canadian friendship-communication population, survey target age 15+ in ten provinces, virtual-only contact April 11–June 22, 2025 · Exact selected analytic/subgroup n unavailable | Original source [S02] Release section Poorer relationship satisfaction, respective outcome paragraph |
Association is not direction. Contact mode may relate to distance, health, satisfaction and other circumstances. The study does not show that switching a person’s contact mode would cause the observed differences. The publisher does not report these outcomes for the in-person-only group because numbers were small.
The dependable-people outcome is broader than support from friends alone. Loneliness is also distinct from the number or origin of friendships; see our loneliness statistics for those definitions.
How do U.S. adults communicate with close friends?
F17 At least daily or a few times weekly with at least one close friend. Overlapping modes, not preferences. Original chart NETs retained rather than sums of rounded topline components.
| Measure / group | Published result | Population, fieldwork and reported base | Original source |
|---|---|---|---|
| Text messaging | 61% | U.S. adults with at least one close friend, excluding family September 3–15, 2024 · Published full/route n=5,107 | Original source [S03] Original report printed13 / PDF14, chart2-03 frequent-contact NETs |
| Social media | 39% | U.S. adults with at least one close friend, excluding family September 3–15, 2024 · Published full/route n=5,107 | Original source [S03] Original report printed13 / PDF14, chart2-03 frequent-contact NETs |
| Phone or video chat | 35% | U.S. adults with at least one close friend, excluding family September 3–15, 2024 · Published full/route n=5,107 | Original source [S03] Original report printed13 / PDF14, chart2-03 frequent-contact NETs |
| Seeing friends in person | 29% | U.S. adults with at least one close friend, excluding family September 3–15, 2024 · Published full/route n=5,107 | Original source [S03] Original report printed13 / PDF14, chart2-03 frequent-contact NETs |

F18 At least daily or a few times weekly within close-friend-holding gender groups. Exact COMMFRI gender-route bases unavailable. Full gender study samples are not substituted. Published chart NETs retained, not rounded-category sums.
| Measure / group | Published result | Population, fieldwork and reported base | Original source |
|---|---|---|---|
| Text messaging — men | 56% | U.S. adults with at least one close friend, excluding family, men September 3–15, 2024 · Exact selected analytic/subgroup n unavailable | Original source [S03] Original report printed13 / PDF14, chart2-03 gender frequent-contact NETs |
| Text messaging — women | 66% | U.S. adults with at least one close friend, excluding family, women September 3–15, 2024 · Exact selected analytic/subgroup n unavailable | Original source [S03] Original report printed13 / PDF14, chart2-03 gender frequent-contact NETs |
| Social media — men | 33% | U.S. adults with at least one close friend, excluding family, men September 3–15, 2024 · Exact selected analytic/subgroup n unavailable | Original source [S03] Original report printed13 / PDF14, chart2-03 gender frequent-contact NETs |
| Social media — women | 45% | U.S. adults with at least one close friend, excluding family, women September 3–15, 2024 · Exact selected analytic/subgroup n unavailable | Original source [S03] Original report printed13 / PDF14, chart2-03 gender frequent-contact NETs |
| Phone or video chat — men | 32% | U.S. adults with at least one close friend, excluding family, men September 3–15, 2024 · Exact selected analytic/subgroup n unavailable | Original source [S03] Original report printed13 / PDF14, chart2-03 gender frequent-contact NETs |
| Phone or video chat — women | 38% | U.S. adults with at least one close friend, excluding family, women September 3–15, 2024 · Exact selected analytic/subgroup n unavailable | Original source [S03] Original report printed13 / PDF14, chart2-03 gender frequent-contact NETs |
| Seeing friends in person — men | 31% | U.S. adults with at least one close friend, excluding family, men September 3–15, 2024 · Exact selected analytic/subgroup n unavailable | Original source [S03] Original report printed13 / PDF14, chart2-03 gender frequent-contact NETs |
| Seeing friends in person — women | 28% | U.S. adults with at least one close friend, excluding family, women September 3–15, 2024 · Exact selected analytic/subgroup n unavailable | Original source [S03] Original report printed13 / PDF14, chart2-03 gender frequent-contact NETs |
F19 Published at-least-once-daily category in the contact-frequency battery. Modes overlap. Daily rows are nested within frequent-contact NETs; do not add categories from different groups. A never response does not mean no close friends.
| Measure / group | Published result | Population, fieldwork and reported base | Original source |
|---|---|---|---|
| Text messaging | 25% | U.S. adults with at least one close friend, excluding family September 3–15, 2024 · Published full/route n=5,107 | Original source [S03] COMMFRI a–d Total column, topline printed3 / PDF3 |
| Social media | 16% | U.S. adults with at least one close friend, excluding family September 3–15, 2024 · Published full/route n=5,107 | Original source [S03] COMMFRI a–d Total column, topline printed3 / PDF3 |
| Phone or video chat | 11% | U.S. adults with at least one close friend, excluding family September 3–15, 2024 · Published full/route n=5,107 | Original source [S03] COMMFRI a–d Total column, topline printed3 / PDF3 |
| Seeing friends in person | 7% | U.S. adults with at least one close friend, excluding family September 3–15, 2024 · Published full/route n=5,107 | Original source [S03] COMMFRI a–d Total column, topline printed3 / PDF3 |
F20 Published never category in the contact-frequency battery. Modes overlap. Daily rows are nested within frequent-contact NETs; do not add categories from different groups. A never response does not mean no close friends.
| Measure / group | Published result | Population, fieldwork and reported base | Original source |
|---|---|---|---|
| Text messaging | 4% | U.S. adults with at least one close friend, excluding family September 3–15, 2024 · Published full/route n=5,107 | Original source [S03] COMMFRI a–d Total column, topline printed3 / PDF3 |
| Social media | 24% | U.S. adults with at least one close friend, excluding family September 3–15, 2024 · Published full/route n=5,107 | Original source [S03] COMMFRI a–d Total column, topline printed3 / PDF3 |
| Phone or video chat | 7% | U.S. adults with at least one close friend, excluding family September 3–15, 2024 · Published full/route n=5,107 | Original source [S03] COMMFRI a–d Total column, topline printed3 / PDF3 |
| Seeing friends in person | 3% | U.S. adults with at least one close friend, excluding family September 3–15, 2024 · Published full/route n=5,107 | Original source [S03] COMMFRI a–d Total column, topline printed3 / PDF3 |
These modes can overlap within a person’s week. Texting more frequently than meeting does not establish that texting is preferred or emotionally better. The original chart reports the weekly NETs from the underlying analysis. They are preserved here: adding rounded daily and few-times-weekly text values would give a different total for all respondents and men.
Can online relationships be as meaningful as in-person ones?
F01 Views about personal relationships formed online versus in person. Personal relationships broadly, not friendship-only outcomes. Published categories may not total 100; no normalization.
| Measure / group | Published result | Population, fieldwork and reported base | Original source |
|---|---|---|---|
| Can be just as meaningful | 34% | U.S. adults age 18+ May 26–June 1, 2026 · Published full/route n=9,750 | Original source [S01] ONVSOFF, topline printed39 / PDF2 |
| Not as meaningful | 47% | U.S. adults age 18+ May 26–June 1, 2026 · Published full/route n=9,750 | Original source [S01] ONVSOFF, topline printed39 / PDF2 |
| Not sure | 20% | U.S. adults age 18+ May 26–June 1, 2026 · Published full/route n=9,750 | Original source [S01] ONVSOFF, topline printed39 / PDF2 |
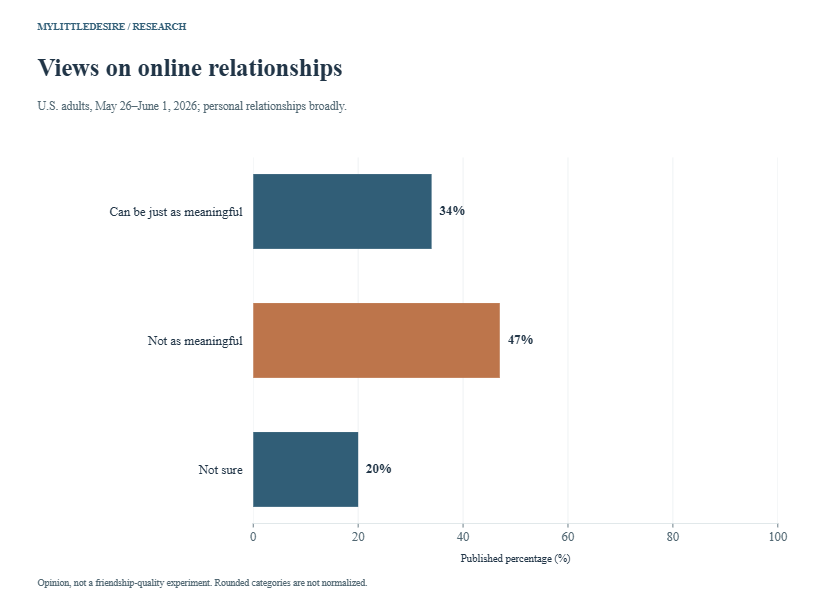
This is a question about what people think personal relationships formed online can be like. It does not test whether two matched friendships have equal quality, and its wording extends beyond friendship. The published rounded response values are retained without forcing a total of 100%.
How do online communities connect with offline life?
F02 Self-reported feeling part of any online community. Membership does not establish an online friendship or close tie. Unshown no-answer less than 0.5 is not zero.
| Measure / group | Published result | Population, fieldwork and reported base | Original source |
|---|---|---|---|
| Part of an online community | 36% | U.S. adults age 18+ May 26–June 1, 2026 · Published full/route n=9,750 | Original source [S01] OC1, topline printed39 / PDF2 |
| Not part of one | 63% | U.S. adults age 18+ May 26–June 1, 2026 · Published full/route n=9,750 | Original source [S01] OC1, topline printed39 / PDF2 |
F03 Closeness to people in the most-visited community. Printed member route n=3,635, not all U.S. adults or confirmed item-complete n. No new combined closeness NET.
| Measure / group | Published result | Population, fieldwork and reported base | Original source |
|---|---|---|---|
| Extremely close | 5% | U.S. online-community members, most-visited community May 26–June 1, 2026 · Published full/route n=3,635 | Original source [S01] OCCLS, topline printed43 / PDF6 |
| Very close | 13% | U.S. online-community members, most-visited community May 26–June 1, 2026 · Published full/route n=3,635 | Original source [S01] OCCLS, topline printed43 / PDF6 |
| Somewhat close | 37% | U.S. online-community members, most-visited community May 26–June 1, 2026 · Published full/route n=3,635 | Original source [S01] OCCLS, topline printed43 / PDF6 |
| Not too close | 31% | U.S. online-community members, most-visited community May 26–June 1, 2026 · Published full/route n=3,635 | Original source [S01] OCCLS, topline printed43 / PDF6 |
| Not at all close | 14% | U.S. online-community members, most-visited community May 26–June 1, 2026 · Published full/route n=3,635 | Original source [S01] OCCLS, topline printed43 / PDF6 |
F04 People known before participation in the most-visited community. Knowing people previously does not establish that new friends were made there. Separate categories, no newly derived NET.
| Measure / group | Published result | Population, fieldwork and reported base | Original source |
|---|---|---|---|
| All | 5% | U.S. online-community members, most-visited community May 26–June 1, 2026 · Published full/route n=3,635 | Original source [S01] OCKNOW, topline printed46 / PDF9 |
| Most | 9% | U.S. online-community members, most-visited community May 26–June 1, 2026 · Published full/route n=3,635 | Original source [S01] OCKNOW, topline printed46 / PDF9 |
| Some | 17% | U.S. online-community members, most-visited community May 26–June 1, 2026 · Published full/route n=3,635 | Original source [S01] OCKNOW, topline printed46 / PDF9 |
| Very few | 23% | U.S. online-community members, most-visited community May 26–June 1, 2026 · Published full/route n=3,635 | Original source [S01] OCKNOW, topline printed46 / PDF9 |
| None | 45% | U.S. online-community members, most-visited community May 26–June 1, 2026 · Published full/route n=3,635 | Original source [S01] OCKNOW, topline printed46 / PDF9 |
F05 Whether the most-visited community ever has in-person gatherings. Availability of gatherings, not respondent attendance or a friendship conversion rate. Not-sure response retained.
| Measure / group | Published result | Population, fieldwork and reported base | Original source |
|---|---|---|---|
| Has in-person gatherings | 36% | U.S. online-community members, most-visited community May 26–June 1, 2026 · Published full/route n=3,635 | Original source [S01] OCOFF, topline printed47 / PDF10 |
| Does not have gatherings | 42% | U.S. online-community members, most-visited community May 26–June 1, 2026 · Published full/route n=3,635 | Original source [S01] OCOFF, topline printed47 / PDF10 |
| Not sure | 21% | U.S. online-community members, most-visited community May 26–June 1, 2026 · Published full/route n=3,635 | Original source [S01] OCOFF, topline printed47 / PDF10 |
F06 Perceived availability of a similar space elsewhere. Perception of community uniqueness, not proof that offline friends or alternatives are absent.
| Measure / group | Published result | Population, fieldwork and reported base | Original source |
|---|---|---|---|
| Could only find this online | 63% | U.S. online-community members, most-visited community May 26–June 1, 2026 · Published full/route n=3,635 | Original source [S01] OCUNIQUE, topline printed43 / PDF6 |
| Could find something similar elsewhere | 36% | U.S. online-community members, most-visited community May 26–June 1, 2026 · Published full/route n=3,635 | Original source [S01] OCUNIQUE, topline printed43 / PDF6 |
F07 Importance of this reason for visiting the most-visited community. Motivation, not observed friend formation or support received. Retain major/minor/not-a-reason separately.
| Measure / group | Published result | Population, fieldwork and reported base | Original source |
|---|---|---|---|
| Major reason | 13% | U.S. online-community members, most-visited community May 26–June 1, 2026 · Published full/route n=3,635 | Original source [S01] OCWHY_PPL, topline printed44 / PDF7 |
| Minor reason | 30% | U.S. online-community members, most-visited community May 26–June 1, 2026 · Published full/route n=3,635 | Original source [S01] OCWHY_PPL, topline printed44 / PDF7 |
| Not a reason | 57% | U.S. online-community members, most-visited community May 26–June 1, 2026 · Published full/route n=3,635 | Original source [S01] OCWHY_PPL, topline printed44 / PDF7 |
F08 Importance of this reason for visiting the most-visited community. Motivation, not observed friend formation or support received. Retain major/minor/not-a-reason separately.
| Measure / group | Published result | Population, fieldwork and reported base | Original source |
|---|---|---|---|
| Major reason | 26% | U.S. online-community members, most-visited community May 26–June 1, 2026 · Published full/route n=3,635 | Original source [S01] OCWHY_SUP, topline printed44 / PDF7 |
| Minor reason | 37% | U.S. online-community members, most-visited community May 26–June 1, 2026 · Published full/route n=3,635 | Original source [S01] OCWHY_SUP, topline printed44 / PDF7 |
| Not a reason | 36% | U.S. online-community members, most-visited community May 26–June 1, 2026 · Published full/route n=3,635 | Original source [S01] OCWHY_SUP, topline printed44 / PDF7 |
F09 Visit frequency for the most-visited community. Visiting is not posting, interacting with a close friend, or meeting someone. These rates use member denominator, not all adults.
| Measure / group | Published result | Population, fieldwork and reported base | Original source |
|---|---|---|---|
| Several times daily | 27% | U.S. online-community members, most-visited community May 26–June 1, 2026 · Published full/route n=3,635 | Original source [S01] OCFREQ member rows, topline printed43 / PDF6 |
| About once daily | 29% | U.S. online-community members, most-visited community May 26–June 1, 2026 · Published full/route n=3,635 | Original source [S01] OCFREQ member rows, topline printed43 / PDF6 |
| Several times weekly | 26% | U.S. online-community members, most-visited community May 26–June 1, 2026 · Published full/route n=3,635 | Original source [S01] OCFREQ member rows, topline printed43 / PDF6 |
| Several times monthly | 12% | U.S. online-community members, most-visited community May 26–June 1, 2026 · Published full/route n=3,635 | Original source [S01] OCFREQ member rows, topline printed43 / PDF6 |
| Less often | 6% | U.S. online-community members, most-visited community May 26–June 1, 2026 · Published full/route n=3,635 | Original source [S01] OCFREQ member rows, topline printed43 / PDF6 |
Community follow-ups focus on the space a member visits most. In-person gatherings indicate an opportunity the community provides; the question does not establish that the respondent attended. Reasons for visiting measure motivation, while closeness measures a reported feeling. Neither should be relabeled as the number who made a new friend.
What do monthly friend-level reports show?
F21 Published at-least-once-a-month share for reported friend ties, recalled over the past year. Friend N=10,288 is a tie-level table base, not unique respondents. Full adult n=2,243. Overlapping modes; quota sample, clustered ties and potentially family/partner friends. No cross-study weekly-versus-monthly comparison.
| Measure / group | Published result | Population, fieldwork and reported base | Original source |
|---|---|---|---|
| In person | 64.8% | Reported friend ties in 2023 U.S. adult quota sample June 9–24, 2023 · Published friend-report table n=10,288 | Original source [S04] Original Table 10, 2023 SCRI At Least Once a Month column and friend-N footnote |
| Voice calls | 58.6% | Reported friend ties in 2023 U.S. adult quota sample June 9–24, 2023 · Published friend-report table n=10,288 | Original source [S04] Original Table 10, 2023 SCRI At Least Once a Month column and friend-N footnote |
| Video calls | 35.0% | Reported friend ties in 2023 U.S. adult quota sample June 9–24, 2023 · Published friend-report table n=10,288 | Original source [S04] Original Table 10, 2023 SCRI At Least Once a Month column and friend-N footnote |
| Text messaging | 74.0% | Reported friend ties in 2023 U.S. adult quota sample June 9–24, 2023 · Published friend-report table n=10,288 | Original source [S04] Original Table 10, 2023 SCRI At Least Once a Month column and friend-N footnote |
| Social media | 60.8% | Reported friend ties in 2023 U.S. adult quota sample June 9–24, 2023 · Published friend-report table n=10,288 | Original source [S04] Original Table 10, 2023 SCRI At Least Once a Month column and friend-N footnote |
| 23.5% | Reported friend ties in 2023 U.S. adult quota sample June 9–24, 2023 · Published friend-report table n=10,288 | Original source [S04] Original Table 10, 2023 SCRI At Least Once a Month column and friend-N footnote |
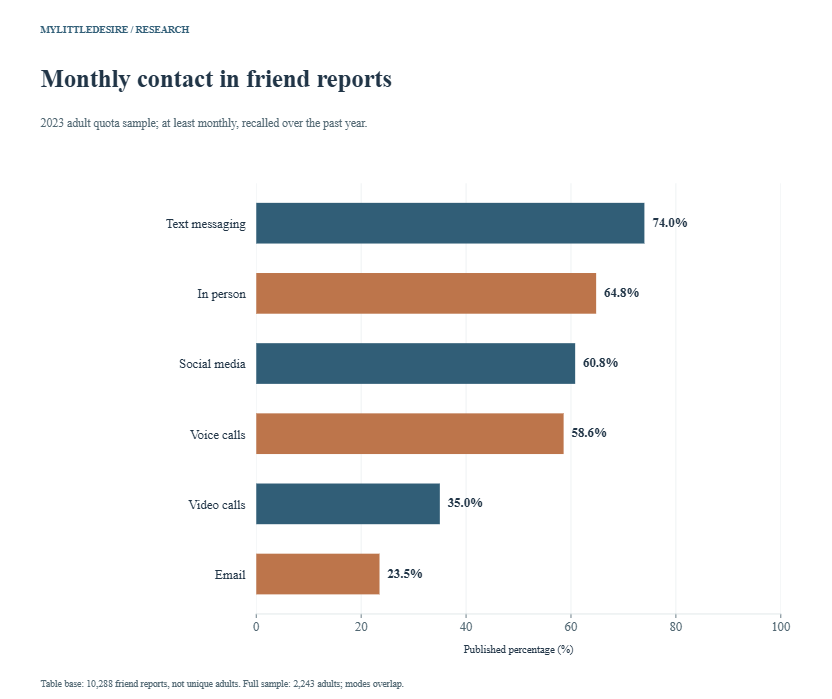
The American Friendship Project table uses a different unit: reported friend ties. Multiple ties can come from one respondent, and the paper allows family or partners within friendship networks. Its monthly percentages therefore cannot be subtracted from Pew’s weekly adult percentages to describe a change over time. Only the 2023 adult column is selected; 2022 and student results are excluded.
Ten reproducible descriptive comparisons
The following calculations subtract the second published percentage from the first. They use percentage points and rounded inputs. Each comparison stays within one source and compatible measure.
| ID | Comparison | First | Second | Difference | Qualification |
|---|---|---|---|---|---|
| C01 | Canada both modes minus virtual only | 87.8% | 10.2% | +77.6 percentage points | Published past-month categories; virtual includes phone. Rounded published inputs; no new significance test. |
| C02 | U.S. frequent texting minus in-person contact | 61% | 29% | +32 percentage points | Overlapping modes among close-friend holders, not preference. Rounded published inputs; no new significance test. |
| C03 | Online relationships equally meaningful minus less meaningful | 34% | 47% | -13 percentage points | Views about personal relationships broadly, not measured friendship quality. Rounded published inputs; no new significance test. |
| C04 | Canada friendship satisfaction: both modes minus virtual only | 87% | 63% | +24 percentage points | Association only; no causal improvement. Rounded published inputs; no new significance test. |
| C05 | Canada dependable people: both modes minus virtual only | 79% | 61% | +18 percentage points | Association only; not necessarily support from friends alone. Rounded published inputs; no new significance test. |
| C06 | Canada frequent loneliness: virtual only minus both modes | 24% | 15% | +9 percentage points | Association only; no causal harm estimate. Rounded published inputs; no new significance test. |
| C07 | Canada virtual-only contact: recent immigrants minus non-immigrants | 15.6% | 8.4% | +7.2 percentage points | Different published immigration groups; no causal or significance claim. Rounded published inputs; no new significance test. |
| C08 | Adult friend reports: monthly texting minus in-person contact | 74.0% | 64.8% | +9.2 percentage points | Friend-report table base, not unique adults. Modes overlap. Rounded published inputs; no new significance test. |
| C09 | Online community gatherings: yes minus no | 36% | 42% | -6 percentage points | Availability, not attendance or conversion to friendship. Rounded published inputs; no new significance test. |
| C10 | U.S. frequent texting: women minus men | 66% | 56% | +10 percentage points | Published chart NETs; exact gender-route bases unavailable. Rounded published inputs; no new significance test. |
Common questions
Are online friends less meaningful than in-person friends?
The selected meaningfulness survey measures public views about personal relationships broadly. It does not establish a universal quality difference between online and in-person friendships.
Do most people choose either digital or in-person contact?
The Canadian published distribution shows that combining modes was common. The meaning of virtual includes telephone, and the result concerns the past month.
Does virtual-only mean the friendship began online?
No. A person can keep in touch remotely with someone first met in person. Communication mode and friendship origin are different variables.
Does frequent texting show that people prefer it?
No. Contact frequency does not establish preference, closeness or satisfaction.
Does attending online communities mean having online friends?
No. Community membership can involve information, entertainment and other purposes. The selected community results do not count online friendships.
Can the monthly American Friendship Project rates be compared directly with Pew’s weekly rates?
No. The threshold, sample, friendship definition and unit differ. The former table uses friend reports; the latter uses adults with close friends.
Does in-person contact cause better friendship satisfaction?
The Canadian results are associations. They do not establish causation or tell us what would happen if one person changed contact mode.
Research method and limitations
Selection and independence. The 79 observations form 21 groups: Pew 2026 contributes 31, Statistics Canada 2025 contributes 22, Pew’s 2024 fieldwork contributes 20 and AFP 2023 contributes six. There are four studies and three publisher labels. Pew contributes 51 observations across two studies. Related categories, subgroups and reused chart/calculation inputs are not independent studies. MyLittleDesire conducted no survey.
Verification. Original reports, tables, questions and methods were checked. Pew 2026’s selected topline cells, Canada’s selected CSV cells, Pew 2024’s selected daily/never cells and AFP’s 2023 Table 10 values were independently matched. Published Pew weekly NETs were checked in the original chart, and Canadian outcome percentages in the original release. No respondent-record audit is claimed.
Bases and uncertainty. Forty-nine observations retain a published full, route or friend-report table base; 30 exact selected analytic/subgroup bases remain unknown. Route/table counts are not asserted to be every item-complete sample. No selected weighted-base counts or estimate confidence intervals are supplied here. Full study totals stay separate. Canada’s full achieved n was unavailable in the checked release/table/methods page. Missing counts stay blank, not zero.
Definitions. Canada’s target includes age 15+ in ten provinces, with stated exclusions. Virtual includes telephone and Internet. Pew 2024 excludes family from close friends and uses weekly person-level contact. Pew 2026’s relationships item is broader than friendship, and its community follow-ups use member routes. AFP uses an adult quota sample, monthly friend reports and a broader friend definition. Preserve these distinctions before quoting or comparing.
Limits and updates. No global rate, country ranking, causal benefit or harm, new significance test, raw respondent count, renormalized category or 2027 fieldwork is inferred. Suppressed and caution-flagged Canadian cells are not selected. Keep original NETs and source precision. Recheck definitions, routes, dates and units before replacing values in future editions.
Original sources
- Pew Research Center. Online Community and Connection in America [S01]
Published: October 14, 2026. Actual fieldwork: May 26–June 1, 2026.
Population: Noninstitutionalized U.S. adults age 18+; community follow-ups among online-community members.
Full sample: 9,750. 9,750 adult respondents overall; published community-member question base 3,635.
Bases: Five selected all-adult observations use full published base 9,750. Twenty-six member follow-up observations use printed route base 3,635, not necessarily every item-complete n. Weighted base counts unavailable.
Method: American Trends Panel probability recruitment, weighted to U.S. adults. SSRS collected 9,464 web and 286 live-phone interviews in English/Spanish. Survey-level response 87%; cumulative response 3%. Original report, topline, questionnaire and methods checked.
Limits: Meaningfulness item concerns personal relationships broadly, not friendship only. Community membership, visits, support motives and closeness are distinct from having online friends. Follow-ups refer to the most-visited community except OC1 membership. Published rounded categories need not total 100. No causal effects, new NETs or subgroup intervals.
Supporting record 1 · Supporting record 2 · Supporting record 3 - Statistics Canada. Disconnect to reconnect? How technology is reshaping how Canadians connect with friends, 2025 [S02]
Published: October 24, 2025. Actual fieldwork: April 11–June 22, 2025.
Population: Survey target age 15+ in private dwellings in ten provinces; selected published friendship-communication populations.
Full sample: Unavailable in checked release/table/methods page. Full achieved respondent count and selected item/subgroup counts not supplied in the checked release, table or methods page. Counts are unavailable, not zero.
Bases: Exact unweighted analytic bases and exclusions for the published three-way communication classification are not specified in the release. No denominator reconstructed. Age 15–24 includes minors. Territories, institutions/certain collectives and First Nations reserves/settlements excluded.
Method: SSC-WC 2025 cross-sectional stratified simple random sample using Census/immigration frames, with racialized/immigrant oversampling. Electronic/telephone voluntary responses; weighting, nonresponse adjustment/calibration and two-phase bootstrap variance. Published response rate 30.8%. Original release, Table 1 CSV/HTML and survey methods checked.
Limits: Virtual includes telephone/cellular calls and Internet communication, not Internet-only friendship. Past month records contact modes, not where friends first met, total friendship quality, screen time or exclusivity over a lifetime. Associations do not imply causation. Table 1 exact one-decimal values retained instead of rounded prose duplicates. Selected well-being outcomes are rounded prose values; in-person-only outcome estimates withheld by publisher for small numbers.
Supporting record 1 · Supporting record 2 · Supporting record 3 - Pew Research Center. Men, Women and Social Connections — communicating with close friends [S03]
Published: January 16, 2025. Actual fieldwork: September 3–15, 2024.
Population: U.S. adults with at least one close friend, excluding family from the close-friend definition.
Full sample: 6,204. 6,204 U.S. adults overall. COMMFRI printed eligible base 5,107 close-friend holders. Exact male/female COMMFRI bases not printed.
Bases: Twelve selected overall communication rows retain printed route n=5,107. Eight gender-specific communication bases unavailable, not replaced by full gender sample sizes. Weighted counts unavailable.
Method: Weighted probability-based American Trends Panel plus SSRS Opinion Panel Black/Hispanic oversample; web/live-phone interviewing. Original full report, chart, topline and methods checked. Published frequent-contact NETs retained from original report chart.
Limits: Frequent means at least once daily or a few times weekly. Modes overlap and are not preferences or friendship origins. Frequent NETs use original unrounded analysis: total text 61 differs from rounded 25+35, men 56 differs from 21+34. Keep published NETs rather than recomputing. Daily/never are nested within the same frequency distributions. Phone/video combined is not Internet-only.
Supporting record 1 · Supporting record 2 · Supporting record 3 - American Friendship Project. The American Friendship Project — 2023 adult sample, Table 10 communication [S04]
Published: July 30, 2024. Actual fieldwork: June 9–24, 2023.
Population: Reported friend ties in the 2023 U.S. adult quota sample.
Full sample: 2,243. 2,243 retained adult respondents; Table 10 reports 2023 Friend N=10,288. Friend reports are not 10,288 unique adult respondents.
Bases: Six selected Table 10 rows retain the published friend-report base 10,288. Exact item-complete base not separately supplied. Sample size 2,243 stays separate from friend-level reports.
Method: Peer-reviewed PLOS article/manuscript XML checked, including Table 10 cells/footnote and 2023 sample methods. Siena College Research Institute/Lucid quota recruitment with screening. Not a nationally representative probability sample. Only 2023 adult sample selected.
Limits: Monthly threshold uses past-year recalled communication frequency for named ties. Modes overlap and ties cluster within respondents. Friend definition can include family or partners, unlike Pew close-friend definition. Do not call these percentages of all U.S. adults, combine with Pew weekly person-level figures, infer preferences, or treat student/2022 columns as 2023.
Supporting record 1
How to cite this resource
MyLittleDesire. Online vs In-Person Friendship Statistics 2027. https://mylittledesire.com/online-vs-in-person-friendship-statistics/.