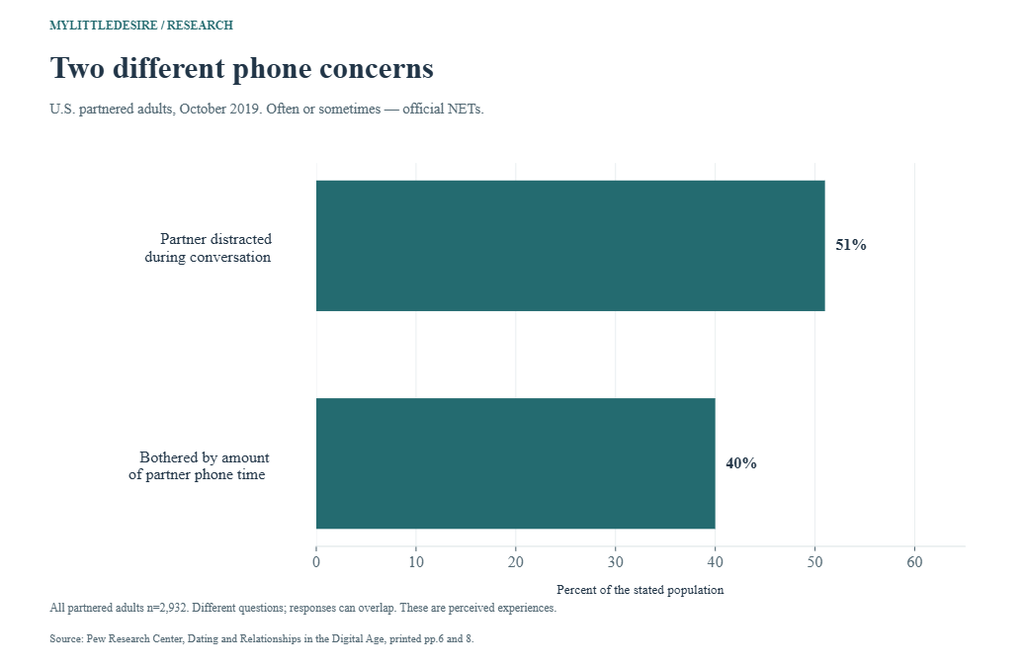
Phone distraction in a relationship can mean an interrupted conversation, feeling bothered by a partner’s screen time, or using a phone while physically together. Those measures answer different questions. In Pew’s October 2019 US survey, 51% of partnered adults said their partner was often or sometimes distracted by a cellphone during conversation, while 40% were often or sometimes bothered by the amount of partner phone time. Pew Research Center [S01].
This resource brings together 65 published observations in 20 grouped findings, with four charts and original-source links. Six research records contribute observations; a further review provides qualitative context and two organizations provide practical guidance. The evidence includes 60 percentages, two daily-use means, two correlations and one approximate verbal proportion.
51%
40%
Partner often or sometimes distracted by a cellphone during conversation.US partnered adults; October 2019. Pew Research Center [S01]
Often or sometimes bothered by how much time a partner spends on a phone.US partnered adults; October 2019. Official NET. Pew Research Center [S01]
62%
27.75%
Respondents aged 30–49 reporting often/sometimes conversation distraction.US partnered subgroup; October 2019. Pew Research Center [S01]
Mean phone-use share of awake time physically around a partner in a selected infant-parent sample.US selected sample n=247; calendar dates unreported; published 2025. McDaniel, Uva, Cornet and Drouin [S03]
What counts as phone distraction or partner phubbing?
Partner phubbing describes attending to a phone in a way that leaves a romantic partner feeling ignored. A survey about distraction, a phubbing scale and a device log are not interchangeable. A phone may also be used for shared planning, work, caregiving or communication with the partner; a log alone cannot identify the purpose or effect. Pew’s question definitions [S01]; objective-study measurement [S03].
| Measure | What the selected evidence describes | What it cannot establish |
|---|---|---|
| Perceived conversation distraction | Respondent says partner is distracted during attempts to talk. | An independently observed incident count. |
| Bothered by partner phone time | Respondent’s reaction to the amount of phone use. | The same people or same experiences as conversation distraction. |
| Phone use around a partner | Logs matched to diary-reported awake physical proximity. | That conversation was occurring or attention was withheld. |
| Checking a phone on a date | Reported checking frequency with a current or prospective partner. | A prevalence estimate exclusively for established couples. |
| Self-attributed breakup reason | A respondent associates a past relationship ending with phubbing. | The causal share of all breakups or an annual risk. |
ALSO READ:-
Relationship Arguments And Conflict Statistics 2027
First Date Safety Statistics 2027
How Couples Meet Statistics 2027
Dating After Divorce Statistics 2027
Dating Over 50 Statistics 2027
How common is phone distraction during a conversation?
Use the official often/sometimes NET when describing the headline result. The frequency categories and NET are shown together below for traceability; the NET repeats two categories and is not another slice of a distribution. Pew Research Center [S01].
F01 How often respondents say their partner is distracted by a cellphone when they are trying to have a conversation. Report percentages among all partnered adults n=2,932; phone-owning-partner answering n=2,850. The four displayed frequency categories total 96%; no complement is invented. The NET repeats often/sometimes, rather than adding a fifth category.
| Measure / group | Published result | Population and actual period | Original source |
|---|---|---|---|
| Often | 16% | US adults married, cohabiting or in a committed relationship; casual relationships excluded Eligible n=2,932. 2019-10-16 to 2019-10-28 | Original source [S01] Original report printed p.8 (physical p.9), overall frequency row and NET |
| Sometimes | 35% | US adults married, cohabiting or in a committed relationship; casual relationships excluded Eligible n=2,932. 2019-10-16 to 2019-10-28 | Original source [S01] Original report printed p.8 (physical p.9), overall frequency row and NET |
| Rarely | 30% | US adults married, cohabiting or in a committed relationship; casual relationships excluded Eligible n=2,932. 2019-10-16 to 2019-10-28 | Original source [S01] Original report printed p.8 (physical p.9), overall frequency row and NET |
| Never | 15% | US adults married, cohabiting or in a committed relationship; casual relationships excluded Eligible n=2,932. 2019-10-16 to 2019-10-28 | Original source [S01] Original report printed p.8 (physical p.9), overall frequency row and NET |
| Often or sometimes — official NET | 51% | US adults married, cohabiting or in a committed relationship; casual relationships excluded Eligible n=2,932. 2019-10-16 to 2019-10-28 | Original source [S01] Original report printed p.8 (physical p.9), overall frequency row and NET |
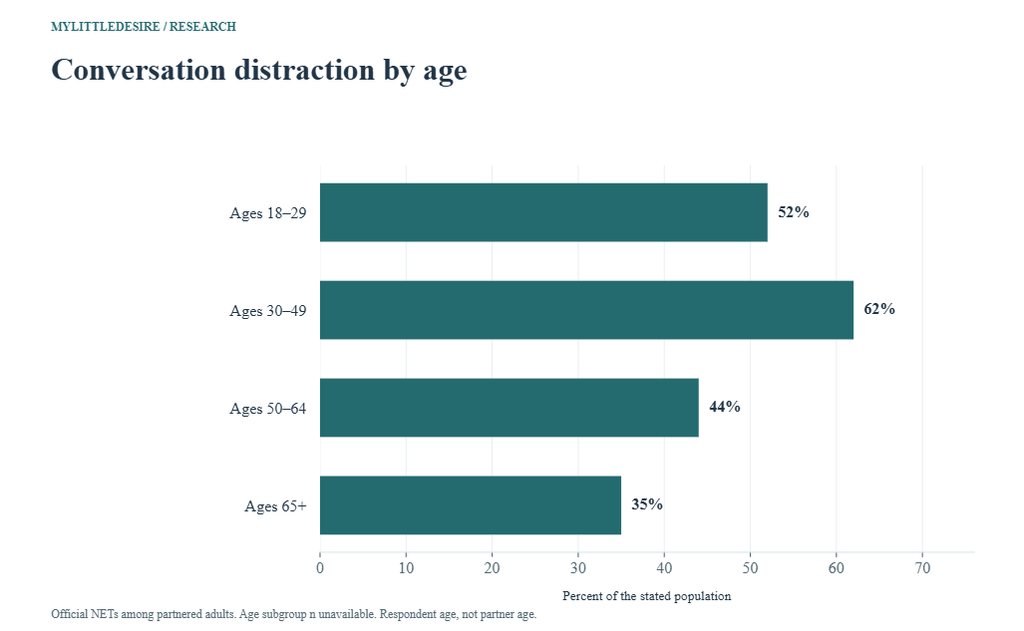
Which age groups report more conversation distraction?
The age pattern depends on the response threshold. Ages 30–49 had the highest often/sometimes NET among the displayed groups, while ages 18–29 had the highest often-only response. These are descriptive respondent groups from one dated survey. Pew Research Center [S01].
F02 Official often-or-sometimes NETs for the same partner-distraction question. Age subgroup n unavailable. These are respondent ages, not partner ages. The 65+ official NET is 35%; separately rounded often/sometimes components do not override it.
| Measure / group | Published result | Population and actual period | Original source |
|---|---|---|---|
| Ages 18–29 | 52% | US adults married, cohabiting or in a committed relationship; casual relationships excluded Exact eligible item/subgroup n unavailable. 2019-10-16 to 2019-10-28 | Original source [S01] Original report printed p.8, age rows, official NET column |
| Ages 30–49 | 62% | US adults married, cohabiting or in a committed relationship; casual relationships excluded Exact eligible item/subgroup n unavailable. 2019-10-16 to 2019-10-28 | Original source [S01] Original report printed p.8, age rows, official NET column |
| Ages 50–64 | 44% | US adults married, cohabiting or in a committed relationship; casual relationships excluded Exact eligible item/subgroup n unavailable. 2019-10-16 to 2019-10-28 | Original source [S01] Original report printed p.8, age rows, official NET column |
| Ages 65+ | 35% | US adults married, cohabiting or in a committed relationship; casual relationships excluded Exact eligible item/subgroup n unavailable. 2019-10-16 to 2019-10-28 | Original source [S01] Original report printed p.8, age rows, official NET column |
F03 Often responses only, distinct from the broader often/sometimes NET. Subgroup n unavailable; do not use the overall partnered n as each age-group base.
| Measure / group | Published result | Population and actual period | Original source |
|---|---|---|---|
| Ages 18–29: often | 24% | US adults married, cohabiting or in a committed relationship; casual relationships excluded Exact eligible item/subgroup n unavailable. 2019-10-16 to 2019-10-28 | Original source [S01] Original report printed p.8, age rows, often column |
| Ages 30–49: often | 19% | US adults married, cohabiting or in a committed relationship; casual relationships excluded Exact eligible item/subgroup n unavailable. 2019-10-16 to 2019-10-28 | Original source [S01] Original report printed p.8, age rows, often column |
| Ages 50–64: often | 13% | US adults married, cohabiting or in a committed relationship; casual relationships excluded Exact eligible item/subgroup n unavailable. 2019-10-16 to 2019-10-28 | Original source [S01] Original report printed p.8, age rows, often column |
| Ages 65+: often | 6% | US adults married, cohabiting or in a committed relationship; casual relationships excluded Exact eligible item/subgroup n unavailable. 2019-10-16 to 2019-10-28 | Original source [S01] Original report printed p.8, age rows, often column |
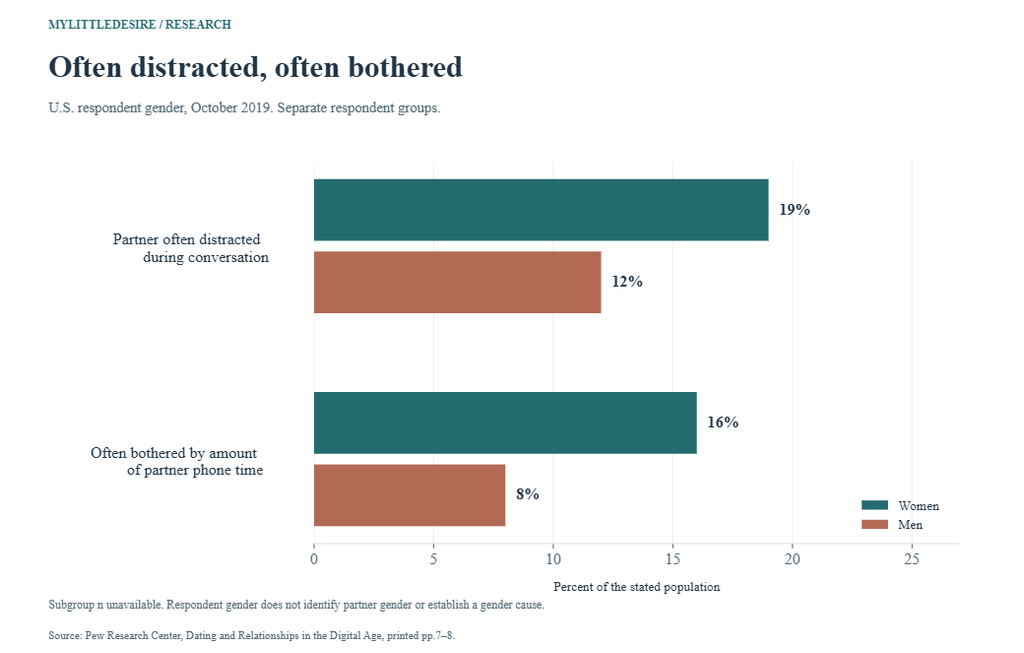
What do women and men report?
Respondent gender is attached to each result. The survey does not reconcile the two members of the same couple, and these figures do not imply that every respondent has a different-gender partner. Pew Research Center [S01].
F04 Frequency distribution and official NET within respondent gender groups. Separate respondent groups, not reconciled accounts from matched partners. Gender subgroup n unavailable. NETs repeat categories; selected components may not sum to 100%. No assumption is made about partner gender.
| Measure / group | Published result | Population and actual period | Original source |
|---|---|---|---|
| Men: often | 12% | US adults married, cohabiting or in a committed relationship; casual relationships excluded Exact eligible item/subgroup n unavailable. 2019-10-16 to 2019-10-28 | Original source [S01] Original report printed p.8, men/women rows |
| Men: sometimes | 37% | US adults married, cohabiting or in a committed relationship; casual relationships excluded Exact eligible item/subgroup n unavailable. 2019-10-16 to 2019-10-28 | Original source [S01] Original report printed p.8, men/women rows |
| Men: rarely | 34% | US adults married, cohabiting or in a committed relationship; casual relationships excluded Exact eligible item/subgroup n unavailable. 2019-10-16 to 2019-10-28 | Original source [S01] Original report printed p.8, men/women rows |
| Men: never | 14% | US adults married, cohabiting or in a committed relationship; casual relationships excluded Exact eligible item/subgroup n unavailable. 2019-10-16 to 2019-10-28 | Original source [S01] Original report printed p.8, men/women rows |
| Men: often or sometimes NET | 49% | US adults married, cohabiting or in a committed relationship; casual relationships excluded Exact eligible item/subgroup n unavailable. 2019-10-16 to 2019-10-28 | Original source [S01] Original report printed p.8, men/women rows |
| Women: often | 19% | US adults married, cohabiting or in a committed relationship; casual relationships excluded Exact eligible item/subgroup n unavailable. 2019-10-16 to 2019-10-28 | Original source [S01] Original report printed p.8, men/women rows |
| Women: sometimes | 33% | US adults married, cohabiting or in a committed relationship; casual relationships excluded Exact eligible item/subgroup n unavailable. 2019-10-16 to 2019-10-28 | Original source [S01] Original report printed p.8, men/women rows |
| Women: rarely | 27% | US adults married, cohabiting or in a committed relationship; casual relationships excluded Exact eligible item/subgroup n unavailable. 2019-10-16 to 2019-10-28 | Original source [S01] Original report printed p.8, men/women rows |
| Women: never | 16% | US adults married, cohabiting or in a committed relationship; casual relationships excluded Exact eligible item/subgroup n unavailable. 2019-10-16 to 2019-10-28 | Original source [S01] Original report printed p.8, men/women rows |
| Women: often or sometimes NET | 52% | US adults married, cohabiting or in a committed relationship; casual relationships excluded Exact eligible item/subgroup n unavailable. 2019-10-16 to 2019-10-28 | Original source [S01] Original report printed p.8, men/women rows |
F07 Young adults aged 18–29, split by respondent gender. Subgroup n unavailable. This is a nested age/gender comparison and repeats part of the overall survey population.
| Measure / group | Published result | Population and actual period | Original source |
|---|---|---|---|
| Women aged 18–29: often | 30% | US adults married, cohabiting or in a committed relationship; casual relationships excluded Exact eligible item/subgroup n unavailable. 2019-10-16 to 2019-10-28 | Original source [S01] Original report printed p.8, text above frequency chart |
| Men aged 18–29: often | 15% | US adults married, cohabiting or in a committed relationship; casual relationships excluded Exact eligible item/subgroup n unavailable. 2019-10-16 to 2019-10-28 | Original source [S01] Original report printed p.8, text above frequency chart |
How many people are bothered by a partner’s phone time?
Feeling bothered by the amount of phone time is a separate judgment from reporting distraction during a conversation. Keep the original official NET even when individually rounded response components do not add to it. Pew Research Center [S01].
F05 A separate question about amount of time, rather than distraction during a conversation. All partnered report base n=2,932. Official NET 40% is retained: 12% often plus 27% sometimes gives 39% because components are rounded. Do not replace the published NET.
| Measure / group | Published result | Population and actual period | Original source |
|---|---|---|---|
| Often bothered | 12% | US adults married, cohabiting or in a committed relationship; casual relationships excluded Eligible n=2,932. 2019-10-16 to 2019-10-28 | Original source [S01] Original report printed p.6 (physical p.7), cellphone row |
| Sometimes bothered | 27% | US adults married, cohabiting or in a committed relationship; casual relationships excluded Eligible n=2,932. 2019-10-16 to 2019-10-28 | Original source [S01] Original report printed p.6 (physical p.7), cellphone row |
| Often or sometimes bothered — official NET | 40% | US adults married, cohabiting or in a committed relationship; casual relationships excluded Eligible n=2,932. 2019-10-16 to 2019-10-28 | Original source [S01] Original report printed p.6 (physical p.7), cellphone row |
F06 Often bothered by partner cellphone time; gender and broad age comparisons. Subgroup n unavailable. These are different overlapping demographic summaries, not four exclusive categories or matched partner accounts.
| Measure / group | Published result | Population and actual period | Original source |
|---|---|---|---|
| Women: often bothered | 16% | US adults married, cohabiting or in a committed relationship; casual relationships excluded Exact eligible item/subgroup n unavailable. 2019-10-16 to 2019-10-28 | Original source [S01] Original report printed p.7 (physical p.8), text and cellphone panel |
| Men: often bothered | 8% | US adults married, cohabiting or in a committed relationship; casual relationships excluded Exact eligible item/subgroup n unavailable. 2019-10-16 to 2019-10-28 | Original source [S01] Original report printed p.7 (physical p.8), text and cellphone panel |
| Ages 18–49: often bothered | 18% | US adults married, cohabiting or in a committed relationship; casual relationships excluded Exact eligible item/subgroup n unavailable. 2019-10-16 to 2019-10-28 | Original source [S01] Original report printed p.7 (physical p.8), text and cellphone panel |
| Ages 50+: often bothered | 6% | US adults married, cohabiting or in a committed relationship; casual relationships excluded Exact eligible item/subgroup n unavailable. 2019-10-16 to 2019-10-28 | Original source [S01] Original report printed p.7 (physical p.8), text and cellphone panel |
What did the earlier US survey measure?
The earlier Pew items asked about experiences in the last 30 days. Their phone-owner eligibility and recall window differ from the 2019 typical-frequency question. Showing both studies provides historical context, but does not establish that distraction rose by a calculable amount. Pew Research Center [S02].
F08 Respondent felt partner was distracted by a cellphone while together, in the last 30 days (REL8b). Overall eligible cellphone-owner n=1,359; duration subgroup n unavailable. The short/long relationship split is 10 years or less versus more than 10 years. Not comparable as a trend with the 2019 question.
| Measure / group | Published result | Population and actual period | Original source |
|---|---|---|---|
| All eligible partnered cellphone owners | 25% | US adults married or in a committed relationship; item-specific phone, text or Internet eligibility applies Eligible n=1,359. 2013-04-17 to 2013-05-19; selected REL8 items recall the last 30 days | Original source [S02] Original report printed pp.16–17; duration chart printed p.17; questionnaire REL8b printed p.28 |
| Relationship of 10 years or less | 36% | US adults married or in a committed relationship; item-specific phone, text or Internet eligibility applies Exact eligible item/subgroup n unavailable. 2013-04-17 to 2013-05-19; selected REL8 items recall the last 30 days | Original source [S02] Original report printed pp.16–17; duration chart printed p.17; questionnaire REL8b printed p.28 |
| Relationship of more than 10 years | 17% | US adults married or in a committed relationship; item-specific phone, text or Internet eligibility applies Exact eligible item/subgroup n unavailable. 2013-04-17 to 2013-05-19; selected REL8 items recall the last 30 days | Original source [S02] Original report printed pp.16–17; duration chart printed p.17; questionnaire REL8b printed p.28 |
F09 Same REL8b 30-day experience among selected respondent groups. Subgroup n unavailable. Groups overlap; percentages do not partition all respondents. Income refers to annual household income in the original report.
| Measure / group | Published result | Population and actual period | Original source |
|---|---|---|---|
| Ages 18–29 | 42% | US adults married or in a committed relationship; item-specific phone, text or Internet eligibility applies Exact eligible item/subgroup n unavailable. 2013-04-17 to 2013-05-19; selected REL8 items recall the last 30 days | Original source [S02] Original report printed pp.16–17, text preceding negative-experiences chart; REL8b |
| Ages 30–49 | 29% | US adults married or in a committed relationship; item-specific phone, text or Internet eligibility applies Exact eligible item/subgroup n unavailable. 2013-04-17 to 2013-05-19; selected REL8 items recall the last 30 days | Original source [S02] Original report printed pp.16–17, text preceding negative-experiences chart; REL8b |
| Household income above $75,000 | 32% | US adults married or in a committed relationship; item-specific phone, text or Internet eligibility applies Exact eligible item/subgroup n unavailable. 2013-04-17 to 2013-05-19; selected REL8 items recall the last 30 days | Original source [S02] Original report printed pp.16–17, text preceding negative-experiences chart; REL8b |
| Parents | 31% | US adults married or in a committed relationship; item-specific phone, text or Internet eligibility applies Exact eligible item/subgroup n unavailable. 2013-04-17 to 2013-05-19; selected REL8 items recall the last 30 days | Original source [S02] Original report printed pp.16–17, text preceding negative-experiences chart; REL8b |
| College graduates | 28% | US adults married or in a committed relationship; item-specific phone, text or Internet eligibility applies Exact eligible item/subgroup n unavailable. 2013-04-17 to 2013-05-19; selected REL8 items recall the last 30 days | Original source [S02] Original report printed pp.16–17, text preceding negative-experiences chart; REL8b |
Can digital communication also support a relationship?
Phone-mediated contact can serve different purposes. The earlier survey also asked about feeling closer through online/text conversations, resolving an argument through those channels, and texting while both at home. These are contextual communication measures, rather than additional estimates of harmful phone use. Pew Research Center [S02].
F10 Felt closer to partner because of online or text-message conversations in the last 30 days (REL8e). Broader communication-benefit item, not a measure of phone snubbing. Overall eligible Internet-user-or-cellphone-owner n=1,396; subgroup n unavailable.
| Measure / group | Published result | Population and actual period | Original source |
|---|---|---|---|
| All eligible partnered Internet users / cellphone owners | 21% | US married/committed Internet users or cellphone owners, with selected subgroups Eligible n=1,396. 2013-04-17 to 2013-05-19; selected REL8 items recall the last 30 days | Original source [S02] Original report printed p.18; questionnaire REL8e printed p.29 |
| Ages 18–29 | 41% | US married/committed Internet users or cellphone owners, with selected subgroups Exact eligible item/subgroup n unavailable. 2013-04-17 to 2013-05-19; selected REL8 items recall the last 30 days | Original source [S02] Original report printed p.18; questionnaire REL8e printed p.29 |
| Parents | 26% | US married/committed Internet users or cellphone owners, with selected subgroups Exact eligible item/subgroup n unavailable. 2013-04-17 to 2013-05-19; selected REL8 items recall the last 30 days | Original source [S02] Original report printed p.18; questionnaire REL8e printed p.29 |
F11 Resolved an argument online or by text that was difficult to resolve in person, in the last 30 days (REL8f). Self-reported experience, not a trial showing texting is more effective. Overall eligible n=1,396; young-adult subgroup n unavailable.
| Measure / group | Published result | Population and actual period | Original source |
|---|---|---|---|
| All eligible partnered Internet users / cellphone owners | 9% | US married/committed Internet users or cellphone owners, with selected subgroups Eligible n=1,396. 2013-04-17 to 2013-05-19; selected REL8 items recall the last 30 days | Original source [S02] Original report printed p.18; questionnaire REL8f printed p.29 |
| Ages 18–29 | 23% | US married/committed Internet users or cellphone owners, with selected subgroups Exact eligible item/subgroup n unavailable. 2013-04-17 to 2013-05-19; selected REL8 items recall the last 30 days | Original source [S02] Original report printed p.18; questionnaire REL8f printed p.29 |
F12 Texted partner while both were at home together, in the last 30 days (REL8d). Behavior alone does not establish closeness, conflict or neglect. Overall eligible partnered cellphone-owner-who-texts n=1,064; subgroup n unavailable.
| Measure / group | Published result | Population and actual period | Original source |
|---|---|---|---|
| All eligible partnered cellphone owners who text | 25% | US married/committed cellphone owners who text, with selected subgroups Eligible n=1,064. 2013-04-17 to 2013-05-19; selected REL8 items recall the last 30 days | Original source [S02] Original report printed p.18; questionnaire REL8d printed p.29 |
| Ages 18–29 | 33% | US married/committed cellphone owners who text, with selected subgroups Exact eligible item/subgroup n unavailable. 2013-04-17 to 2013-05-19; selected REL8 items recall the last 30 days | Original source [S02] Original report printed p.18; questionnaire REL8d printed p.29 |
| Parents | 30% | US married/committed cellphone owners who text, with selected subgroups Exact eligible item/subgroup n unavailable. 2013-04-17 to 2013-05-19; selected REL8 items recall the last 30 days | Original source [S02] Original report printed p.18; questionnaire REL8d printed p.29 |
What does logged phone use around a partner show?
The tracking study combined phone logs with time diaries from a selected sample of parents of infants. Its partner-time measure concerns awake physical proximity, rather than a researcher-observed conversation. The results below keep participant shares, day shares, time proportions and total daily hours separate. McDaniel, Uva, Cornet and Drouin [S03].
F13 Objective phone use linked to diary-reported awake time physically around the partner. Selected parents of infants. The first result averages within-person daily proportions; the second is a participant share; the third is a share of observed days. Proximity does not establish inattention. Calendar dates unreported.
| Measure / group | Published result | Population and actual period | Original source |
|---|---|---|---|
| Mean proportion of awake partner-time using phone | 27.75% | Selected sample of US parents of infants; n=247, including women n=185 and men n=62 Eligible n=247. 8-day observation phase; exact calendar collection dates not supplied in the article | Original source [S03] Original article section 3.1, descriptive results; Table 2 sample |
| Participants using phone around partner every day | 86% | Selected sample of US parents of infants; n=247, including women n=185 and men n=62 Eligible n=247. 8-day observation phase; exact calendar collection dates not supplied in the article | Original source [S03] Original article section 3.1, descriptive results; Table 2 sample |
| Observed days with at least 20 minutes of phone use around partner | About 81% | Observed study days contributed by the selected parent participants; exact day denominator unavailable Exact observed-day denominator unavailable. 8-day observation phase; exact calendar collection dates not supplied in the article | Original source [S03] Original article section 3.1, descriptive results; Table 2 sample |
F14 Table 2 mean proportions 0.29 for women and 0.23 for men, converted to approximate percentages. Published proportions are rounded. Approximate percentages preserve that precision; do not treat physical proximity as a conversation or claim a universal gender pattern.
| Measure / group | Published result | Population and actual period | Original source |
|---|---|---|---|
| Women: mean proportion of awake partner-time | ≈29% (source mean 0.29) | Selected sample of US parents of infants; n=247, including women n=185 and men n=62 Eligible n=185. 8-day observation phase; exact calendar collection dates not supplied in the article | Original source [S03] Original article Table 2, variable 2 means by gender |
| Men: mean proportion of awake partner-time | ≈23% (source mean 0.23) | Selected sample of US parents of infants; n=247, including women n=185 and men n=62 Eligible n=62. 8-day observation phase; exact calendar collection dates not supplied in the article | Original source [S03] Original article Table 2, variable 2 means by gender |
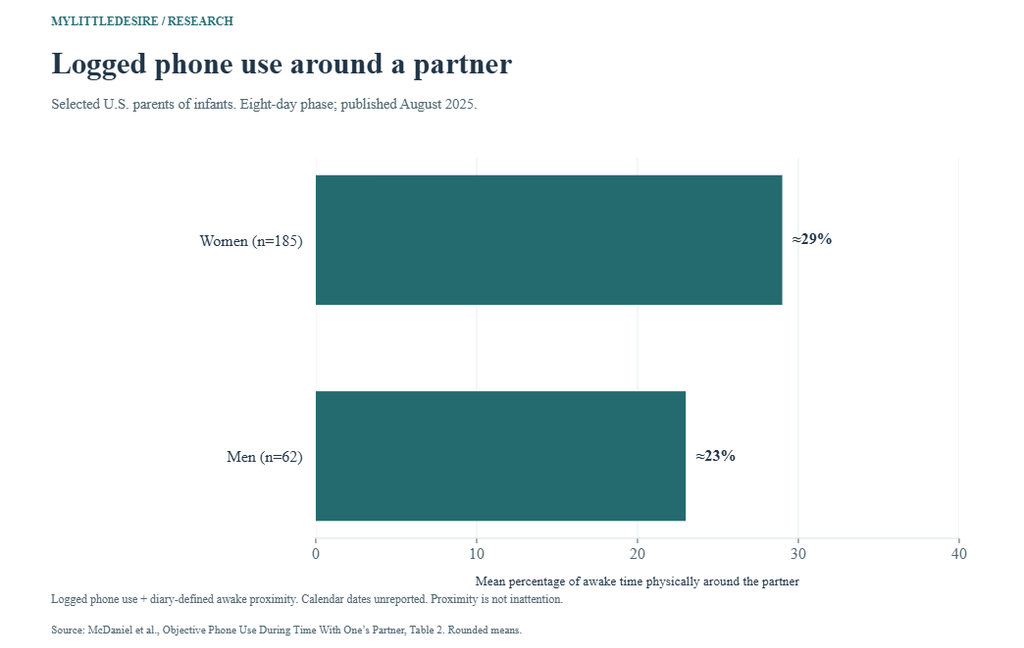
F15 Total phone use over the day, not phone use only around a partner. Selected parents of infants. Total daily use is a different quantity from the proportion of awake partner-time. It is not a recommended limit.
| Measure / group | Published result | Population and actual period | Original source |
|---|---|---|---|
| Women: mean total daily phone use | 5.23 hours/day | Selected sample of US parents of infants; n=247, including women n=185 and men n=62 Eligible n=185. 8-day observation phase; exact calendar collection dates not supplied in the article | Original source [S03] Original article Table 2, variable 1 means |
| Men: mean total daily phone use | 4.41 hours/day | Selected sample of US parents of infants; n=247, including women n=185 and men n=62 Eligible n=62. 8-day observation phase; exact calendar collection dates not supplied in the article | Original source [S03] Original article Table 2, variable 1 means |
How is phone use associated with relationship satisfaction?
The tracking study’s bivariate associations differed by respondent gender. Its adjusted relationship-satisfaction results also differed from the simple correlations. This design does not establish that changing a person’s phone use would cause a particular relationship outcome. McDaniel, Uva, Cornet and Drouin [S03].
F16 Bivariate Pearson correlations from Table 2 between the phone-around-partner proportion and relationship satisfaction. Women above the diagonal; men below. Correlations are not percentages, risk differences or causal effects. Adjusted models report a significant relationship-satisfaction association for women, not men; the bivariate male correlation is not the adjusted result.
| Measure / group | Published result | Population and actual period | Original source |
|---|---|---|---|
| Women: bivariate correlation | r = −0.23 | Selected sample of US parents of infants; n=247, including women n=185 and men n=62 Eligible n=185. 8-day observation phase; exact calendar collection dates not supplied in the article | Original source [S03] Original article Table 2, variables 2 and 5, above/below diagonal; table note; adjusted results section 3.3 |
| Men: bivariate correlation | r = +0.25 | Selected sample of US parents of infants; n=247, including women n=185 and men n=62 Eligible n=62. 8-day observation phase; exact calendar collection dates not supplied in the article | Original source [S03] Original article Table 2, variables 2 and 5, above/below diagonal; table note; adjusted results section 3.3 |
A 2025 research review [R01] describes a wider literature linking partner phubbing with poorer relationship experiences. Much of that literature is cross-sectional, so direction and confounding remain concerns. This resource uses the review for qualitative context; it does not reproduce pooled coefficients whose reporting scale was insufficiently clear in the checked tables.
For broader context, see our loneliness and social connection statistics. Loneliness, relationship satisfaction and phone distraction remain distinct measures.
How often do people check phones on dates?
The date-checking item includes a current or prospective partner. It should not be relabeled as a survey solely of committed couples or as world-population prevalence. YouGov [S05].
F17 Very or fairly often checking a smartphone on a date with a current or prospective partner. Exact overall/date-item n and not-applicable handling unavailable. Eighteen-market online aggregate, not a worldwide prevalence estimate or a rate exclusively among established couples.
| Measure / group | Published result | Population and actual period | Original source |
|---|---|---|---|
| Very/fairly often checking phone on a date | 15% | Surveyed online adults aged 18+ across 18 markets; dating-item eligibility/not-applicable handling unspecified Exact eligible item/subgroup n unavailable. May–June 2023 | Original source [S05] Original YouGov article, date-with-current-or-prospective-partner passage |
Our online dating and dating app statistics cover platform use and online relationship formation. Using an app and giving attention during a date are separate questions.
What do the UK relationship surveys show?
The 2019 UK commissioned survey combines the respondent’s own and the partner’s behavior. The newer commercial release reports a self-attributed breakup experience with fewer published methodological details. Neither establishes that phones caused a particular share of all relationship endings. Stephensons Solicitors / YouGov [S04]; Nestlé / KitKat / Censuswide [S06].
F18 Respondents say they OR their partner are distracted by mobile phones. Either-person measure, not partner-only behavior. Overall relationship n=1,328; marital/cohabiting subgroup n unavailable. Full question wording and response design not supplied.
| Measure / group | Published result | Population and actual period | Original source |
|---|---|---|---|
| All respondents in relationships | 36% | Adults in relationships: married, civil partnership, cohabiting or in a non-cohabiting relationship Eligible n=1,328. 2019-02-20 to 2019-02-21 | Original source [S04] Original release distraction section; original infographic overall/married figures and methods footer |
| Married respondents | 31% | Adults in relationships: married, civil partnership, cohabiting or in a non-cohabiting relationship Exact eligible item/subgroup n unavailable. 2019-02-20 to 2019-02-21 | Original source [S04] Original release distraction section; original infographic overall/married figures and methods footer |
| Cohabiting respondents | 47% | Adults in relationships: married, civil partnership, cohabiting or in a non-cohabiting relationship Exact eligible item/subgroup n unavailable. 2019-02-20 to 2019-02-21 | Original source [S04] Original release distraction section; original infographic overall/married figures and methods footer |
F19 Either ignoring a partner or being ignored in the phone-use context. The two directions are combined, not separate partner-only incidence. Overall relationship n=1,328; married and age subgroup n unavailable. No fixed recall window established.
| Measure / group | Published result | Population and actual period | Original source |
|---|---|---|---|
| All respondents in relationships | 27% | Adults in relationships: married, civil partnership, cohabiting or in a non-cohabiting relationship Eligible n=1,328. 2019-02-20 to 2019-02-21 | Original source [S04] Original release ignoring section; original infographic overall/married figures |
| Married respondents | 24% | Adults in relationships: married, civil partnership, cohabiting or in a non-cohabiting relationship Exact eligible item/subgroup n unavailable. 2019-02-20 to 2019-02-21 | Original source [S04] Original release ignoring section; original infographic overall/married figures |
| Respondents aged 35–44 | 43% | Adults in relationships: married, civil partnership, cohabiting or in a non-cohabiting relationship Exact eligible item/subgroup n unavailable. 2019-02-20 to 2019-02-21 | Original source [S04] Original release ignoring section; original infographic overall/married figures |
F20 Respondents reported ending a relationship due to a partner’s phubbing, according to the commissioned release. Retain publisher wording, not an exact 10.0% estimate. Exact eligible item n and recall window unavailable. A self-attributed reason is not causal proof, annual breakup risk or the share of all breakups caused by phones.
| Measure / group | Published result | Population and actual period | Original source |
|---|---|---|---|
| Reported having ended a relationship due to partner phubbing | One in ten (publisher’s wording) | UK respondents described in a commercial commissioned release; exact relationship-history item eligibility unavailable Exact eligible item/subgroup n unavailable. 2025-03-13 to 2025-03-17 | Original source [S06] Original release headline/body; Notes to Editors for full n=2,000 and March 13–17, 2025 fieldwork |
What phone boundaries can couples discuss?
Relationships Australia NSW recommends discussing how technology affects connection and agreeing on focused time together. Better Health Channel recommends clear requests and listening. These are practical suggestions, separate from the survey findings; no success rate or universal daily phone limit is established here.
- Describe a specific moment when phone use interrupted a conversation and explain what you needed.
- Agree on shared times for focused conversation, such as a meal, walk or date.
- Discuss exceptions for urgent work, caregiving or other responsibilities.
- Make requests together and check that both people understand the agreement.
- Revisit an agreement if it does not fit your circumstances.
Sources: Relationships Australia NSW [G01] and Better Health Channel [G02].
Which comparisons can readers reproduce?
These eight differences subtract compatible published percentages within each source. They are percentage-point differences, with the final one approximate because its source means were rounded. They are not relative percentage changes, new significance tests or causal effects.
| Comparison | First value | Second value | Difference | Qualification |
|---|---|---|---|---|
| US 2019: distraction NET minus bothered NET | 51% | 40% | +11 percentage points | Same all-partnered universe but different, potentially overlapping questions; not a respondent transition. |
| US 2019 distraction NET: ages 30–49 minus 65+ | 62% | 35% | +27 percentage points | Descriptive respondent age comparison; subgroup n unavailable; official NETs retained. |
| US 2019 often distracted: women minus men | 19% | 12% | +7 percentage points | Respondent gender groups, not matched partners or assumed partner gender. |
| US 2019 often bothered: women minus men | 16% | 8% | +8 percentage points | Respondent gender groups; descriptive, not causal or a new significance test. |
| US 2019 young adults often distracted: women minus men | 30% | 15% | +15 percentage points | Nested respondent groups aged 18–29; subgroup n unavailable. |
| US 2013 distraction: shorter minus longer relationships | 36% | 17% | +19 percentage points | Last-30-days item; duration of 10 years or less versus more than 10 years; no time trend. |
| UK 2019 self-or-partner distraction: cohabiting minus married | 47% | 31% | +16 percentage points | Either-person item; subgroup n unavailable; differences may reflect other group characteristics. |
| Selected parents: women minus men mean partner-time phone use | ≈29% | ≈23% | ≈+6 percentage points | Approximate difference from source-rounded means 0.29 and 0.23; proximity is not inattention. |
Common questions
How common is phone distraction in romantic relationships?
Pew’s October 2019 US survey found that 51% of partnered adults reported a partner often or sometimes distracted by a cellphone during conversation. Keep that population, question and date attached to the figure.
Are phubbing and total screen time the same thing?
No. Total phone use can include many activities. Phubbing concerns an interpersonal experience of being ignored; logged use during proximity does not establish that experience.
Which age group reports the most distraction?
In the 2019 Pew often/sometimes NET, respondents aged 30–49 had the highest displayed percentage. In the often-only category, ages 18–29 were highest. The answer depends on the selected threshold.
Do phones cause breakups?
The selected evidence does not establish a causal breakup rate. A sponsor-reported one-in-ten experience is self-attributed, approximate and missing an exact item base and recall window.
How much phone use is safe for a relationship?
These studies do not establish a universal quota. Practical guidance focuses on agreed attention, communication and circumstances rather than a number that diagnoses every couple.
Can the 2013 and 2019 Pew percentages be treated as a trend?
Their recall windows, eligible populations and response design differ. This resource presents them as separate dated findings and does not calculate a change between them.
Are there representative Canadian and Australian rates in this report?
No comparable nationally representative phone-distraction prevalence for those countries was established in the selected evidence. Australian practical guidance is not an Australian prevalence survey.
Research method and limitations
MyLittleDesire compiled selected published aggregates from original research reports, questionnaire tables, a peer-reviewed study and first-party commissioned releases. AI assisted retrieval, organization and drafting. No new survey, respondent-level reanalysis, hypothesis test or clinical assessment was conducted. The selection is a source-based compilation, not an exhaustive systematic review.
There are 65 observations in 20 grouped findings from six contributing research records: 60 percentages, two mean daily-hour values, two Pearson correlations and one approximate verbal proportion with no assigned numeric value. A separate review and two guidance records add context only. Categories, NETs and subgroups within the same survey are not independent studies. Four charts and eight differences reuse selected observations.
- Source concentration: 48 observations come from two US Pew surveys. The collection is not balanced country coverage and does not yield a pooled worldwide prevalence.
- Reporting universe: the 2019 Pew report uses all partnered adults n=2,932, after asking phone items among n=2,850 with a phone-owning partner. Raw answering-base topline values are not substituted.
- Recall and timing: the 2013 REL8 stem specifies the last 30 days. Its methods, questionnaire and official dataset establish April–May 2013, despite conflicting dates in some figure captions. The 2019 question does not use that same fixed recall.
- Sampling: Pew uses probability-recruited survey designs. The selected infant-parent study and commissioned releases have different selection limits. Weighting or a familiar survey brand alone does not establish equivalent populations.
- Units: participants, observed days, partner-time proportions, total daily hours and correlations are separate quantities. No percentage-point arithmetic is performed on hours, correlations or the verbal breakup proportion.
- Missing information: exact subgroup/item bases, calendar dates and question details remain unavailable where the source does not report them. No counts are reconstructed from rounded percentages.
- Precision: official NETs are preserved. Rounded source proportions become approximate percentages. Ambiguous UK age estimates and unclear pooled review coefficients are withheld.
- Interpretation: most surveys record perceptions or self-reported behavior. The evidence does not establish infidelity, individual breakup predictions, diagnoses or causal effects of phone boundaries.
Original sources and research notes
- S01. Pew Research Center. Dating and Relationships in the Digital Age. Publication: 2020-05-08. Actual period: 2019-10-16 to 2019-10-28. Overall study n: 4,860. Eligible base: All partnered adults n=2,932 in the report. The phone items were answered by n=2,850 whose partner owns a cellphone, then reported among all partnered adults. Age/gender subgroup n unavailable. Method: Weighted American Trends Panel survey, probability recruitment through RDD cohorts and address-based recruitment. Report printed pp.6–8 supplies selected rebased percentages. Full survey n=4,860; the full-sample margin of error does not apply to every subgroup. Individual perceptions and typical-frequency reports, not observed phone incidents or paired partner accounts. Report percentages use the all-partnered universe, unlike the phone-owning-partner topline. Official NETs are retained despite rounding. The selected frequency categories need not sum to 100%. Supporting records: record 1, record 2, record 3.
- S02. Pew Research Center. Couples, the Internet, and Social Media. Publication: 2014-02-11. Actual period: 2013-04-17 to 2013-05-19; selected REL8 items recall the last 30 days. Overall study n: 2,252. Eligible base: Partnered cellphone owners n=1,359 for REL8b distraction; partnered Internet users or cellphone owners n=1,396 for REL8e/f; partnered cellphone owners who text n=1,064 for REL8d. Subgroup n unavailable. Method: Weighted English/Spanish landline and cellphone RDD survey. The original questionnaire REL8 stem specifies the last 30 days. Methods, questionnaire and official dataset metadata establish April 17–May 19, 2013 fieldwork; some figure captions incorrectly give August–September dates. Historical 30-day self-reports, not lifetime experience or a clean trend with the 2019 typical-frequency questions. Positive online/text items concern communication benefits, not phone snubbing. Exact age, duration, parent and other subgroup n unavailable. Supporting records: record 1, record 2, record 3, record 4.
- S03. McDaniel, Uva, Cornet and Drouin. Objective Phone Use During Time With One’s Partner: Associations With Relationship and Individual Well-Being. Publication: 2025-08-01. Actual period: 8-day observation phase; exact calendar collection dates not supplied in the article. Overall study n: 247. Eligible base: Participant sample n=247; women n=185 and men n=62. The 81% result is a share of observed days, whose exact denominator is not supplied with that result. Method: Objective phone logs from RescueTime/Chronicle combined with self-reported 15-minute time diaries for awake time physically around the partner. Daily proportions were averaged within participants. Section 3.1 and Table 2; participants did not all contribute eight complete days. Selected parent sample, not national couple prevalence. Physical proximity does not demonstrate conversation, inattention or neglect. Associations are not causal. Table 2 bivariate Pearson correlations differ from adjusted-model coefficients. Rounded gender proportions are converted to approximate percentages. Supporting records: record 1.
- S04. Stephensons Solicitors / YouGov. Mobile phones ring the changes for marriages and millennial relationships. Publication: Undated release and infographic reporting 2019 fieldwork. Actual period: 2019-02-20 to 2019-02-21. Overall study n: 2,054. Eligible base: Original infographic: full survey n=2,054; respondents in relationships n=1,328. Married/cohabiting/age subgroup n unavailable. Method: Commissioned online YouGov survey. The original infographic footer supplies exact full/partnered n, dates and online mode. Full question wording, recruitment and detailed weights are not provided in the checked release/infographic. Sponsor release with limited methods. Distraction includes the respondent OR their partner; ignoring includes either direction. Do not relabel as partner-only behavior or evidence of infidelity/divorce. Millennial figures withheld because age bounds conflict between original records. Supporting records: record 1.
- S05. YouGov. Global: The activities where people are most distracted by their smartphones. Publication: 2023-08-11. Actual period: May–June 2023. Overall study n: unavailable. Eligible base: Overall and date-item n unavailable in the checked article. Aggregate is not weighted world-population prevalence. Method: Online multi-market YouGov survey. Article describes representative national samples in most markets, urban samples in Mexico/India and online-representative samples in Indonesia/Hong Kong. Aggregate weighting and exact eligible date-item base are not supplied. Current or prospective partner date context, not exclusively established couples. A market aggregate is not a global adult prevalence estimate. Full questionnaire and handling of people not dating unavailable.
- S06. Nestlé / KitKat / Censuswide. One in ten Brits dump partner due to phubbing. Publication: 2025-04-09. Actual period: 2025-03-13 to 2025-03-17. Overall study n: 2,000. Eligible base: Full survey n=2,000 adults aged 18+ in Notes to Editors; exact breakup-item n unavailable. Method: Censuswide research commissioned for a KitKat campaign. Original release and Notes to Editors supply full n and dates. Full questionnaire, recruitment frame, weighting and item base not supplied. Commercial PR with limited methods. Retain approximate verbal wording “one in ten”; no precise numeric value assigned. Self-attributed breakup reason, not a causal effect or annual breakup risk. Youngest age statistic withheld because the release says 16–24 but methods say adults 18+.
Review context and practical guidance
- R01. Ni et al., Frontiers in Psychology: A meta-analytic study of partner phubbing and its antecedents and consequences. Qualitative review context only; contributes no numeric observation.
- G01. Relationships Australia NSW: How to Set Healthy Boundaries Around Technology and Relationships. Practical boundaries and focused-time guidance, not numeric survey evidence.
- G02. Better Health Channel, Victorian Government: Relationships and communication. Practical communication guidance, not numeric survey evidence.
How to cite this resource
MyLittleDesire. Phone Distraction in Romantic Relationships 2027. . https://mylittledesire.com/phone-distraction-relationships-statistics/.