
Friendship after 50 includes having people to rely on, staying in contact, meeting new friends and maintaining existing relationships. In the University of Michigan’s August 2024 national poll, 90% of respondents had at least one close friend and 75% were interested in developing new friendships. The study surveyed adults at ages 50–94 and published its findings as “50+.” University of Michigan National Poll on Healthy Aging [S01].
This resource brings together 71 published observations in 23 groups from four studies and three publishers, with four charts and ten descriptive comparisons. 69 observations concern groups age 50+ or an explicitly older subgroup; two younger comparators are labelled separately. The evidence is U.S.-based, not a global estimate.
90%
75%
had at least one close friend in the August 2024 national poll of adults surveyed at ages 50–94.Original source [S01]
were very or somewhat interested in developing new friendships in that poll. Stated interest, not actual formation.Original source [S01]
46%
42%
of close-friend holders had a friend at least 15 years older or younger. This uses the friendship-holder denominator.Original source [S01]
said making friends was harder than when they were younger. This is retrospective perception, not an observed aging effect.Original source [S01]
What do friendship after 50 statistics cover?
Friend count describes network size. Feeling that one has enough friends, being satisfied with friendship quality and wanting more contact are separate experiences. Some questions concern all respondents; others concern only people with a close friend. Contact modes, support items and health groups can overlap. For broader context, see our friendship statistics.
The primary Michigan study surveyed ages 50–94. Pew provides separate 50+, 50–64 and 65+ estimates, while the selected YouGov 2026 findings concern adult citizens age 65+. We do not relabel the YouGov 45–64 column as “after 50,” because it includes people younger than 50.
Also Read:-
Women Friendship Statistics 2027
Male Friendship Statistics 2027
Parent Teen Communication Statistics 2027
Multigenerational Household Statistics 2027
Family Time Togetherness Statistics 2027
How many people after 50 have close friends?
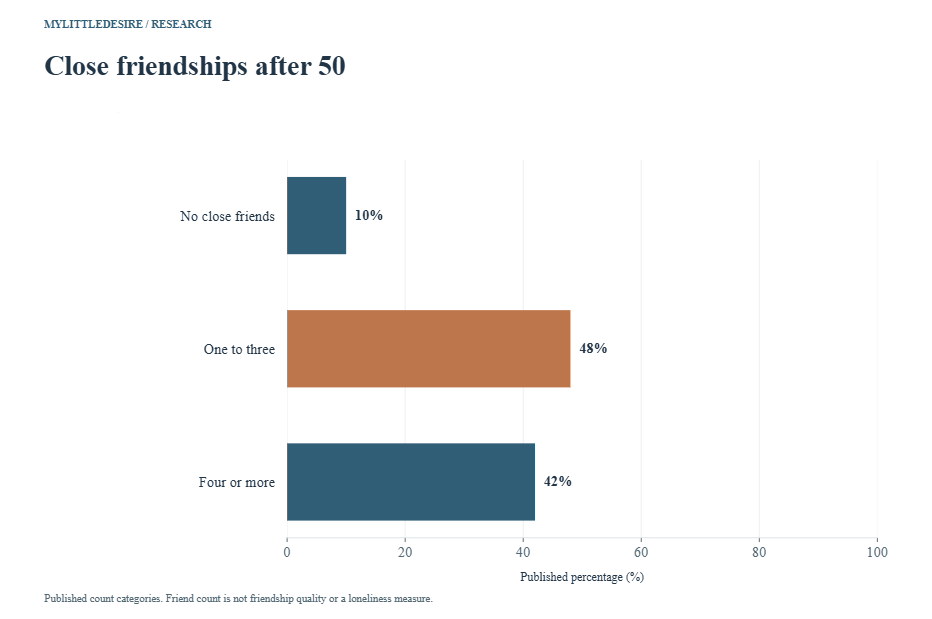
Michigan’s published friend-count categories were 10% with none, 48% with one to three and 42% with four or more. Its 90% at-least-one figure is a combined total and overlaps the positive count categories. People reporting fair or poor physical or mental health had higher no-close-friend rates, but those associations do not establish cause.
F01 Published close-friend count categories and at-least-one NET. At-least-one overlaps the positive count categories; do not add them. Questionnaire does not explicitly exclude family. Full study n not assigned to item-valid n.
| Measure / group | Published result | Population, fieldwork and base | Original source |
|---|---|---|---|
| At least one close friend | 90% | U.S. adults surveyed at ages 50–94 (published as 50+) August 5–27, 2024 · Exact valid subgroup/item n unavailable | Original source [S01] Q1; original report Number of close friends |
| No close friends | 10% | U.S. adults surveyed at ages 50–94 (published as 50+) August 5–27, 2024 · Exact valid subgroup/item n unavailable | Original source [S01] Q1; original report Number of close friends |
| One to three close friends | 48% | U.S. adults surveyed at ages 50–94 (published as 50+) August 5–27, 2024 · Exact valid subgroup/item n unavailable | Original source [S01] Q1; original report Number of close friends |
| Four or more close friends | 42% | U.S. adults surveyed at ages 50–94 (published as 50+) August 5–27, 2024 · Exact valid subgroup/item n unavailable | Original source [S01] Q1; original report Number of close friends |
F02 No close friends within each self-rated health subgroup. Cross-sectional health associations, not effects of health or friendships. Fair/poor mental- and physical-health groups can overlap.
| Measure / group | Published result | Population, fieldwork and base | Original source |
|---|---|---|---|
| No close friends, fair/poor mental health | 20% | U.S. adults surveyed at ages 50–94 (published as 50+) reporting fair/poor mental health August 5–27, 2024 · Exact valid subgroup/item n unavailable | Original source [S01] Q1 by health; original report Number of close friends |
| No close friends, fair/poor physical health | 18% | U.S. adults surveyed at ages 50–94 (published as 50+) reporting fair/poor physical health August 5–27, 2024 · Exact valid subgroup/item n unavailable | Original source [S01] Q1 by health; original report Number of close friends |
Do adults after 50 feel they have enough friends?
Three-quarters of respondents said they had enough close friends, while one-quarter said they did not. “Enough” is a personal assessment; it is not an ideal friend count prescribed by the study. The health-specific figures use subgroup denominators.
F03 Own assessment of having enough close friends. Enough friends is subjective and distinct from number, quality and loneliness. Health groups are not necessarily independent.
| Measure / group | Published result | Population, fieldwork and base | Original source |
|---|---|---|---|
| Has enough close friends | 75% | U.S. adults surveyed at ages 50–94 (published as 50+) August 5–27, 2024 · Exact valid subgroup/item n unavailable | Original source [S01] Q2; original report Number of close friends |
| Does not have enough close friends | 25% | U.S. adults surveyed at ages 50–94 (published as 50+) August 5–27, 2024 · Exact valid subgroup/item n unavailable | Original source [S01] Q2; original report Number of close friends |
| Not enough, fair/poor mental health | 47% | U.S. adults surveyed at ages 50–94 (published as 50+) reporting fair/poor mental health August 5–27, 2024 · Exact valid subgroup/item n unavailable | Original source [S01] Q2; original report Number of close friends |
| Not enough, fair/poor physical health | 36% | U.S. adults surveyed at ages 50–94 (published as 50+) reporting fair/poor physical health August 5–27, 2024 · Exact valid subgroup/item n unavailable | Original source [S01] Q2; original report Number of close friends |
How often do older friendship holders stay in touch?
The original questionnaire restricts these questions to people with at least one close friend. Contact frequency looks back over the past year; the mode question asks about the past month. The daily and weekly frequency options are separate responses, so the published 40% weekly figure is not a cumulative at-least-weekly total.
F04 Contact frequency over the past year, asked only if there is a close friend. Exclusive questionnaire categories: the weekly option is separate from daily, not a cumulative at-least-weekly NET. Monthly-or-less is published combined category; rounding leaves sum 99%.
| Measure / group | Published result | Population, fieldwork and base | Original source |
|---|---|---|---|
| Daily or almost daily | 23% | U.S. adults surveyed at ages 50–94 (published as 50+) with at least one close friend August 5–27, 2024 · Exact valid subgroup/item n unavailable | Original source [S01] Q4, routed on Q1 positive; original report Frequency and forms of contact |
| At least once a week response option | 40% | U.S. adults surveyed at ages 50–94 (published as 50+) with at least one close friend August 5–27, 2024 · Exact valid subgroup/item n unavailable | Original source [S01] Q4, routed on Q1 positive; original report Frequency and forms of contact |
| Once/twice a month or less | 36% | U.S. adults surveyed at ages 50–94 (published as 50+) with at least one close friend August 5–27, 2024 · Exact valid subgroup/item n unavailable | Original source [S01] Q4, routed on Q1 positive; original report Frequency and forms of contact |
F05 Rating the amount of contact with close friends. Q6 applies to friendship holders. Overall and health-specific percentages have different bases. Do not infer individual dissatisfaction from a different survey.
| Measure / group | Published result | Population, fieldwork and base | Original source |
|---|---|---|---|
| Contact amount about right | 72% | U.S. adults surveyed at ages 50–94 (published as 50+) with at least one close friend August 5–27, 2024 · Exact valid subgroup/item n unavailable | Original source [S01] Q6; original report Frequency and forms of contact |
| Would like more contact | 28% | U.S. adults surveyed at ages 50–94 (published as 50+) with at least one close friend August 5–27, 2024 · Exact valid subgroup/item n unavailable | Original source [S01] Q6; original report Frequency and forms of contact |
| More contact, fair/poor mental health | 45% | U.S. adults surveyed at ages 50–94 (published as 50+) with at least one close friend reporting fair/poor mental health August 5–27, 2024 · Exact valid subgroup/item n unavailable | Original source [S01] Q6; original report Frequency and forms of contact |
| More contact, excellent/very good/good mental health | 26% | U.S. adults surveyed at ages 50–94 (published as 50+) with at least one close friend reporting excellent/very good/good mental health August 5–27, 2024 · Exact valid subgroup/item n unavailable | Original source [S01] Q6; original report Frequency and forms of contact |
F06 Any contact by each selected mode during the past month. Q5 applies to friendship holders, allows multiple answers and measures any past-month use, not daily contact or duration.
| Measure / group | Published result | Population, fieldwork and base | Original source |
|---|---|---|---|
| In-person contact | 78% | U.S. adults surveyed at ages 50–94 (published as 50+) with at least one close friend August 5–27, 2024 · Exact valid subgroup/item n unavailable | Original source [S01] Q5, multiple selection, routed on Q1 positive |
| Phone contact | 73% | U.S. adults surveyed at ages 50–94 (published as 50+) with at least one close friend August 5–27, 2024 · Exact valid subgroup/item n unavailable | Original source [S01] Q5, multiple selection, routed on Q1 positive |
| Text-message contact | 71% | U.S. adults surveyed at ages 50–94 (published as 50+) with at least one close friend August 5–27, 2024 · Exact valid subgroup/item n unavailable | Original source [S01] Q5, multiple selection, routed on Q1 positive |

How common are close friends from another generation?
Among close-friend holders, 46% had a friend at least 15 years older or younger. The subsequent 52% both-older-and-younger result applies only to that intergenerational-friend group. It is not 52% of all people after 50.
F07 An intergenerational close friend is at least 15 years older or younger. Q11 uses friendship holders; Q12 uses only those with an intergenerational friend. The three direction categories are conditional, not percentages of all adults after 50.
| Measure / group | Published result | Population, fieldwork and base | Original source |
|---|---|---|---|
| Has an intergenerational close friend | 46% | U.S. adults surveyed at ages 50–94 (published as 50+) with at least one close friend August 5–27, 2024 · Exact valid subgroup/item n unavailable | Original source [S01] Q11 and Q12 with distinct routes |
| Friends in both older and younger generations | 52% | U.S. adults surveyed at ages 50–94 (published as 50+) with at least one close friend who also have a close friend at least 15 years older/younger August 5–27, 2024 · Exact valid subgroup/item n unavailable | Original source [S01] Q11 and Q12 with distinct routes |
| Younger generation only | 35% | U.S. adults surveyed at ages 50–94 (published as 50+) with at least one close friend who also have a close friend at least 15 years older/younger August 5–27, 2024 · Exact valid subgroup/item n unavailable | Original source [S01] Q11 and Q12 with distinct routes |
| Older generation only | 13% | U.S. adults surveyed at ages 50–94 (published as 50+) with at least one close friend who also have a close friend at least 15 years older/younger August 5–27, 2024 · Exact valid subgroup/item n unavailable | Original source [S01] Q11 and Q12 with distinct routes |
What support can people after 50 count on from friends?
Michigan separates support people believe they can count on from actions respondents reported their friends taking. The 79% emotional-support and 70% health-discussion figures concern perceived availability if needed. Encouragement and practical help refer to the past year. These self-reports do not establish medical or mental-health outcomes.
F08 Can definitely count on a close friend for each type of support if needed. Q7 is perceived availability, not actual support received during the past year. Different items can overlap; no clinical or causal benefit inferred.
| Measure / group | Published result | Population, fieldwork and base | Original source |
|---|---|---|---|
| Emotional support, definitely | 79% | U.S. adults surveyed at ages 50–94 (published as 50+) with at least one close friend August 5–27, 2024 · Exact valid subgroup/item n unavailable | Original source [S01] Q7, Yes definitely; original report Health-related support |
| Discussing health, definitely | 70% | U.S. adults surveyed at ages 50–94 (published as 50+) with at least one close friend August 5–27, 2024 · Exact valid subgroup/item n unavailable | Original source [S01] Q7, Yes definitely; original report Health-related support |
F09 A close friend encouraged/motivated each action in the past year. Q9 routes to friendship holders. Items overlap and self-reports do not establish actual behavior change or medical benefit.
| Measure / group | Published result | Population, fieldwork and base | Original source |
|---|---|---|---|
| Make healthier choices | 50% | U.S. adults surveyed at ages 50–94 (published as 50+) with at least one close friend August 5–27, 2024 · Exact valid subgroup/item n unavailable | Original source [S01] Q9, past year, Yes |
| Have a symptom/health issue checked | 35% | U.S. adults surveyed at ages 50–94 (published as 50+) with at least one close friend August 5–27, 2024 · Exact valid subgroup/item n unavailable | Original source [S01] Q9, past year, Yes |
| Stop unhealthy behaviors | 29% | U.S. adults surveyed at ages 50–94 (published as 50+) with at least one close friend August 5–27, 2024 · Exact valid subgroup/item n unavailable | Original source [S01] Q9, past year, Yes |
F10 Reported a close friend providing each form of help in the past year. Q8 routes to friendship holders and includes N/A options. Exact valid response bases not supplied; percentages are retained as reported, without excluding N/A or reconstructing counts.
| Measure / group | Published result | Population, fieldwork and base | Original source |
|---|---|---|---|
| Helped while sick or injured | 32% | U.S. adults surveyed at ages 50–94 (published as 50+) with at least one close friend August 5–27, 2024 · Exact valid subgroup/item n unavailable | Original source [S01] Q8, past year; original report Health-related support |
| Picked up medication | 17% | U.S. adults surveyed at ages 50–94 (published as 50+) with at least one close friend August 5–27, 2024 · Exact valid subgroup/item n unavailable | Original source [S01] Q8, past year; original report Health-related support |
| Attended a medical appointment | 15% | U.S. adults surveyed at ages 50–94 (published as 50+) with at least one close friend August 5–27, 2024 · Exact valid subgroup/item n unavailable | Original source [S01] Q8, past year; original report Health-related support |
Are adults after 50 interested in making new friends?
Interest remained common: 75% were very or somewhat interested in developing new friendships. At the same time, 42% felt making friends was harder than when they were younger. Those two findings can coexist; wanting new friends is different from finding the process easy.
F11 Own retrospective comparison of making friends now versus when younger. Q10 asks all. Recall/perception is not a longitudinal measure of aging; health groups can overlap. The harder item shares the same response scale as maintaining friendships.
| Measure / group | Published result | Population, fieldwork and base | Original source |
|---|---|---|---|
| Making friends harder now | 42% | U.S. adults surveyed at ages 50–94 (published as 50+) August 5–27, 2024 · Exact valid subgroup/item n unavailable | Original source [S01] Q10 making item; original report Making new friends |
| Making friends easier now | 10% | U.S. adults surveyed at ages 50–94 (published as 50+) August 5–27, 2024 · Exact valid subgroup/item n unavailable | Original source [S01] Q10 making item; original report Making new friends |
| Making friends about the same | 48% | U.S. adults surveyed at ages 50–94 (published as 50+) August 5–27, 2024 · Exact valid subgroup/item n unavailable | Original source [S01] Q10 making item; original report Making new friends |
| Making harder, fair/poor mental health | 65% | U.S. adults surveyed at ages 50–94 (published as 50+) reporting fair/poor mental health August 5–27, 2024 · Exact valid subgroup/item n unavailable | Original source [S01] Q10 making item; original report Making new friends |
| Making harder, fair/poor physical health | 55% | U.S. adults surveyed at ages 50–94 (published as 50+) reporting fair/poor physical health August 5–27, 2024 · Exact valid subgroup/item n unavailable | Original source [S01] Q10 making item; original report Making new friends |
F12 Interest in developing new friendships. Interested NET includes very and somewhat interested. Do not add the NET to its components. This is stated interest, not actual formation.
| Measure / group | Published result | Population, fieldwork and base | Original source |
|---|---|---|---|
| Very/somewhat interested | 75% | U.S. adults surveyed at ages 50–94 (published as 50+) August 5–27, 2024 · Exact valid subgroup/item n unavailable | Original source [S01] Q3, all respondents |
| Very interested | 14% | U.S. adults surveyed at ages 50–94 (published as 50+) August 5–27, 2024 · Exact valid subgroup/item n unavailable | Original source [S01] Q3, all respondents |
| Somewhat interested | 61% | U.S. adults surveyed at ages 50–94 (published as 50+) August 5–27, 2024 · Exact valid subgroup/item n unavailable | Original source [S01] Q3, all respondents |
| Not interested | 25% | U.S. adults surveyed at ages 50–94 (published as 50+) August 5–27, 2024 · Exact valid subgroup/item n unavailable | Original source [S01] Q3, all respondents |
Is maintaining friendship harder than when people were younger?
Maintaining friendships was described as harder by 34%, about the same by 54% and easier by 12%. The survey asks people to compare with their younger years. It does not follow the same people across decades or prove that aging itself caused a change.
F13 Own retrospective comparison of maintaining friendships now versus when younger. Q10 asks all. Descriptive perception, not change observed within the same people or causal health effects.
| Measure / group | Published result | Population, fieldwork and base | Original source |
|---|---|---|---|
| Maintaining friendships harder now | 34% | U.S. adults surveyed at ages 50–94 (published as 50+) August 5–27, 2024 · Exact valid subgroup/item n unavailable | Original source [S01] Q10 maintaining item; original report Maintaining friendships |
| Maintaining friendships easier now | 12% | U.S. adults surveyed at ages 50–94 (published as 50+) August 5–27, 2024 · Exact valid subgroup/item n unavailable | Original source [S01] Q10 maintaining item; original report Maintaining friendships |
| Maintaining friendships about the same | 54% | U.S. adults surveyed at ages 50–94 (published as 50+) August 5–27, 2024 · Exact valid subgroup/item n unavailable | Original source [S01] Q10 maintaining item; original report Maintaining friendships |
| Maintaining harder, fair/poor mental health | 61% | U.S. adults surveyed at ages 50–94 (published as 50+) reporting fair/poor mental health August 5–27, 2024 · Exact valid subgroup/item n unavailable | Original source [S01] Q10 maintaining item; original report Maintaining friendships |
| Maintaining harder, fair/poor physical health | 47% | U.S. adults surveyed at ages 50–94 (published as 50+) reporting fair/poor physical health August 5–27, 2024 · Exact valid subgroup/item n unavailable | Original source [S01] Q10 maintaining item; original report Maintaining friendships |

How do friend counts, quality and composition differ across older groups?
Pew’s July 2023 survey found five or more close friends outside family among 40% of adults age 50–64 and 49% of those 65+. Its separate quality-satisfaction finding was 77% among friendship holders age 50+, compared with 67% among younger friendship holders. These are different questions and age scopes.
F14 Five or more close friends outside family, among all respondents in each age group. Not the Michigan four-plus category. Age groups are cross-sectional and not a time trend.
| Measure / group | Published result | Population, fieldwork and base | Original source |
|---|---|---|---|
| Five or more, age 50–64 | 40% | U.S. adults age 50–64 July 17–23, 2023 · Exact valid subgroup/item n unavailable | Original source [S02] MANYFRI; original article Number of close friends |
| Five or more, age 65+ | 49% | U.S. adults age 65+ July 17–23, 2023 · Exact valid subgroup/item n unavailable | Original source [S02] MANYFRI; original article Number of close friends |
F15 Completely or very satisfied with the quality of friendships. Among friendship holders outside family; not satisfaction with count. Under-50 comparator labelled separately.
| Measure / group | Published result | Population, fieldwork and base | Original source |
|---|---|---|---|
| High quality satisfaction, age 50+ | 77% | U.S. adults age 50+ with at least one close friend outside family July 17–23, 2023 · Exact valid subgroup/item n unavailable | Original source [S02] SATISQUAL; article Satisfaction with friendships |
| High quality satisfaction, under 50 | 67% | U.S. adults age 18–49 with at least one close friend outside family July 17–23, 2023 · Exact valid subgroup/item n unavailable | Original source [S02] SATISQUAL; article Satisfaction with friendships |
F16 All or most close friends share the respondent’s gender. Among age-50+ friendship holders. Most same gender does not mean an exclusively male or female network.
| Measure / group | Published result | Population, fieldwork and base | Original source |
|---|---|---|---|
| All/most same gender, women 50+ | 74% | U.S. women age 50+ with a close friend outside family July 17–23, 2023 · Exact valid subgroup/item n unavailable | Original source [S02] GENFRI; article Gender of friends |
| All/most same gender, men 50+ | 59% | U.S. men age 50+ with a close friend outside family July 17–23, 2023 · Exact valid subgroup/item n unavailable | Original source [S02] GENFRI; article Gender of friends |
F17 All or most close friends share the respondent’s race/ethnicity. Among age-65+ friendship holders, not all people after 50. Descriptive composition, not a quality score or causal explanation.
| Measure / group | Published result | Population, fieldwork and base | Original source |
|---|---|---|---|
| All/most same race or ethnicity, age 65+ | 70% | U.S. adults age 65+ with a close friend outside family July 17–23, 2023 · Exact valid subgroup/item n unavailable | Original source [S02] RACEFRI; article Race and ethnicity of friends |
F18 Physical health comes up extremely often or often in close-friend conversations. Among friendship holders age 65+; frequency is not treatment, need for care or quality of friendship.
| Measure / group | Published result | Population, fieldwork and base | Original source |
|---|---|---|---|
| Often discuss physical health, age 65+ | 45% | U.S. adults age 65+ with a close friend outside family July 17–23, 2023 · Exact valid subgroup/item n unavailable | Original source [S02] TOPICTALK physical health; article Differences by age |
How does digital friend contact vary after 50?
Pew’s 2024 chart describes digital contact among friendship holders outside family. Frequent means daily or a few times a week. Separate age and gender groups should not be read as the course an individual’s friendships must take with age, and a close friend may be of any gender.
F19 Daily or a few times a week, with a close friend. Methods overlap and populations differ by age/gender. Cross-sectional age differences do not show individual change with age; contact with any close friend, not every friend.
| Measure / group | Published result | Population, fieldwork and base | Original source |
|---|---|---|---|
| Text a close friend — men 50–64 | 53% | U.S. men age 50–64 with at least one close friend outside family September 3–15, 2024 · Exact valid subgroup/item n unavailable | Original source [S03] Original report printed page 13 gender-by-age chart |
| Text a close friend — women 50–64 | 63% | U.S. women age 50–64 with at least one close friend outside family September 3–15, 2024 · Exact valid subgroup/item n unavailable | Original source [S03] Original report printed page 13 gender-by-age chart |
| Text a close friend — men 65+ | 35% | U.S. men age 65+ with at least one close friend outside family September 3–15, 2024 · Exact valid subgroup/item n unavailable | Original source [S03] Original report printed page 13 gender-by-age chart |
| Text a close friend — women 65+ | 53% | U.S. women age 65+ with at least one close friend outside family September 3–15, 2024 · Exact valid subgroup/item n unavailable | Original source [S03] Original report printed page 13 gender-by-age chart |
| Social-media contact — men 50–64 | 24% | U.S. men age 50–64 with at least one close friend outside family September 3–15, 2024 · Exact valid subgroup/item n unavailable | Original source [S03] Original report printed page 13 gender-by-age chart |
| Social-media contact — women 50–64 | 37% | U.S. women age 50–64 with at least one close friend outside family September 3–15, 2024 · Exact valid subgroup/item n unavailable | Original source [S03] Original report printed page 13 gender-by-age chart |
| Social-media contact — men 65+ | 12% | U.S. men age 65+ with at least one close friend outside family September 3–15, 2024 · Exact valid subgroup/item n unavailable | Original source [S03] Original report printed page 13 gender-by-age chart |
| Social-media contact — women 65+ | 27% | U.S. women age 65+ with at least one close friend outside family September 3–15, 2024 · Exact valid subgroup/item n unavailable | Original source [S03] Original report printed page 13 gender-by-age chart |

What do the 2026 age-65+ tables show?
YouGov’s June 2026 tables provide a more recent age-65+ snapshot with a different population and design: U.S. adult citizens in a weighted opt-in web survey. Eighteen percent of that age group reported no close friends and 10% reported exactly one. The younger no-friend comparator, 16%, concerns ages 18–29. These are not estimates for all people after 50.
F20 Selected number-of-close-friends response categories. Question does not explicitly exclude family. Younger age-18–29 comparator retained separately; no country-wide all-50+ inference. Published rounded cells not respondent counts.
| Measure / group | Published result | Population, fieldwork and base | Original source |
|---|---|---|---|
| No close friends, age 65+ | 18% | U.S. adult citizens age 65+ June 5–9, 2026 · Published unweighted item n=230 | Original source [S04] Q6 age table, printed page 7 (PDF page 10) |
| Exactly one close friend, age 65+ | 10% | U.S. adult citizens age 65+ June 5–9, 2026 · Published unweighted item n=230 | Original source [S04] Q6 age table, printed page 7 (PDF page 10) |
| No close friends, age 18–29 | 16% | U.S. adult citizens age 18–29 June 5–9, 2026 · Published unweighted item n=250 | Original source [S04] Q6 age table, printed page 7 (PDF page 10) |
F21 Selected ideal-number-of-close-friends categories. Preference, not actual count. Different question/distribution from actual count; no matched-person unmet-need estimate.
| Measure / group | Published result | Population, fieldwork and base | Original source |
|---|---|---|---|
| Ideally no close friends, age 65+ | 3% | U.S. adult citizens age 65+ June 5–9, 2026 · Published unweighted item n=230 | Original source [S04] Q7 age table, printed page 9 (PDF page 12) |
| Ideally eleven or more, age 65+ | 14% | U.S. adult citizens age 65+ June 5–9, 2026 · Published unweighted item n=230 | Original source [S04] Q7 age table, printed page 9 (PDF page 12) |
F22 Typical perceived difficulty, selected response categories. Somewhat/very difficult are distinct categories, not summed here. Subjective reports, not observed success or causal age effects.
| Measure / group | Published result | Population, fieldwork and base | Original source |
|---|---|---|---|
| Somewhat difficult, age 65+ | 23% | U.S. adult citizens age 65+ June 5–9, 2026 · Published unweighted item n=231 | Original source [S04] Q1 age table, printed page 1 (PDF page 4) |
| Very difficult, age 65+ | 6% | U.S. adult citizens age 65+ June 5–9, 2026 · Published unweighted item n=231 | Original source [S04] Q1 age table, printed page 1 (PDF page 4) |
F23 Enjoyment of making new friends, selected response categories. Enjoyment differs from ease, success, count or quality. Exact age-65+ item base preserved.
| Measure / group | Published result | Population, fieldwork and base | Original source |
|---|---|---|---|
| Enjoy making friends a lot, age 65+ | 33% | U.S. adult citizens age 65+ June 5–9, 2026 · Published unweighted item n=230 | Original source [S04] Q2 age table, printed page 2 (PDF page 5) |
| Do not enjoy making friends at all, age 65+ | 6% | U.S. adult citizens age 65+ June 5–9, 2026 · Published unweighted item n=230 | Original source [S04] Q2 age table, printed page 2 (PDF page 5) |
How should these findings be interpreted?
Match the statistic to the intended claim. An age-65+ result should retain that label, and a routed friendship-holder result should not become an estimate for every older adult. Michigan and YouGov friend-count questions do not explicitly exclude family; Pew’s does. Michigan’s four-plus and Pew’s five-plus categories are also different.
Friend count, contact, quality and loneliness are distinct. For information on loneliness measures and their periods, see our loneliness statistics. None of the selected descriptive results establishes an ideal personal number of friends, a contact schedule or a quantified treatment benefit.
Ten reproducible descriptive comparisons
Each result subtracts the second published percentage from the first and is expressed in percentage points. Inputs are rounded published estimates. No new confidence interval, significance test or causal effect is calculated. The workbook retrieves inputs by stable ID and checks units and measure types.
| ID | Comparison | First | Second | Difference | Qualification |
|---|---|---|---|---|---|
| C01 | Four-plus versus one-to-three friends after 50 | 42% | 48% | -6 percentage points | Selected count bins, not an average number of friends. Rounded inputs; descriptive difference, no new significance test. |
| C02 | Definitely count on emotional versus health-discussion support | 79% | 70% | +9 percentage points | Different Q7 support items among friendship holders, not support received. Rounded inputs; descriptive difference, no new significance test. |
| C03 | Harder to make versus harder to maintain friends | 42% | 34% | +8 percentage points | Two Q10 perceptions among all surveyed adults, not change over time. Rounded inputs; descriptive difference, no new significance test. |
| C04 | Want more contact: fair/poor versus better mental health | 45% | 26% | +19 percentage points | Different health groups among friendship holders; no causal mental-health effect. Rounded inputs; descriptive difference, no new significance test. |
| C05 | Five-plus close friends: age 65+ minus 50–64 | 49% | 40% | +9 percentage points | Different age groups, not individuals gaining friends with age. Rounded inputs; descriptive difference, no new significance test. |
| C06 | Quality satisfaction: age 50+ minus under 50 | 77% | 67% | +10 percentage points | Younger comparator includes ages 18–49; friendship holders only. Rounded inputs; descriptive difference, no new significance test. |
| C07 | Frequent texting at 65+: women minus men | 53% | 35% | +18 percentage points | Daily or a few times a week, friendship holders outside family. Rounded inputs; descriptive difference, no new significance test. |
| C08 | Frequent social-media contact at 50–64: women minus men | 37% | 24% | +13 percentage points | Separate gender groups, no causal gender effect. Rounded inputs; descriptive difference, no new significance test. |
| C09 | Making friends at 65+: somewhat minus very difficult | 23% | 6% | +17 percentage points | Two distinct response categories, not a combined difficulty NET. Rounded inputs; descriptive difference, no new significance test. |
| C10 | No close friends: age 65+ minus 18–29 | 18% | 16% | +2 percentage points | U.S. adult-citizen age groups; unweighted item n 230 versus 250. Rounded inputs; descriptive difference, no new significance test. |
Common questions about friendship after 50
What percentage of people after 50 have a close friend?
The August 2024 Michigan national poll found 90% had at least one close friend. It surveyed ages 50–94 and published the population as 50+. The full national sample was 3,486, not every valid item base.
Do most adults after 50 want to make new friends?
In that survey, 75% were very or somewhat interested in developing new friendships, including 14% very and 61% somewhat interested. The combined total includes its components; it measures interest, not success.
Are contact and support figures based on all older adults?
No. Michigan Q4–Q9 and Q11 require at least one close friend. Q12 on the direction of generational friendships requires an intergenerational close friend as well.
Does the 40% weekly-contact figure include daily contact?
It is the separate weekly response option in Michigan Q4. Daily/almost-daily was 23%. Do not call 40% a cumulative at-least-weekly NET.
Does 79% emotional support mean it was received last year?
No. Michigan Q7 asks whether respondents can count on friends for support if needed. Past-year actions are measured separately.
Do these results prove friendships become harder with age?
No. Michigan asks respondents to compare with when younger; Pew and YouGov compare different age groups. Neither approach here observes change in the same people over time.
Can age 45–64 findings be called after-50 statistics?
No. That band includes people younger than 50. The selected YouGov older-age observations use 65+ instead.
Research method and limitations
Selection and concentration. We selected original reports, questions and tables directly addressing later-life close friendships, contact, support, formation, maintenance, quality and preferences. There are 71 observations in 23 groups from four studies and three publisher labels: Michigan 46, Pew 2023 eight, Pew 2024 eight and YouGov 2026 nine. Michigan contributes about two-thirds of selected observations. Related cells, overlapping groups and NET components are not independent studies; charts and comparisons reuse inputs. There are 69 older-group rows and two clearly labelled younger comparators. MyLittleDesire conducted no survey.
Source and routing verification. Michigan’s full HTML report, methods, original three-page questionnaire and university press release were checked. The questionnaire resolves friendship-holder routes, the further Q12 condition, Q7 availability wording and Q10 retrospective comparisons. Its downloadable full-report PDF was denied and linked Tableau tables returned an error; no interactive-table audit is claimed. Original Pew articles, report, toplines and methods and YouGov age cross-tabs/methods were checked. Individual respondent records were not audited.
Samples and uncertainty. Nine selected YouGov observations preserve published unweighted age-by-item bases. Sixty-two other selected valid bases remain unknown; all weighted item bases and selected estimate confidence intervals are unavailable. Full study and route totals stay separate. National Michigan estimates are not pooled with its separately weighted state sample. No raw counts, new intervals or significance tests are reconstructed, and overall margins are not assigned to subgroup cells.
Definitions. Age 50–94, 50+, 50–64, 65+ and younger comparison bands remain distinct. Pew explicitly excludes family from close-friend counts; Michigan/YouGov wording does not. Friend-count sufficiency, quality satisfaction, contact, perceived support, past-year help and preferences are separate constructs. Contact modes and support items overlap. Published NETs remain distinct from components. Weekly Michigan frequency is an exclusive response option; Q12 directions have a conditional denominator.
Interpretation and maintenance. Health associations and self-reported encouragement do not establish clinical or causal benefits. Retrospective perceptions and cross-sectional age differences are not individual aging effects. Instruments are not pooled into a global average or time trend. Recheck original questions, age bands, routes, weights, bases and fieldwork before replacing numbers; add comparable waves before describing change. Keep the evergreen URL and update the review date only after substantive source review.
Original sources and supporting records
- University of Michigan National Poll on Healthy Aging. The Value of Friendships as We Age [S01]
Published: December 12, 2024. Actual fieldwork: August 5–27, 2024.
Population: U.S. adults surveyed at ages 50–94; results published as age 50+, with friendship-holder and intergenerational-holder routes specified.
Full study sample: 3,486. 3,486 adults age 50–94 in the national survey. Exact selected item/subgroup bases not supplied. Separate Michigan sample not used..
Bases: Q1–Q3 and Q10 ask all. Q4–Q9 and Q11 require at least one close friend. Q12 requires an intergenerational close friend. Selected valid unweighted/weighted bases unknown.
Method: Original full HTML report, methods, three-page poll-question PDF and university press release checked. NORC randomly selected stratified national household survey, online/phone, with racial/ethnic oversamples. National data weighted to reflect U.S. population. Full-sample completion rate 36%; publisher reports overall margins of 1–4 points, not assigned to subgroup cells.
Limits: Questionnaire asks how many close friends without explicit family exclusion. Full n is not every valid item n. Contact questions apply to friendship holders despite broad wording in report prose. Q7 is perceived ability to count on friends, not receipt in the past year. Q8/Q9 are past-year experiences. Q4 frequency categories are exclusive response options: weekly option is not a cumulative NET. Q12 denominators differ from Q11. Health associations and retrospective age comparisons are not causal or longitudinal effects. Downloadable full report PDF was denied and Tableau returned an error; no interactive table or private respondent data audited.
Supporting record 1 · Supporting record 2 · Supporting record 3 - Pew Research Center. What does friendship look like in America? — older-adult findings [S02]
Published: October 12, 2023. Actual fieldwork: July 17–23, 2023.
Population: U.S. adults age 18+, selecting age 50+, 50–64 and 65+ groups; one under-50 satisfaction comparator labelled separately.
Full study sample: 5,057. 5,057 adults overall; friendship-holder route n=4,618 across ages. Neither is every selected older-adult valid base..
Bases: Counts ask all, excluding family. Composition, satisfaction and conversation topics require a close friend. Exact selected age/gender-by-item bases unknown.
Method: Probability-based American Trends Panel recruited through residential addresses, weighted to U.S. adults. Original article, three-page topline and linked Wave 131 methods checked.
Limits: Five-plus friend counts differ from Michigan four-plus counts. All/most same-gender friends does not mean exclusively same gender. Quality satisfaction is not number satisfaction. Topics use extremely often/often; age bands not interchangeable and younger comparator retained. Published NETs retained rather than sums of rounded components.
Supporting record 1 · Supporting record 2 - Pew Research Center. Men, Women and Social Connections — contact by age and gender [S03]
Published: January 16, 2025. Actual fieldwork: September 3–15, 2024.
Population: U.S. adult friendship holders outside family, selecting men/women age 50–64 and 65+.
Full study sample: 6,204. 6,204 adults overall. COMMFRI route n=5,107 across all age/gender groups, not selected older-group item bases..
Bases: At least one close friend outside family. Exact valid age-by-gender item bases and weighted bases unknown.
Method: Probability-based American Trends Panel plus SSRS Opinion Panel racial/ethnic oversamples; weighted web or telephone survey. Original report printed page 13, topline and methods checked; original chart rendered and visually inspected.
Limits: Frequent means daily or a few times a week, not daily only. Contact with a close friend of any gender, not with every friend. Texting/social media overlap. Cross-sectional age/gender groups are not change within the same people. Age 65+ not interchangeable with age 50–64 or all 50+.
Supporting record 1 · Supporting record 2 · Supporting record 3 - YouGov. Friendship and Loneliness — age-65+ cross-tabulations [S04]
Published: 2026; exact release day not stated in retrieved tables. Actual fieldwork: June 5–9, 2026.
Population: U.S. adult citizens age 18+, selecting age 65+ plus one age-18–29 no-close-friend comparator.
Full study sample: 1,066. 1,066 adult citizens overall. Selected age-65+ item bases: Q1 n=231; Q2, Q6 and Q7 n=230. Younger Q6 comparator n=250..
Bases: Exact published unweighted age-by-item bases preserved for all nine selected observations. Weighted item bases unknown.
Method: Original PDF cross-tabs and methods checked. Opt-in web panel weighted for demographics, region and political variables. Overall reported weighting-adjusted margin ±4.3 points not assigned to subgroup cells.
Limits: Citizen target differs from all-resident adults. Q6 does not explicitly exclude family. Actual and ideal counts are different questions with different response distributions, not matched-person unmet need. Rounded cells are not respondent counts. No renormalization, new confidence interval or significance test. Age 18–29 comparator is not an after-50 estimate.
How to cite this resource
MyLittleDesire. Friendship After 50 Statistics 2027. https://mylittledesire.com/friendship-after-50-statistics/.