
Multigenerational living can describe a parent sharing a home with an adult child, three family generations under one roof, or grandparents living with grandchildren. The exact definition changes the statistic. Pew Research Center’s March 2026 analysis reports that 22% of the US population lived in multigenerational households in 2024, using a definition that includes two adult generations, with adults defined as 18 or older. This is a share of people, rather than households. Pew Research Center [S01].
This resource collects 78 published observations in 21 groups, four original charts and ten reproducible descriptive comparisons from four numerical source records and three publisher labels. It covers US census/ACS analysis and a dated US experience survey, Canadian census research, and England and Wales census tables. Related categories and subgroup cells are not independent studies.
22%
40%
US population living in multigenerational homes in 2024.Pew 2026 analysis; two adult generations, adult age 18+. Pew Research Center [S01]
Cited financial issues as a major reason for living together.US survey, October 2021; eligible respondents 25+. Pew Research Center [S02]
441,750
2.1%
Canadian multigenerational households in 2021.Three or more same-family generations; household count. Statistics Canada [S03]
England and Wales households classified as multigenerational.2021 household share, including skipped generations; not UK-wide. Office for National Statistics [S04]
What counts as a multigenerational household?
Generations here refer to relationships within a family, rather than birth cohorts such as Gen Z or Baby Boomers. A household’s usual residents also differ from everyone who visits, receives care or considers one another family. Coresidence does not establish custody, care responsibility or relationship quality.
| Source | Included arrangements | Unit / boundary |
|---|---|---|
| Pew 2026 census/ACS analysis | Two or more adult generations (adults 18+) or grandparents with grandchildren | Percent of total population; selected years 1970–2024 |
| Pew October 2021 experience survey | Respondents 25+ with parent/grandparent, or child/grandchild 25+ | Eligible adult respondents; adult family members exclude spouse/partner |
| Statistics Canada 2021 census research | Three or more generations of the same family | People in private households for prevalence; households for housing measures |
| ONS England and Wales Census 2021 | More than two family generations, including grandparents/grandchildren without middle generation | All households for 2.1%; dependent children or child-containing households in custom tables |
Do not rank countries with these percentages. The US, Canada, and England and Wales results differ in generation rules, age thresholds and whether they count people or households. Subtracting 6.5% or 2.1% from the US 22% would not measure a comparable country gap.
Also Read:-
Family Time Togetherness Statistics 2027
Parenthood Relationship Satisfaction Statistics 2027
Parenting Partnership Roles Statistics 2027
Wedding Cost by State Statistics 2027
How common is multigenerational living in the US?
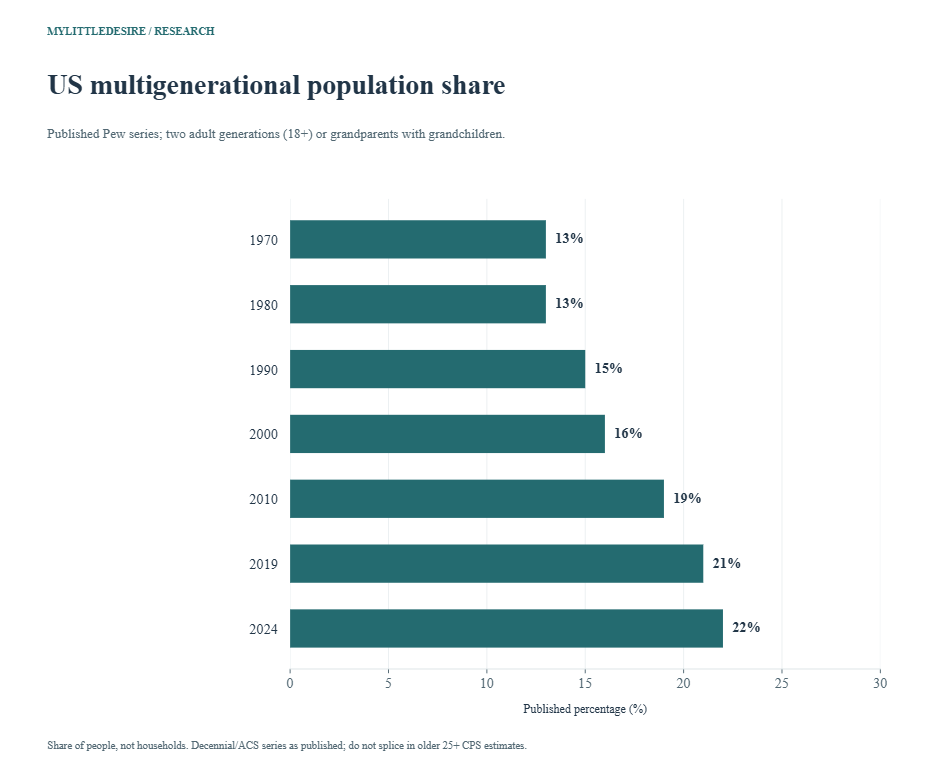
F01 Pew 2026 series: two or more adult generations (adults 18+) or grandparents with grandchildren. Share of people, not households. Published mixed decennial/ACS series; older 25+ CPS/ASEC estimates not spliced in.
| Measure / group | Published result | Eligible audience, period and base | Source |
|---|---|---|---|
| 1970 | 13% | Total population in the source analysis; race/ethnicity-specific 2024 groups where labelled 1970 · United States · Exact valid item/subgroup n unavailable | Original source [S01] More generations under one roof, All chart data table |
| 1980 | 13% | Total population in the source analysis; race/ethnicity-specific 2024 groups where labelled 1980 · United States · Exact valid item/subgroup n unavailable | Original source [S01] More generations under one roof, All chart data table |
| 1990 | 15% | Total population in the source analysis; race/ethnicity-specific 2024 groups where labelled 1990 · United States · Exact valid item/subgroup n unavailable | Original source [S01] More generations under one roof, All chart data table |
| 2000 | 16% | Total population in the source analysis; race/ethnicity-specific 2024 groups where labelled 2000 · United States · Exact valid item/subgroup n unavailable | Original source [S01] More generations under one roof, All chart data table |
| 2010 | 19% | Total population in the source analysis; race/ethnicity-specific 2024 groups where labelled 2010 · United States · Exact valid item/subgroup n unavailable | Original source [S01] More generations under one roof, All chart data table |
| 2019 | 21% | Total population in the source analysis; race/ethnicity-specific 2024 groups where labelled 2019 · United States · Exact valid item/subgroup n unavailable | Original source [S01] More generations under one roof, All chart data table |
| 2024 | 22% | Total population in the source analysis; race/ethnicity-specific 2024 groups where labelled 2024 · United States · Exact valid item/subgroup n unavailable | Original source [S01] More generations under one roof, All chart data table |
F02 Same 2024 population prevalence within each source-labelled race/ethnicity group. White, Black and Asian are single-race non-Hispanic; Hispanic any race. Cross-sectional group rates, not causal ethnic effects.
| Measure / group | Published result | Eligible audience, period and base | Source |
|---|---|---|---|
| White | 16% | White population under Pew’s 18+ multigenerational definition 2024 ACS · United States · Exact valid item/subgroup n unavailable | Original source [S01] More generations under one roof, Race/Ethnicity chart, 2024 row |
| Black | 29% | Black population under Pew’s 18+ multigenerational definition 2024 ACS · United States · Exact valid item/subgroup n unavailable | Original source [S01] More generations under one roof, Race/Ethnicity chart, 2024 row |
| Asian | 30% | Asian population under Pew’s 18+ multigenerational definition 2024 ACS · United States · Exact valid item/subgroup n unavailable | Original source [S01] More generations under one roof, Race/Ethnicity chart, 2024 row |
| Hispanic | 30% | Hispanic population under Pew’s 18+ multigenerational definition 2024 ACS · United States · Exact valid item/subgroup n unavailable | Original source [S01] More generations under one roof, Race/Ethnicity chart, 2024 row |
The 2026 publication provides its own historical series using decennial census and ACS/IPUMS data. Its 18+ adult rule matters: earlier Pew work using CPS/ASEC data and a 25+ rule produced a different prevalence series. We do not combine those older estimates with the 2024 point. Within the 2024 race/ethnicity table, White, Black and Asian categories are single-race non-Hispanic groups; Hispanic includes people of any race. Descriptive differences do not identify their causes. Pew Research Center [S01].
Why do adults live with other generations?
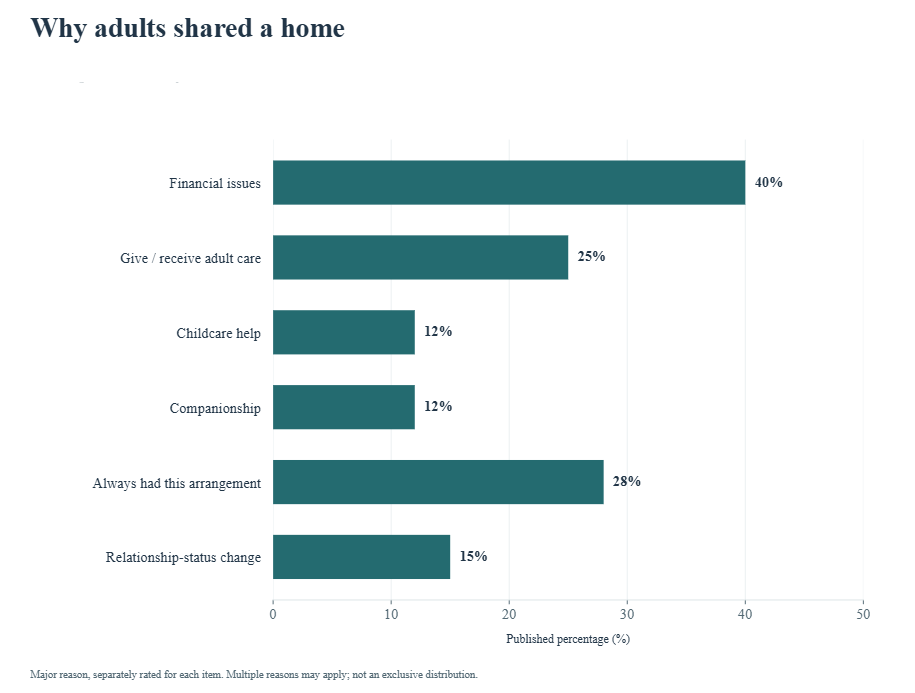
F03 MULTIGENWHY major reason, six independently rated items. 2021 survey, respondents 25+ under source’s 25+ multigenerational rule. Excludes spouse/partner from adult-family-member wording. Dated self-reports; no causal inference. Multiple reasons may apply; do not sum.
| Measure / group | Published result | Eligible audience, period and base | Source |
|---|---|---|---|
| Financial issues | 40% | Adults age 25+ living with a parent/grandparent or with an adult child/grandchild age 25+; adult family members other than spouse/partner October 18–24, 2021 · United States · Explicit reported question/analytic base n=1,548 | Original source [S02] Topline printed p.4, MULTIGENWHY a–f |
| Give or receive adult-family care | 25% | Adults age 25+ living with a parent/grandparent or with an adult child/grandchild age 25+; adult family members other than spouse/partner October 18–24, 2021 · United States · Explicit reported question/analytic base n=1,548 | Original source [S02] Topline printed p.4, MULTIGENWHY a–f |
| Provide or receive help with childcare | 12% | Adults age 25+ living with a parent/grandparent or with an adult child/grandchild age 25+; adult family members other than spouse/partner October 18–24, 2021 · United States · Explicit reported question/analytic base n=1,548 | Original source [S02] Topline printed p.4, MULTIGENWHY a–f |
| Companionship | 12% | Adults age 25+ living with a parent/grandparent or with an adult child/grandchild age 25+; adult family members other than spouse/partner October 18–24, 2021 · United States · Explicit reported question/analytic base n=1,548 | Original source [S02] Topline printed p.4, MULTIGENWHY a–f |
| Always had this arrangement | 28% | Adults age 25+ living with a parent/grandparent or with an adult child/grandchild age 25+; adult family members other than spouse/partner October 18–24, 2021 · United States · Explicit reported question/analytic base n=1,548 | Original source [S02] Topline printed p.4, MULTIGENWHY a–f |
| Change in relationship status | 15% | Adults age 25+ living with a parent/grandparent or with an adult child/grandchild age 25+; adult family members other than spouse/partner October 18–24, 2021 · United States · Explicit reported question/analytic base n=1,548 | Original source [S02] Topline printed p.4, MULTIGENWHY a–f |
The experience survey was conducted October 18–24, 2021. Its 9,676-person full wave includes a 1,548-person multigenerational analytic group, defined using ages 25 and older. The six reason items each ask whether the factor is major, minor or not a reason. More than one reason can apply to one respondent. Financial issues being the most common major reason does not establish that every household formed mainly to save money. Pew Research Center [S02].
How do adults experience the arrangement?

F04 Published report combined positive/negative categories and neutral category. 2021 survey, respondents 25+ under source’s 25+ multigenerational rule. Excludes spouse/partner from adult-family-member wording. Dated self-reports; no causal inference. Published positive NET 56 used, not 30+27 rounded components; no-answer omitted and rounded total is 99.
| Measure / group | Published result | Eligible audience, period and base | Source |
|---|---|---|---|
| Very or somewhat positive | 56% | Adults age 25+ living with a parent/grandparent or with an adult child/grandchild age 25+; adult family members other than spouse/partner October 18–24, 2021 · United States · Explicit reported question/analytic base n=1,548 | Original source [S02] Report physical p.21 / printed p.20, overall chart |
| Very or somewhat negative | 17% | Adults age 25+ living with a parent/grandparent or with an adult child/grandchild age 25+; adult family members other than spouse/partner October 18–24, 2021 · United States · Explicit reported question/analytic base n=1,548 | Original source [S02] Report physical p.21 / printed p.20, overall chart |
| Neither positive nor negative | 26% | Adults age 25+ living with a parent/grandparent or with an adult child/grandchild age 25+; adult family members other than spouse/partner October 18–24, 2021 · United States · Explicit reported question/analytic base n=1,548 | Original source [S02] Report physical p.21 / printed p.20, overall chart |
F05 Very or somewhat positive, within adjusted family-income tiers. 2021 survey, respondents 25+ under source’s 25+ multigenerational rule. Excludes spouse/partner from adult-family-member wording. Dated self-reports; no causal inference. Income tiers use 2020 family income adjusted for household size and location. Subgroup n unavailable.
| Measure / group | Published result | Eligible audience, period and base | Source |
|---|---|---|---|
| Upper income | 71% | Adults age 25+ living with a parent/grandparent or with an adult child/grandchild age 25+; adult family members other than spouse/partner October 18–24, 2021 · United States · Exact valid item/subgroup n unavailable | Original source [S02] Report physical p.21 / printed p.20, income rows |
| Middle income | 59% | Adults age 25+ living with a parent/grandparent or with an adult child/grandchild age 25+; adult family members other than spouse/partner October 18–24, 2021 · United States · Exact valid item/subgroup n unavailable | Original source [S02] Report physical p.21 / printed p.20, income rows |
| Lower income | 50% | Adults age 25+ living with a parent/grandparent or with an adult child/grandchild age 25+; adult family members other than spouse/partner October 18–24, 2021 · United States · Exact valid item/subgroup n unavailable | Original source [S02] Report physical p.21 / printed p.20, income rows |
F06 Published all-or-most-of-the-time NET for each separate MULTIGENFEEL item. 2021 survey, respondents 25+ under source’s 25+ multigenerational rule. Excludes spouse/partner from adult-family-member wording. Dated self-reports; no causal inference. Items independently rated. Stressful NET 23 retained, not rounded 7+17=24.
| Measure / group | Published result | Eligible audience, period and base | Source |
|---|---|---|---|
| Convenient | 58% | Adults age 25+ living with a parent/grandparent or with an adult child/grandchild age 25+; adult family members other than spouse/partner October 18–24, 2021 · United States · Explicit reported question/analytic base n=1,548 | Original source [S02] Report physical p.22 / printed p.21, all/most column |
| Rewarding | 54% | Adults age 25+ living with a parent/grandparent or with an adult child/grandchild age 25+; adult family members other than spouse/partner October 18–24, 2021 · United States · Explicit reported question/analytic base n=1,548 | Original source [S02] Report physical p.22 / printed p.21, all/most column |
| Stressful | 23% | Adults age 25+ living with a parent/grandparent or with an adult child/grandchild age 25+; adult family members other than spouse/partner October 18–24, 2021 · United States · Explicit reported question/analytic base n=1,548 | Original source [S02] Report physical p.22 / printed p.21, all/most column |
F07 Stressful all or most of the time, by respondent’s role. 2021 survey, respondents 25+ under source’s 25+ multigenerational rule. Excludes spouse/partner from adult-family-member wording. Dated self-reports; no causal inference. Separate unpaired respondent groups; not matched parent–child disagreements. Subgroup n unavailable.
| Measure / group | Published result | Eligible audience, period and base | Source |
|---|---|---|---|
| Adult living with a parent | 31% | Adults age 25+ living with a parent/grandparent or with an adult child/grandchild age 25+; adult family members other than spouse/partner October 18–24, 2021 · United States · Exact valid item/subgroup n unavailable | Original source [S02] Experience section, paragraph under feelings chart; report printed p.21 |
| Parent living with an adult child | 18% | Adults age 25+ living with a parent/grandparent or with an adult child/grandchild age 25+; adult family members other than spouse/partner October 18–24, 2021 · United States · Exact valid item/subgroup n unavailable | Original source [S02] Experience section, paragraph under feelings chart; report printed p.21 |
A positive overall assessment, frequent convenience and frequent stress are different questions. They can describe the same person’s experience. The published report combines responses before rounding: its positive NET is 56%, although rounded “very” and “somewhat” categories add to 57%; its stressful all/most NET is 23%, although rounded components add to 24%. We retain the publisher’s combined values. The adult-child and parent comparisons are separate respondent groups, not matched family pairs.
For evidence on contact, closeness and support beyond sharing an address, see our parent–adult child relationship statistics.
Does living together help personal finances?
F08 MULTIGENFINAN two separate helpful response categories. 2021 survey, respondents 25+ under source’s 25+ multigenerational rule. Excludes spouse/partner from adult-family-member wording. Dated self-reports; no causal inference. These are categories of perceived help, not verified savings amounts or a separately published combined rate.
| Measure / group | Published result | Eligible audience, period and base | Source |
|---|---|---|---|
| Helps a lot | 22% | Adults age 25+ living with a parent/grandparent or with an adult child/grandchild age 25+; adult family members other than spouse/partner October 18–24, 2021 · United States · Explicit reported question/analytic base n=1,548 | Original source [S02] Topline printed p.5, MULTIGENFINAN |
| Helps a little | 18% | Adults age 25+ living with a parent/grandparent or with an adult child/grandchild age 25+; adult family members other than spouse/partner October 18–24, 2021 · United States · Explicit reported question/analytic base n=1,548 | Original source [S02] Topline printed p.5, MULTIGENFINAN |
F09 Helps a lot or a little, within adjusted family-income tiers. 2021 survey, respondents 25+ under source’s 25+ multigenerational rule. Excludes spouse/partner from adult-family-member wording. Dated self-reports; no causal inference. Published combined help responses; income association, not an income effect or realized saving amount.
| Measure / group | Published result | Eligible audience, period and base | Source |
|---|---|---|---|
| Lower income | 50% | Adults age 25+ living with a parent/grandparent or with an adult child/grandchild age 25+; adult family members other than spouse/partner October 18–24, 2021 · United States · Exact valid item/subgroup n unavailable | Original source [S02] Half of lower-income adults see financial benefits section |
| Middle income | 36% | Adults age 25+ living with a parent/grandparent or with an adult child/grandchild age 25+; adult family members other than spouse/partner October 18–24, 2021 · United States · Exact valid item/subgroup n unavailable | Original source [S02] Half of lower-income adults see financial benefits section |
| Upper income | 24% | Adults age 25+ living with a parent/grandparent or with an adult child/grandchild age 25+; adult family members other than spouse/partner October 18–24, 2021 · United States · Exact valid item/subgroup n unavailable | Original source [S02] Half of lower-income adults see financial benefits section |
The finances question asks how the arrangement affects the respondent’s personal financial situation. It measures perceived help rather than a dollar saving, ownership of pooled funds or every member’s financial security. Income tiers use family income adjusted for household size and geographic purchasing power, based on 2020 income. These cross-sectional differences do not show what would happen if the same family changed its living arrangement.
Do adults see the arrangement as temporary?
F10 MULTIGENPERM, respondent’s current expectation. 2021 survey, respondents 25+ under source’s 25+ multigenerational rule. Excludes spouse/partner from adult-family-member wording. Dated self-reports; no causal inference. Not observed subsequent duration; rounded total 99 with no-answer omitted.
| Measure / group | Published result | Eligible audience, period and base | Source |
|---|---|---|---|
| Long-term situation | 41% | Adults age 25+ living with a parent/grandparent or with an adult child/grandchild age 25+; adult family members other than spouse/partner October 18–24, 2021 · United States · Explicit reported question/analytic base n=1,548 | Original source [S02] Topline printed p.3, MULTIGENPERM |
| Temporary situation | 34% | Adults age 25+ living with a parent/grandparent or with an adult child/grandchild age 25+; adult family members other than spouse/partner October 18–24, 2021 · United States · Explicit reported question/analytic base n=1,548 | Original source [S02] Topline printed p.3, MULTIGENPERM |
| Do not know | 24% | Adults age 25+ living with a parent/grandparent or with an adult child/grandchild age 25+; adult family members other than spouse/partner October 18–24, 2021 · United States · Explicit reported question/analytic base n=1,548 | Original source [S02] Topline printed p.3, MULTIGENPERM |
Calling an arrangement temporary or long-term is an expectation at the interview date. It is not a follow-up record of who eventually moved or how long everyone remained together. The published categories total 99% after rounding and a small no-answer share; no missing share is invented.
How do adults assess space and household responsibilities?
F11 HHSPACE, subjective space to live comfortably. 2021 survey, respondents 25+ under source’s 25+ multigenerational rule. Excludes spouse/partner from adult-family-member wording. Dated self-reports; no causal inference. Self-assessment, not a bedroom-standard overcrowding measure.
| Measure / group | Published result | Eligible audience, period and base | Source |
|---|---|---|---|
| Plenty of space to live comfortably | 72% | Adults age 25+ living with a parent/grandparent or with an adult child/grandchild age 25+; adult family members other than spouse/partner October 18–24, 2021 · United States · Explicit reported question/analytic base n=1,548 | Original source [S02] Topline printed p.3, HHSPACE multigenerational column |
| Not enough space to live comfortably | 28% | Adults age 25+ living with a parent/grandparent or with an adult child/grandchild age 25+; adult family members other than spouse/partner October 18–24, 2021 · United States · Explicit reported question/analytic base n=1,548 | Original source [S02] Topline printed p.3, HHSPACE multigenerational column |
F12 Plenty of space to live comfortably, within income tiers. 2021 survey, respondents 25+ under source’s 25+ multigenerational rule. Excludes spouse/partner from adult-family-member wording. Dated self-reports; no causal inference. Subjective group reports; no measured floor space or causal income effect.
| Measure / group | Published result | Eligible audience, period and base | Source |
|---|---|---|---|
| Upper income | 90% | Adults age 25+ living with a parent/grandparent or with an adult child/grandchild age 25+; adult family members other than spouse/partner October 18–24, 2021 · United States · Exact valid item/subgroup n unavailable | Original source [S02] Most adults say there is plenty of space section |
| Middle income | 79% | Adults age 25+ living with a parent/grandparent or with an adult child/grandchild age 25+; adult family members other than spouse/partner October 18–24, 2021 · United States · Exact valid item/subgroup n unavailable | Original source [S02] Most adults say there is plenty of space section |
| Lower income | 62% | Adults age 25+ living with a parent/grandparent or with an adult child/grandchild age 25+; adult family members other than spouse/partner October 18–24, 2021 · United States · Exact valid item/subgroup n unavailable | Original source [S02] Most adults say there is plenty of space section |
F13 Do more than half or all household chores and responsibilities. 2021 survey, respondents 25+ under source’s 25+ multigenerational rule. Excludes spouse/partner from adult-family-member wording. Dated self-reports; no causal inference. Separate respondent reports, not paired couples or observed time use.
| Measure / group | Published result | Eligible audience, period and base | Source |
|---|---|---|---|
| Women | 66% | Adults age 25+ living with a parent/grandparent or with an adult child/grandchild age 25+; adult family members other than spouse/partner October 18–24, 2021 · United States · Exact valid item/subgroup n unavailable | Original source [S02] Women more likely than men to cover chores section |
| Men | 56% | Adults age 25+ living with a parent/grandparent or with an adult child/grandchild age 25+; adult family members other than spouse/partner October 18–24, 2021 · United States · Exact valid item/subgroup n unavailable | Original source [S02] Women more likely than men to cover chores section |
Pew’s space question is a personal assessment of whether there is plenty of space to live comfortably. It should not be substituted for a census bedroom-standard crowding measure. Chore responses are also self-reports by separate respondents, rather than observed time use or shares reconciled within each household.
How many Canadian households and residents are multigenerational?
F14 Published household count in 2011 and 2021. Three or more generations of the same family. Original study’s 2011 baseline used; companion Plus article’s 2001 wording not adopted.
| Measure / group | Published result | Eligible audience, period and base | Source |
|---|---|---|---|
| 2011 | 364,505 households | Canadian private multigenerational households in 2011 2011 Census · Canada, provinces and territories · Exact valid item/subgroup n unavailable | Original source [S03] Introduction, 441,750 and 364,505 paragraph |
| 2021 | 441,750 households | Canadian private multigenerational households in 2021 2021 Census · Canada, provinces and territories · Exact valid item/subgroup n unavailable | Original source [S03] Introduction, 441,750 and 364,505 paragraph |
F15 Table 1 published count of persons in multigenerational private households. Population count, not household count, sample size or a count of three-generation family units.
| Measure / group | Published result | Eligible audience, period and base | Source |
|---|---|---|---|
| Persons in multigenerational households | 2,360,760 persons | Persons living in Canadian private multigenerational households 2021 Census · Canada, provinces and territories · Exact valid item/subgroup n unavailable | Original source [S03] Table 1, Canada, number of persons living in multigenerational households |
Statistics Canada’s original August 2025 study identifies 364,505 multigenerational households in 2011 and 441,750 in 2021. A companion Plus article instead labels that same baseline 2001. This resource follows the original study’s 2011 dating and discloses the inconsistency. Household counts and resident counts answer different questions; neither is an unweighted survey sample size. Statistics Canada [S03].
Where is multigenerational living more common in Canada?
F16 Proportion of all persons in private households who live in multigenerational households. Within-place population rate, not share of households or distribution of Canada’s multigenerational residents. National and subnational rows are not additive.
| Measure / group | Published result | Eligible audience, period and base | Source |
|---|---|---|---|
| Canada | 6.5% | All persons in private households in Canada 2021 Census · Canada · Exact valid item/subgroup n unavailable | Original source [S03] Table 1, proportion of all persons in private households column |
| Newfoundland and Labrador | 4.1% | All persons in private households in Newfoundland and Labrador 2021 Census · Newfoundland and Labrador, Canada · Exact valid item/subgroup n unavailable | Original source [S03] Table 1, proportion of all persons in private households column |
| Prince Edward Island | 3.3% | All persons in private households in Prince Edward Island 2021 Census · Prince Edward Island, Canada · Exact valid item/subgroup n unavailable | Original source [S03] Table 1, proportion of all persons in private households column |
| Nova Scotia | 4.3% | All persons in private households in Nova Scotia 2021 Census · Nova Scotia, Canada · Exact valid item/subgroup n unavailable | Original source [S03] Table 1, proportion of all persons in private households column |
| New Brunswick | 4.1% | All persons in private households in New Brunswick 2021 Census · New Brunswick, Canada · Exact valid item/subgroup n unavailable | Original source [S03] Table 1, proportion of all persons in private households column |
| Quebec | 3.1% | All persons in private households in Quebec 2021 Census · Quebec, Canada · Exact valid item/subgroup n unavailable | Original source [S03] Table 1, proportion of all persons in private households column |
| Ontario | 8.4% | All persons in private households in Ontario 2021 Census · Ontario, Canada · Exact valid item/subgroup n unavailable | Original source [S03] Table 1, proportion of all persons in private households column |
| Manitoba | 6.0% | All persons in private households in Manitoba 2021 Census · Manitoba, Canada · Exact valid item/subgroup n unavailable | Original source [S03] Table 1, proportion of all persons in private households column |
| Saskatchewan | 4.9% | All persons in private households in Saskatchewan 2021 Census · Saskatchewan, Canada · Exact valid item/subgroup n unavailable | Original source [S03] Table 1, proportion of all persons in private households column |
| Alberta | 6.1% | All persons in private households in Alberta 2021 Census · Alberta, Canada · Exact valid item/subgroup n unavailable | Original source [S03] Table 1, proportion of all persons in private households column |
| British Columbia | 8.5% | All persons in private households in British Columbia 2021 Census · British Columbia, Canada · Exact valid item/subgroup n unavailable | Original source [S03] Table 1, proportion of all persons in private households column |
| Yukon | 4.5% | All persons in private households in Yukon 2021 Census · Yukon, Canada · Exact valid item/subgroup n unavailable | Original source [S03] Table 1, proportion of all persons in private households column |
| Northwest Territories | 8.3% | All persons in private households in Northwest Territories 2021 Census · Northwest Territories, Canada · Exact valid item/subgroup n unavailable | Original source [S03] Table 1, proportion of all persons in private households column |
| Nunavut | 24.9% | All persons in private households in Nunavut 2021 Census · Nunavut, Canada · Exact valid item/subgroup n unavailable | Original source [S03] Table 1, proportion of all persons in private households column |
The Canadian regional percentages are the share of people in private households within each place who live in a three-generation household. They are not the share of a province’s households or that province’s contribution to the national multigenerational population. The national total and subnational rates are not additive.
What do Canadian housing indicators show?
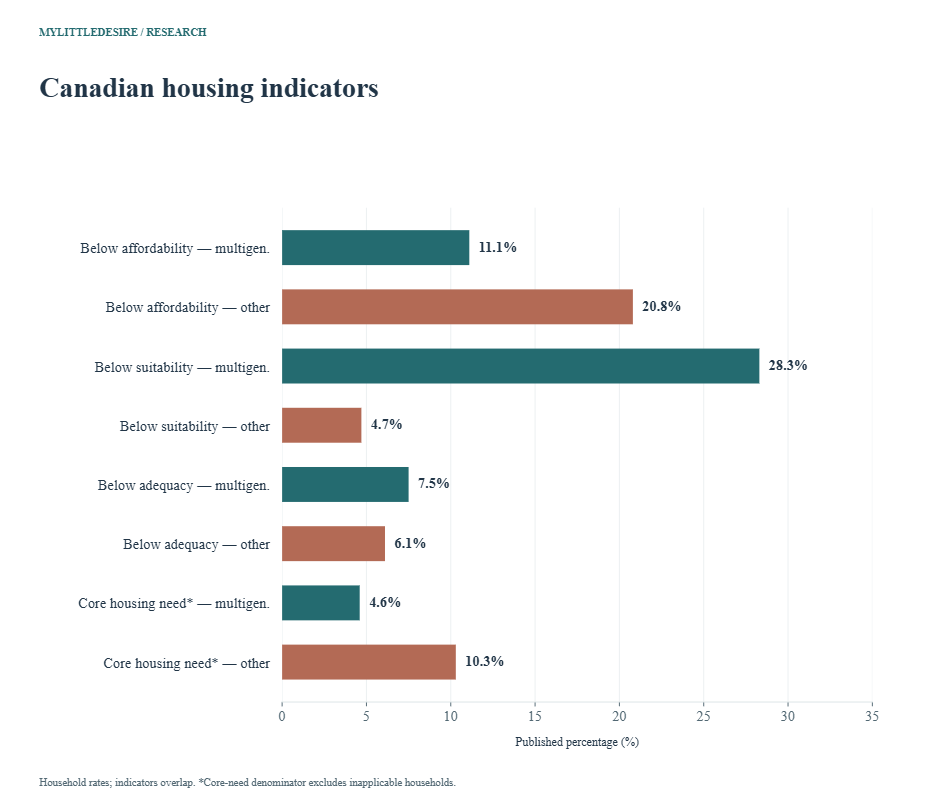
F17 Table 4 published household rates: affordability, suitability, adequacy and core need. Thresholds differ and can overlap. Suitability uses National Occupancy Standard, adequacy major repairs, affordability shelter cost/income. Core-need denominator excludes inapplicable households; no universal financial-protection claim.
| Measure / group | Published result | Eligible audience, period and base | Source |
|---|---|---|---|
| Below affordability threshold — Multigenerational households | 11.1% | Multigenerational households in the source’s 2021 housing-indicator universe 2021 Census; affordability income basis 2020 · Canada, provinces and territories · Exact valid item/subgroup n unavailable | Original source [S03] Table 4, four selected indicator rows |
| Below affordability threshold — Other households | 20.8% | Other households in the source’s 2021 housing-indicator universe 2021 Census; affordability income basis 2020 · Canada, provinces and territories · Exact valid item/subgroup n unavailable | Original source [S03] Table 4, four selected indicator rows |
| Below suitability threshold — Multigenerational households | 28.3% | Multigenerational households in the source’s 2021 housing-indicator universe 2021 Census; affordability income basis 2020 · Canada, provinces and territories · Exact valid item/subgroup n unavailable | Original source [S03] Table 4, four selected indicator rows |
| Below suitability threshold — Other households | 4.7% | Other households in the source’s 2021 housing-indicator universe 2021 Census; affordability income basis 2020 · Canada, provinces and territories · Exact valid item/subgroup n unavailable | Original source [S03] Table 4, four selected indicator rows |
| Below adequacy threshold — Multigenerational households | 7.5% | Multigenerational households in the source’s 2021 housing-indicator universe 2021 Census; affordability income basis 2020 · Canada, provinces and territories · Exact valid item/subgroup n unavailable | Original source [S03] Table 4, four selected indicator rows |
| Below adequacy threshold — Other households | 6.1% | Other households in the source’s 2021 housing-indicator universe 2021 Census; affordability income basis 2020 · Canada, provinces and territories · Exact valid item/subgroup n unavailable | Original source [S03] Table 4, four selected indicator rows |
| In core housing need — Multigenerational households | 4.6% | Eligible Multigenerational households for core housing need, excluding inapplicable households 2021 Census; affordability income basis 2020 · Canada, provinces and territories · Exact valid item/subgroup n unavailable | Original source [S03] Table 4, four selected indicator rows |
| In core housing need — Other households | 10.3% | Eligible Other households for core housing need, excluding inapplicable households 2021 Census; affordability income basis 2020 · Canada, provinces and territories · Exact valid item/subgroup n unavailable | Original source [S03] Table 4, four selected indicator rows |
The Canadian study finds different patterns across housing indicators. Below-suitability rates are higher for multigenerational households, while below-affordability and core-need rates are lower. This does not establish that coresidence causes either outcome. Affordability uses household income and can conceal differences in individual access to resources. Suitability uses the National Occupancy Standard; adequacy concerns major repairs.
Core housing need adds conditions involving acceptable alternative housing and income. Its denominator excludes inapplicable households—3.9% of multigenerational and 4.2% of other households in the source. It is therefore not interchangeable with any single threshold failure or with “everyone with a housing problem.”
What do England and Wales census figures show?
F21 Main article section 6, 2021 overall household proportion. All households, different from the child-containing-only Table 1b. Includes grandparent–grandchild homes without the middle generation; not a whole-UK rate. No 2011 trend constructed.
| Measure / group | Published result | Eligible audience, period and base | Source |
|---|---|---|---|
| All-household multigenerational share | 2.1% | All households in England and Wales March 21, 2021 Census Day; only 2021 cells selected · England and Wales, not the whole United Kingdom · Exact valid item/subgroup n unavailable | Original source [S04] Main article section 6, first paragraph, 2021 value |
ONS defines the arrangement to include grandparent–grandchild homes even when the middle generation is absent. The 2.1% overall rate covers households across England and Wales. The custom tables below have narrower universes: one counts dependent children and the other counts households containing dependent children. They do not cover Scotland or Northern Ireland. Office for National Statistics [S04].
F18 Table 1a, 2021 dependent-child counts by household type. England and Wales Census 2021, custom-table counts rounded to nearest five. Dependent child definition includes eligible full-time students age 16–18; not all under-18 children. No suppressed cells selected. Persons, not household units; non-multigenerational and total are denominator context.
| Measure / group | Published result | Eligible audience, period and base | Source |
|---|---|---|---|
| In multigenerational family households | 678,875 persons | Households for overall prevalence; dependent children for Table 1a; households containing dependent children for Table 1b March 21, 2021 Census Day; only 2021 cells selected · England and Wales, not the whole United Kingdom · Exact valid item/subgroup n unavailable | Original source [S04] Original XLSX Table 1a, cells C8:C10 |
| Not in multigenerational family households | 11,893,220 persons | Households for overall prevalence; dependent children for Table 1a; households containing dependent children for Table 1b March 21, 2021 Census Day; only 2021 cells selected · England and Wales, not the whole United Kingdom · Exact valid item/subgroup n unavailable | Original source [S04] Original XLSX Table 1a, cells C8:C10 |
| All dependent children | 12,572,095 persons | Households for overall prevalence; dependent children for Table 1a; households containing dependent children for Table 1b March 21, 2021 Census Day; only 2021 cells selected · England and Wales, not the whole United Kingdom · Exact valid item/subgroup n unavailable | Original source [S04] Original XLSX Table 1a, cells C8:C10 |
F19 Table 1b, households containing dependent children only. England and Wales Census 2021, custom-table counts rounded to nearest five. Dependent child definition includes eligible full-time students age 16–18; not all under-18 children. No suppressed cells selected. Household counts, not prevalence rates. Occupancy -1 or less is overcrowded; 0 or more includes sufficient and surplus bedrooms. Different group totals must remain attached.
| Measure / group | Published result | Eligible audience, period and base | Source |
|---|---|---|---|
| Occupancy -1 or less: overcrowded | 137,495 households | Multigenerational family households containing dependent children in England and Wales March 21, 2021 Census Day; only 2021 cells selected · England and Wales, not the whole United Kingdom · Exact valid item/subgroup n unavailable | Original source [S04] Original XLSX Table 1b, cells B8:D8 |
| Occupancy 0 or more | 264,340 households | Multigenerational family households containing dependent children in England and Wales March 21, 2021 Census Day; only 2021 cells selected · England and Wales, not the whole United Kingdom · Exact valid item/subgroup n unavailable | Original source [S04] Original XLSX Table 1b, cells B8:D8 |
| Total eligible households | 401,835 households | Multigenerational family households containing dependent children in England and Wales March 21, 2021 Census Day; only 2021 cells selected · England and Wales, not the whole United Kingdom · Exact valid item/subgroup n unavailable | Original source [S04] Original XLSX Table 1b, cells B8:D8 |
F20 Table 1b, households containing dependent children only. England and Wales Census 2021, custom-table counts rounded to nearest five. Dependent child definition includes eligible full-time students age 16–18; not all under-18 children. No suppressed cells selected. Household counts, not prevalence rates. Occupancy -1 or less is overcrowded; 0 or more includes sufficient and surplus bedrooms. Different group totals must remain attached.
| Measure / group | Published result | Eligible audience, period and base | Source |
|---|---|---|---|
| Occupancy -1 or less: overcrowded | 663,305 households | Other households containing dependent children in England and Wales March 21, 2021 Census Day; only 2021 cells selected · England and Wales, not the whole United Kingdom · Exact valid item/subgroup n unavailable | Original source [S04] Original XLSX Table 1b, cells B9:D9 |
| Occupancy 0 or more | 5,980,725 households | Other households containing dependent children in England and Wales March 21, 2021 Census Day; only 2021 cells selected · England and Wales, not the whole United Kingdom · Exact valid item/subgroup n unavailable | Original source [S04] Original XLSX Table 1b, cells B9:D9 |
| Total eligible households | 6,644,030 households | Other households containing dependent children in England and Wales March 21, 2021 Census Day; only 2021 cells selected · England and Wales, not the whole United Kingdom · Exact valid item/subgroup n unavailable | Original source [S04] Original XLSX Table 1b, cells B9:D9 |
Keep the ONS restrictions attached. The 401,835 total is multigenerational households containing dependent children, not all multigenerational homes. A dependent child includes ages 0–15 and eligible full-time students aged 16–18 under the source’s family rules. Occupancy 0 or more combines sufficient and surplus bedrooms. Custom-table counts are rounded to the nearest five.
ONS’s dictionary describes the variable as new for 2021 and not comparable with 2011, while other ONS releases present historical comparisons. We select only the 2021 cells and do not construct a trend across that unresolved comparability boundary. For distinctions between sharing a home, grandparent-headed households and providing care, see our grandparent–grandchild relationship statistics.
How should readers use these statistics?
A citation-ready sentence should identify the country or coverage, actual reference period, generation rule, age threshold, unit and denominator. Use the US survey for dated perceptions and reasons, the US census/ACS analysis for its published population series, and the Canadian or ONS tables for their specified census populations.
For personal discussions, the findings can prompt questions about space, privacy, shared costs, chores and expected duration. These are discussion prompts, not interventions tested by the selected studies. The evidence does not establish one ideal family structure or a causal wellbeing benefit from living together.
Ten reproducible descriptive comparisons
The workbook subtracts compatible published values by stable observation ID. Nine differences are percentage points; the Canadian count change is households. These calculations use rounded source inputs and add no new significance tests or confidence intervals.
| ID | Comparison | First | Second | Difference | Qualification |
|---|---|---|---|---|---|
| C01 | US population share: 2024 minus 1970 | 22% | 13% | +9 percentage points | Published 2026 series, 18+ adult rule; mixed decennial/ACS sources, rounded inputs. Descriptive arithmetic; no new significance test. |
| C02 | US 2024 prevalence: Asian minus White | 30% | 16% | +14 percentage points | Within-race population rates; single-race non-Hispanic groups, no causal interpretation. Descriptive arithmetic; no new significance test. |
| C03 | Major reason: finances minus adult care | 40% | 25% | +15 percentage points | Independently rated items among same eligible respondents; reasons can overlap. Descriptive arithmetic; no new significance test. |
| C04 | Positive experience: upper minus lower income | 71% | 50% | +21 percentage points | Within-tier very/somewhat positive responses, not an income effect. Descriptive arithmetic; no new significance test. |
| C05 | Stressful all/most: adult child minus parent | 31% | 18% | +13 percentage points | Unpaired respondent role groups, not matched-family disagreement. Descriptive arithmetic; no new significance test. |
| C06 | Financial help: lower minus upper income | 50% | 24% | +26 percentage points | Perceived help at least a little, not measured savings or causal benefit. Descriptive arithmetic; no new significance test. |
| C07 | Plenty of space: upper minus lower income | 90% | 62% | +28 percentage points | Subjective space ratings, not measured floor area or bedroom occupancy. Descriptive arithmetic; no new significance test. |
| C08 | Canada below suitability: multigenerational minus other | 28.3% | 4.7% | +23.6 percentage points | Bedroom-standard household rates, not personal perceptions or a causal effect. Descriptive arithmetic; no new significance test. |
| C09 | Canada multigenerational households: 2021 minus 2011 | 441,750 households | 364,505 households | +77,245 households | Absolute published count change, not percentage-point or percent growth; source rounded census counts. Descriptive arithmetic; no new significance test. |
| C10 | Canada population prevalence: Nunavut minus Quebec | 24.9% | 3.1% | +21.8 percentage points | Within-place private-household population rates, not shares of households or a causal geographic effect. Descriptive arithmetic; no new significance test. |
Common questions
What percentage of Americans live in multigenerational households?
Pew’s March 2026 census/ACS analysis reports 22% of the total US population in 2024, using two or more adult generations with adults 18+, or grandparents with grandchildren. This is a person share, not a household share.
Does multigenerational always mean three generations?
No. The selected Canadian study requires three generations. Pew’s 2026 definition can include two adult generations, and ONS also includes skipped-generation grandparent–grandchild homes.
Why do US adults live with other generations?
In the October 2021 eligible survey group, financial issues were a major reason for 40%, always having had the arrangement for 28%, and adult-family care for 25%. Reasons were independently rated and could overlap.
Is living together positive or stressful?
In the dated US survey, 56% assessed the experience as very/somewhat positive. Separately, 23% found it stressful all or most of the time. These are different questions and can coexist.
How many multigenerational households were in Canada?
The original study reports 441,750 in 2021 under a three-or-more-generations rule. It also reports 2,360,760 people in those private households; people and household counts differ.
Are the England and Wales figures UK-wide?
No. Scotland and Northern Ireland are outside these selected ONS tables. The 2.1% overall household figure and child-containing-only crowding counts also have different denominators.
Do the housing statistics prove that coresidence saves money?
No causal saving effect is established. Household-level affordability and personal financial-help reports use different instruments and cannot establish every member’s financial security.
Research method and limitations
Selection and concentration. The database contains 78 observations in 21 groups from four numerical source records and three publisher labels. Pew’s 2026 analysis contributes 11 and its 2021 experience survey 32; Statistics Canada contributes 25 and ONS 10. Pew supplies 43 observations across two distinct analyses. Related categories, subgroups and geographic cells are not independent studies; charts and ten differences reuse inputs. MyLittleDesire conducted no new survey.
Verification. The original Pew 2026 article, accessible chart tables and one-page methodology were checked. The 2021 experience article, report, topline and methods were checked; report physical pages 21–22 were rendered and visually inspected to confirm published combined figures. Statistics Canada’s original study, Tables 1 and 4 and definitions were checked. ONS’s original XLSX cover, notes and 2021 cells in Tables 1a/1b, main article and variable dictionary were checked. Published aggregates were verified; confidential respondent records were not audited.
Bases and numeric types. Nineteen overall survey observations have an explicit question/analytic base of 1,548. The other 59 selected valid item/subgroup bases remain blank; all weighted bases remain blank. The full wave of 9,676 is separately labelled. Census estimates, including the ONS counts rounded to five, are results rather than raw respondent n. The database contains 66 percentages, eight household counts and four person counts. No raw count is reconstructed from a weighted percentage, and no full-sample error margin is transferred to a subgroup.
Compatibility. US 18+ prevalence and 25+ survey experience rules remain distinct; the older CPS/ASEC prevalence series is not spliced in. Canadian three-generation and ONS skipped-generation definitions differ. Person rates, household rates, dependent-child counts, child-containing-household counts, subjective space and bedroom-standard suitability remain separate. Reasons and feelings can overlap; published NETs are not replaced by rounded sums. Household-level financial conditions do not establish individual resource access.
Dating and exclusions. Actual periods are shown. ONS 2011 trends are withheld because of the dictionary’s comparability warning. The Canadian original study governs its 2011 baseline despite a companion article’s 2001 wording. No pooled global rate, comparable country ranking, causal effect, recommended family structure, new significance test or measured 2027 outcome is generated.
Maintenance. Recheck original definitions, age rules, sample/routing, unit, denominator and dates before replacing values. Change the review date only after a substantive source review, preserve useful dated findings and keep the evergreen article URL.
Original sources and supporting records
- Pew Research Center. The United States at 250 — population in multigenerational households [S01]
Published: March 25, 2026. Actual period: 1970, 1980, 1990, 2000 decennial censuses; 2010, 2019 and 2024 ACS.
Population: Total population in the source analysis; race/ethnicity-specific 2024 groups where labelled.
Study / analytic sample: Exact selected analytic n not supplied. Historical microdata: merged 1% samples in 1970, 5% in 1980–2000, and ACS/IPUMS; selected analytic and valid cell n unavailable.
Item bases: Percent of people, not percent of households. Exact analytic/unweighted and weighted cell bases not supplied beside selected values.
Method: Original 2026 article and two accessible chart data tables checked, with one-page methodology. Adults defined as 18+. Multigenerational households include two or more adult generations or grandparents with grandchildren. White, Black and Asian groups are single-race non-Hispanic; Hispanic is any race.
Limits: Published rounded percentages, not newly computed microdata. The series mixes decennial and ACS sources as published; no 2020 standard ACS point inserted. The 18+ adult rule differs from the 25+ survey definition in S02 and earlier CPS/ASEC prevalence analyses; do not splice those into a trend. No household rate, causal racial effect or comparable country ranking.
Supporting record 1 · Supporting record 2 · Supporting record 3 - Pew Research Center. Financial Issues Top the List of Reasons U.S. Adults Live in Multigenerational Homes — experiences [S02]
Published: March 24, 2022. Actual period: October 18–24, 2021.
Population: Adults age 25+ living with a parent/grandparent or with an adult child/grandchild age 25+; adult family members other than spouse/partner.
Study / analytic sample: 9,676. Full American Trends Panel wave n=9,676; selected multigenerational analytic/question base n=1,548. These are separate populations..
Item bases: Topline explicitly reports n=1,548 for selected overall questions, retained for 19 observations. Selected income, role and gender subgroup n unavailable and not assigned 1,548.
Method: Weighted probability-recruited American Trends Panel web survey managed by Ipsos; English/Spanish; internet access equipment provided where needed. Original article, report, topline and methods checked. Report physical pp.21–22 (printed 20–21) rendered and visually checked for published positive and all/most frequency NETs.
Limits: Dated 2021 self-reports, not 2027 experience rates. Reasons independently rated. Income groups based on adjusted 2020 family income, not a causal income effect. Separate adult-child/parent respondent groups are not matched family pairs. Published positive NET 56 and stressful all/most NET 23 retained, not replaced by sums of rounded topline categories (57 and 24). Space adequacy is subjective, not bedroom-standard crowding.
Supporting record 1 · Supporting record 2 · Supporting record 3 - Statistics Canada. Unpacking Canada’s multigenerational households: A look at the people who call them home [S03]
Published: August 14, 2025. Actual period: 2021 Census of Population; 2011 household count for historical comparison; 2020 income basis for housing affordability.
Population: People in private households for population rates; private household units for counts and housing indicators, with source-specific exclusions.
Study / analytic sample: Exact selected analytic n not supplied. Census published population/household estimates, not an interchangeable respondent n. Selected analytic and valid indicator bases unavailable..
Item bases: Table 1 population denominator is all persons in private households, not all households. Table 4 housing units are households; core-need denominator excludes inapplicable households (3.9% multigenerational, 4.2% other). Published weighted population counts are not raw sample sizes.
Method: Original study, Table 1 and Table 4, definitions and methods checked. Multigenerational means three or more generations of the same family sharing usual residence. Tables report published rounded census counts and percentages; no household members duplicated across usual residences. National Occupancy Standard defines suitability, 30%-of-before-tax-income rule affordability, and major repairs adequacy.
Limits: People and household denominators differ. Multigenerational excludes skipped-generation-only homes under this three-generation rule. Core housing need has additional income/alternative housing and eligibility rules; not identical to any housing problem. Affordability draws on 2020 income. No causal protection or claim of every resident’s financial security. Companion Statistics Canada Plus article misdates the 364,505 baseline as 2001; original study identifies 2011 and governs this package. - Office for National Statistics. Multi-generational family households: Census 2021 — custom tables and main release [S04]
Published: March 5, 2024 custom tables; May 10, 2023 main article. Actual period: March 21, 2021 Census Day; only 2021 cells selected.
Population: Households for overall prevalence; dependent children for Table 1a; households containing dependent children for Table 1b.
Study / analytic sample: Exact selected analytic n not supplied. Census estimates with custom-table counts rounded to nearest five; counts below 10 suppressed. Published counts are not unweighted sample bases..
Item bases: Table 1b is restricted to households containing dependent children. Table 1a is a person count of dependent children. Exact valid unweighted/weighted respondent bases unavailable; published counts stored as results, not sample n.
Method: Original ONS XLSX cover, notes, Table 1a and Table 1b read; main article section 6 and variable dictionary checked. Definition: more than two family generations, including grandparent–grandchild households whether or not middle generation present. Dependent child means age 0–15, or age 16–18 in full-time education meeting household/family rules. Bedroom occupancy rating -1 or less identifies overcrowding.
Limits: Coverage England and Wales only. Rounded table totals may differ; suppressed c is not zero and none selected. Occupancy rating 0 or more includes exactly sufficient and surplus bedrooms; not only exactly sufficient. Selected overcrowding counts exclude households without dependent children. Dictionary says new variable not comparable with 2011; no 2011 trend constructed even though source releases contain historical comparisons. Census Day fell during pandemic restrictions.
Supporting record 1 · Supporting record 2 · Supporting record 3
How to cite this resource
MyLittleDesire. Multigenerational Household Statistics 2027. https://mylittledesire.com/multigenerational-household-statistics/.