Parent–teen communication includes feeling able to talk, paying attention during a conversation, navigating disagreements and choosing the kind of support a young person wants. These are different experiences. In Pew’s September–October 2024 US survey, 52% of teens said they would be extremely or very comfortable discussing their mental health with a parent, while 80% of parents described that level of comfort talking with their teen. Each respondent rates their own comfort. Pew Research Center [S01].
This resource presents 67 published observations in 16 groups, four original charts and ten reproducible descriptive comparisons from four numerical source records and three publisher labels. It covers two US parent–teen surveys, a US study including preteens and teens, and Canadian school-based research. Related categories and subgroup cells are not independent studies.
52%
46%
Teens highly comfortable discussing own mental health with a parent.Pew, US teens 13–17; September–October 2024. Pew Research Center [S01]
Teens saying a parent is distracted by a phone at least sometimes during conversations.Pew, US teens 13–17; September–October 2023. Pew Research Center [S02]
60% / 64%
19%
Wanted parents to listen when upset, at ages 13–15 / 16–18.Gallup, US youth; March 2024. Gallup / Walton Family Foundation [S03]
Parents of 13–15-year-olds reporting communication difficulty.Gallup, parent report; March 2024. Gallup / Walton Family Foundation [S03]
What do parent teen communication statistics measure?
| Measure | What it captures | Interpretation boundary |
|---|---|---|
| Hypothetical comfort | How comfortable someone would be if they wanted to talk | Not actual disclosure or frequency |
| Perceived phone distraction | Whether a parent’s phone interrupts attempts to talk | Teen perception and parent self-report are separate |
| Phone-time arguments | How often respondents report a specific disagreement | Not all family conflict or relationship quality |
| Desired parental response | What a young person wants when upset | Preferences can overlap; not a tested intervention |
| Parent-reported difficulty | Parent says they struggle to communicate effectively | Not the teen’s rating or a clinical diagnosis |
| Ease talking to mother/father | School students reporting easy/very easy conversation with relevant parent | Different parent-availability denominators; not exact ages |
A parent and teen can answer different questions about the same relationship. Comfort, listening preferences and ease of talking are not interchangeable with broad emotional-support receipt or mental-health prevalence. Those adjacent figures are not counted as communication observations here.
Also Read:-
Multigenerational Household Statistics 2027
Family Time Togetherness Statistics 2027
Parenthood Relationship Satisfaction Statistics 2027
Parenting Partnership Roles Statistics 2027
How comfortable are parents and teens discussing mental health?
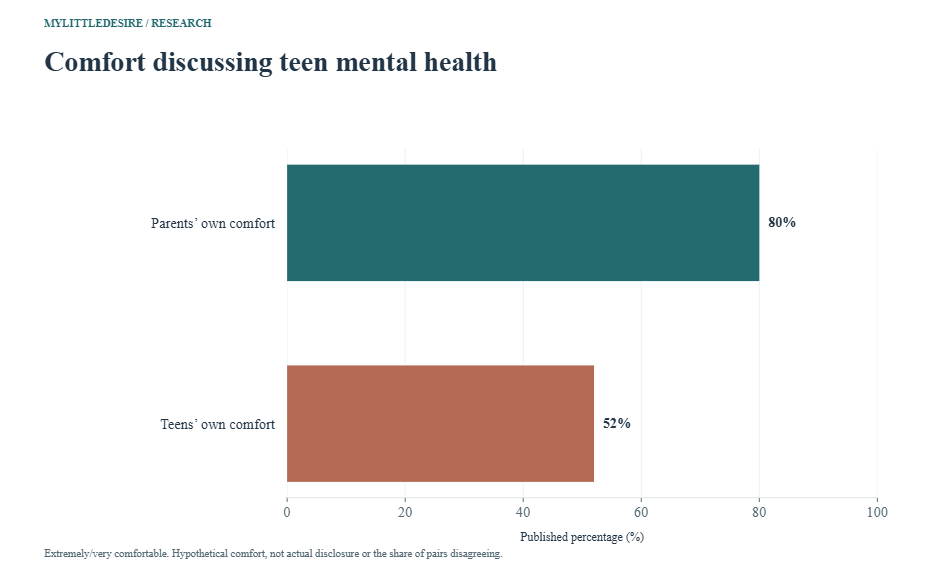
F01 Extremely or very comfortable, published combined responses. Comfort if wanted to talk, not actual disclosure or frequency. Parents describe their own comfort; teens theirs. Separate weighted populations, not a pair-disagreement rate.
| Measure / group | Published result | Eligible audience, period and base | Source |
|---|---|---|---|
| Parents, discussing teen’s mental health | 80% | US parents of teens age 13–17 September 18–October 10, 2024 · United States · Exact valid item/subgroup n unavailable | Original source [S01] Comfort levels with discussing mental health; PTTALKMH and TTALKMH b |
| Teens, discussing own mental health with a parent | 52% | US teens age 13–17 September 18–October 10, 2024 · United States · Exact valid item/subgroup n unavailable | Original source [S01] Comfort levels with discussing mental health; PTTALKMH and TTALKMH b |
F02 Not too or not at all comfortable, published combined responses. Comfort if wanted to talk, not actual disclosure or frequency. Parents describe their own comfort; teens theirs. Separate weighted populations, not a pair-disagreement rate. Not the complement of high comfort; somewhat comfortable is separate.
| Measure / group | Published result | Eligible audience, period and base | Source |
|---|---|---|---|
| Parents | 2% | US parents of teens age 13–17 September 18–October 10, 2024 · United States · Exact valid item/subgroup n unavailable | Original source [S01] Comfort section, not-too/not-at-all paragraph |
| Teens | 16% | US teens age 13–17 September 18–October 10, 2024 · United States · Exact valid item/subgroup n unavailable | Original source [S01] Comfort section, not-too/not-at-all paragraph |
F03 Parents extremely or very comfortable talking with teen about teen’s mental health. Parent self-report by gender, not teen ratings of different parents. Subgroup n unknown.
| Measure / group | Published result | Eligible audience, period and base | Source |
|---|---|---|---|
| Mothers | 84% | US mothers of teens age 13–17 September 18–October 10, 2024 · United States · Exact valid item/subgroup n unavailable | Original source [S01] Comfort section, mother/father paragraph |
| Fathers | 75% | US fathers of teens age 13–17 September 18–October 10, 2024 · United States · Exact valid item/subgroup n unavailable | Original source [S01] Comfort section, mother/father paragraph |
The 28-percentage-point difference between the overall parent and teen high-comfort estimates is descriptive arithmetic. It is not the percentage of parent–teen pairs who disagree, and it does not establish that parents overestimate a teen’s feelings. Parents describe their own comfort speaking to their teen; teens describe their own comfort speaking to a parent. The mother/father comparison also concerns parents’ own comfort, rather than teens comparing their two parents.
Who else would teens feel comfortable talking to?
F04 Extremely or very comfortable talking about own mental health with each person. Comparison context for parent comfort, not actual help-seeking or provider access. Published therapist NET 31 retained despite rounded components summing to 30.
| Measure / group | Published result | Eligible audience, period and base | Source |
|---|---|---|---|
| A friend | 48% | US teens age 13–17 September 18–October 10, 2024 · United States · Exact valid item/subgroup n unavailable | Original source [S01] Comfort section and TTALKMH a,c,d,e |
| A mental health therapist | 31% | US teens age 13–17 September 18–October 10, 2024 · United States · Exact valid item/subgroup n unavailable | Original source [S01] Comfort section and TTALKMH a,c,d,e |
| Family member other than parents | 26% | US teens age 13–17 September 18–October 10, 2024 · United States · Exact valid item/subgroup n unavailable | Original source [S01] Comfort section and TTALKMH a,c,d,e |
| A teacher | 12% | US teens age 13–17 September 18–October 10, 2024 · United States · Exact valid item/subgroup n unavailable | Original source [S01] Comfort section and TTALKMH a,c,d,e |
These responses concern potential comfort with each type of person. A teen might feel comfortable with more than one person, and the results do not show who actually received a disclosure or whether a therapist was accessible. The published therapist high-comfort figure is 31%; we retain that combined result even though its rounded component categories add to 30%. Pew Research Center [S01].
How do phones feature in family conversations?
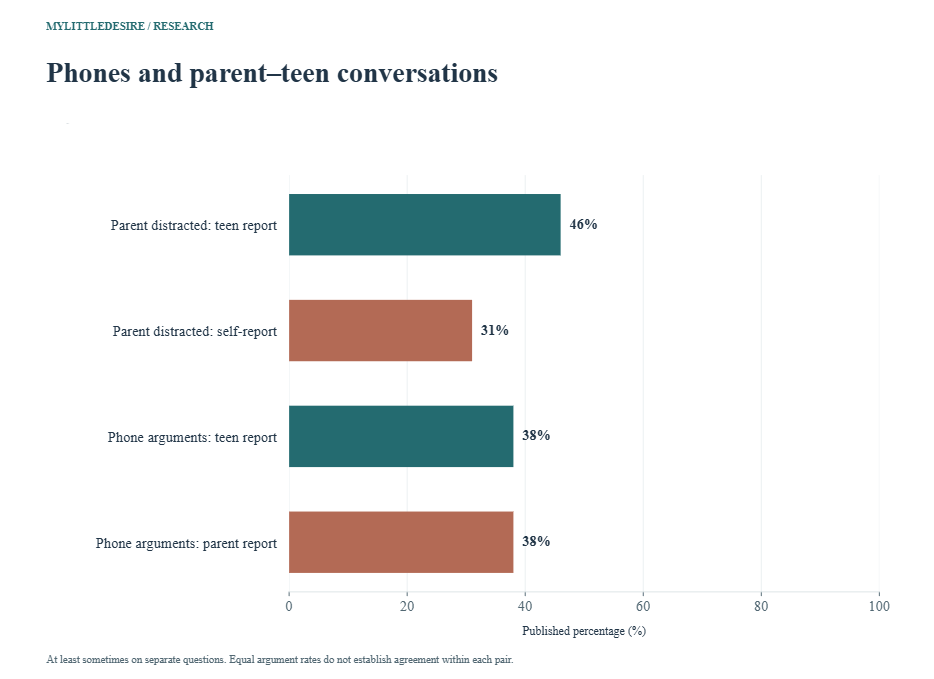
F05 Published overall at-least-sometimes, often and never responses. Selected published all-respondent figures, not routed smartphone-user-only cuts. At least sometimes includes often; rounded combined NETs retained. Equal aggregate 38% does not measure pairwise agreement. Categories shown are nested/incomplete, not an exclusive distribution.
| Measure / group | Published result | Eligible audience, period and base | Source |
|---|---|---|---|
| Teens: at least sometimes | 38% | US teens age 13–17 September 26–October 23, 2023 · United States · Exact valid item/subgroup n unavailable | Original source [S02] How often do parents and teens argue; TPSPARGU and PTSPARGU all-respondent cuts |
| Parents: at least sometimes | 38% | US parents of teens age 13–17 September 26–October 23, 2023 · United States · Exact valid item/subgroup n unavailable | Original source [S02] How often do parents and teens argue; TPSPARGU and PTSPARGU all-respondent cuts |
| Teens: often | 10% | US teens age 13–17 September 26–October 23, 2023 · United States · Exact valid item/subgroup n unavailable | Original source [S02] How often do parents and teens argue; TPSPARGU and PTSPARGU all-respondent cuts |
| Parents: often | 10% | US parents of teens age 13–17 September 26–October 23, 2023 · United States · Exact valid item/subgroup n unavailable | Original source [S02] How often do parents and teens argue; TPSPARGU and PTSPARGU all-respondent cuts |
| Teens: never | 31% | US teens age 13–17 September 26–October 23, 2023 · United States · Exact valid item/subgroup n unavailable | Original source [S02] How often do parents and teens argue; TPSPARGU and PTSPARGU all-respondent cuts |
| Parents: never | 25% | US parents of teens age 13–17 September 26–October 23, 2023 · United States · Exact valid item/subgroup n unavailable | Original source [S02] How often do parents and teens argue; TPSPARGU and PTSPARGU all-respondent cuts |
F06 Parent distracted by own smartphone when teen tries to talk; parent self-report versus teen perception. Selected published all-respondent figures, not routed smartphone-user-only cuts. At least sometimes includes often; rounded combined NETs retained. Often nested in at least sometimes. No observed attention or causal effect inferred.
| Measure / group | Published result | Eligible audience, period and base | Source |
|---|---|---|---|
| Teen report: at least sometimes | 46% | US teens age 13–17 September 26–October 23, 2023 · United States · Exact valid item/subgroup n unavailable | Original source [S02] Distracted parenting section; TPSPDIST and PSPDIST all-respondent cuts |
| Parent self-report: at least sometimes | 31% | US parents of teens age 13–17 September 26–October 23, 2023 · United States · Exact valid item/subgroup n unavailable | Original source [S02] Distracted parenting section; TPSPDIST and PSPDIST all-respondent cuts |
| Teen report: often | 8% | US teens age 13–17 September 26–October 23, 2023 · United States · Exact valid item/subgroup n unavailable | Original source [S02] Distracted parenting section; TPSPDIST and PSPDIST all-respondent cuts |
| Parent self-report: often | 4% | US parents of teens age 13–17 September 26–October 23, 2023 · United States · Exact valid item/subgroup n unavailable | Original source [S02] Distracted parenting section; TPSPDIST and PSPDIST all-respondent cuts |
F07 At least sometimes argue about teen phone time, by reported online frequency. Cross-sectional association, not effect of being online. Valid online-frequency subgroup bases unknown.
| Measure / group | Published result | Eligible audience, period and base | Source |
|---|---|---|---|
| Online almost constantly | 47% | All teens age 13–17 and all parents of teens age 13–17 in the report’s published overall figures; specified teen online-frequency groups September 26–October 23, 2023 · United States · Exact valid item/subgroup n unavailable | Original source [S02] Teens’ views, by frequency of internet use paragraph |
| Online less often | 30% | All teens age 13–17 and all parents of teens age 13–17 in the report’s published overall figures; specified teen online-frequency groups September 26–October 23, 2023 · United States · Exact valid item/subgroup n unavailable | Original source [S02] Teens’ views, by frequency of internet use paragraph |
The phone findings use the report’s published all-respondent figures. The toplines also provide smartphone-user-only cuts, with different routed bases and sometimes different percentages. For example, the report’s parent argument NET is 38%; adding rounded all-parent “often” and “sometimes” values gives 39%, while a user-only cut has another denominator. We preserve the published 38% and do not silently substitute a different population. Pew Research Center [S02].
Nested categories are not totals. “Often” is included in “at least sometimes.” “Never” is not the complement of that combined frequency, because rarely, nonuser and missing-response categories can also exist. Identical 38% parent and teen argument rates do not establish agreement within every pair.
Phone distraction reports describe perceptions and self-reports, not observed attention or proof that phones caused relationship harm. For online disclosure and safety-conversation measures, see our teen online safety statistics.
What do teens want from parents when they are upset?
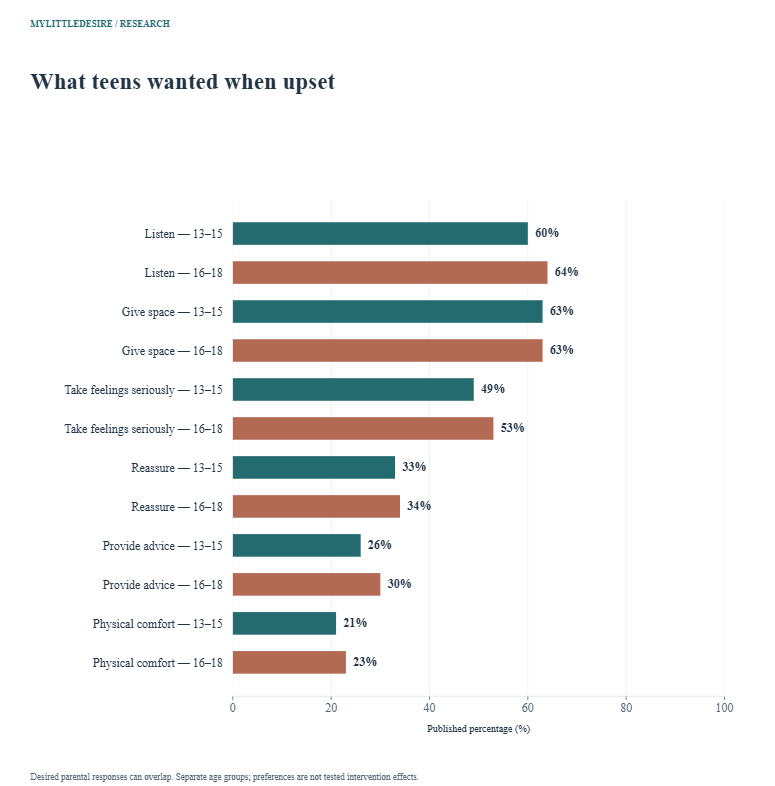
F08 Three published overall responses, ages 10–18. Gallup 2024 youth preference when upset. Overall sample ages 10–18 includes preteens. Actions may overlap; no exclusive distribution or tested intervention effect.
| Measure / group | Published result | Eligible audience, period and base | Source |
|---|---|---|---|
| Listen | 62% | Youth age 10–18 and one parent/guardian; age 10–12 preteens explicitly distinguished from teens 13–15 and 16–18 March 13–20, 2024 · United States · Exact valid item/subgroup n unavailable | Original source [S03] When kids are upset section, overall paragraph |
| Give space | 56% | Youth age 10–18 and one parent/guardian; age 10–12 preteens explicitly distinguished from teens 13–15 and 16–18 March 13–20, 2024 · United States · Exact valid item/subgroup n unavailable | Original source [S03] When kids are upset section, overall paragraph |
| Provide advice | 28% | Youth age 10–18 and one parent/guardian; age 10–12 preteens explicitly distinguished from teens 13–15 and 16–18 March 13–20, 2024 · United States · Exact valid item/subgroup n unavailable | Original source [S03] When kids are upset section, overall paragraph |
F09 Six actions in the original desired-response age table. Gallup 2024 youth preference when upset. Overall sample ages 10–18 includes preteens. Actions may overlap; no exclusive distribution or tested intervention effect. These are separate age groups, not the same youth followed over time.
| Measure / group | Published result | Eligible audience, period and base | Source |
|---|---|---|---|
| Listen | 61% | US youth age 10–12 March 13–20, 2024 · United States · Exact valid item/subgroup n unavailable | Original source [S03] Original desired-parent-response table, 10–12 age column |
| Give space | 43% | US youth age 10–12 March 13–20, 2024 · United States · Exact valid item/subgroup n unavailable | Original source [S03] Original desired-parent-response table, 10–12 age column |
| Take feelings seriously | 54% | US youth age 10–12 March 13–20, 2024 · United States · Exact valid item/subgroup n unavailable | Original source [S03] Original desired-parent-response table, 10–12 age column |
| Reassure | 41% | US youth age 10–12 March 13–20, 2024 · United States · Exact valid item/subgroup n unavailable | Original source [S03] Original desired-parent-response table, 10–12 age column |
| Provide advice | 27% | US youth age 10–12 March 13–20, 2024 · United States · Exact valid item/subgroup n unavailable | Original source [S03] Original desired-parent-response table, 10–12 age column |
| Provide physical comfort | 41% | US youth age 10–12 March 13–20, 2024 · United States · Exact valid item/subgroup n unavailable | Original source [S03] Original desired-parent-response table, 10–12 age column |
F10 Six actions in the original desired-response age table. Gallup 2024 youth preference when upset. Overall sample ages 10–18 includes preteens. Actions may overlap; no exclusive distribution or tested intervention effect. These are separate age groups, not the same youth followed over time.
| Measure / group | Published result | Eligible audience, period and base | Source |
|---|---|---|---|
| Listen | 60% | US youth age 13–15 March 13–20, 2024 · United States · Exact valid item/subgroup n unavailable | Original source [S03] Original desired-parent-response table, 13–15 age column |
| Give space | 63% | US youth age 13–15 March 13–20, 2024 · United States · Exact valid item/subgroup n unavailable | Original source [S03] Original desired-parent-response table, 13–15 age column |
| Take feelings seriously | 49% | US youth age 13–15 March 13–20, 2024 · United States · Exact valid item/subgroup n unavailable | Original source [S03] Original desired-parent-response table, 13–15 age column |
| Reassure | 33% | US youth age 13–15 March 13–20, 2024 · United States · Exact valid item/subgroup n unavailable | Original source [S03] Original desired-parent-response table, 13–15 age column |
| Provide advice | 26% | US youth age 13–15 March 13–20, 2024 · United States · Exact valid item/subgroup n unavailable | Original source [S03] Original desired-parent-response table, 13–15 age column |
| Provide physical comfort | 21% | US youth age 13–15 March 13–20, 2024 · United States · Exact valid item/subgroup n unavailable | Original source [S03] Original desired-parent-response table, 13–15 age column |
F11 Six actions in the original desired-response age table. Gallup 2024 youth preference when upset. Overall sample ages 10–18 includes preteens. Actions may overlap; no exclusive distribution or tested intervention effect. These are separate age groups, not the same youth followed over time.
| Measure / group | Published result | Eligible audience, period and base | Source |
|---|---|---|---|
| Listen | 64% | US youth age 16–18 March 13–20, 2024 · United States · Exact valid item/subgroup n unavailable | Original source [S03] Original desired-parent-response table, 16–18 age column |
| Give space | 63% | US youth age 16–18 March 13–20, 2024 · United States · Exact valid item/subgroup n unavailable | Original source [S03] Original desired-parent-response table, 16–18 age column |
| Take feelings seriously | 53% | US youth age 16–18 March 13–20, 2024 · United States · Exact valid item/subgroup n unavailable | Original source [S03] Original desired-parent-response table, 16–18 age column |
| Reassure | 34% | US youth age 16–18 March 13–20, 2024 · United States · Exact valid item/subgroup n unavailable | Original source [S03] Original desired-parent-response table, 16–18 age column |
| Provide advice | 30% | US youth age 16–18 March 13–20, 2024 · United States · Exact valid item/subgroup n unavailable | Original source [S03] Original desired-parent-response table, 16–18 age column |
| Provide physical comfort | 23% | US youth age 16–18 March 13–20, 2024 · United States · Exact valid item/subgroup n unavailable | Original source [S03] Original desired-parent-response table, 16–18 age column |
Gallup’s overall listening, space and advice figures include ages 10–18. Its original age table lets readers distinguish preteens from two teen age groups. The response categories can overlap, and the selected article does not establish an exact selection limit. We do not add them into a distribution or recreate an overall result from age percentages without the needed weights. Gallup / Walton Family Foundation [S03].
Wanting space when upset does not by itself mean rejection or poor closeness. Likewise, preferring listening does not mean advice is never wanted. These are reported preferences in a stated situation, not tested effects on wellbeing or instructions that apply to every young person.
How often do parents report communication difficulties?
F12 Published struggle-to-communicate column, overall and three child-age rows. Parent/guardian report of struggling to communicate effectively with selected child. Sample ages 10–18, not teen-only overall. Descriptive groups, not clinical diagnoses or causal age/gender effects; subgroup n unavailable.
| Measure / group | Published result | Eligible audience, period and base | Source |
|---|---|---|---|
| All parents/guardians | 15% | Youth age 10–18 and one parent/guardian; age 10–12 preteens explicitly distinguished from teens 13–15 and 16–18 March 13–20, 2024 · United States · Exact valid item/subgroup n unavailable | Original source [S03] Original parent-difficulty table, Overall and Child Age rows, third numeric column |
| Child age 10–12 | 13% | Youth age 10–18 and one parent/guardian; age 10–12 preteens explicitly distinguished from teens 13–15 and 16–18 March 13–20, 2024 · United States · Exact valid item/subgroup n unavailable | Original source [S03] Original parent-difficulty table, Overall and Child Age rows, third numeric column |
| Child age 13–15 | 19% | Youth age 10–18 and one parent/guardian; age 10–12 preteens explicitly distinguished from teens 13–15 and 16–18 March 13–20, 2024 · United States · Exact valid item/subgroup n unavailable | Original source [S03] Original parent-difficulty table, Overall and Child Age rows, third numeric column |
| Child age 16–18 | 12% | Youth age 10–18 and one parent/guardian; age 10–12 preteens explicitly distinguished from teens 13–15 and 16–18 March 13–20, 2024 · United States · Exact valid item/subgroup n unavailable | Original source [S03] Original parent-difficulty table, Overall and Child Age rows, third numeric column |
F13 Same communication-difficulty column, parent-age groups. Parent/guardian report of struggling to communicate effectively with selected child. Sample ages 10–18, not teen-only overall. Descriptive groups, not clinical diagnoses or causal age/gender effects; subgroup n unavailable.
| Measure / group | Published result | Eligible audience, period and base | Source |
|---|---|---|---|
| Parent age 34 or younger | 22% | Youth age 10–18 and one parent/guardian; age 10–12 preteens explicitly distinguished from teens 13–15 and 16–18 March 13–20, 2024 · United States · Exact valid item/subgroup n unavailable | Original source [S03] Original parent-difficulty table, Parent Age rows, third numeric column |
| Parent age 35–44 | 16% | Youth age 10–18 and one parent/guardian; age 10–12 preteens explicitly distinguished from teens 13–15 and 16–18 March 13–20, 2024 · United States · Exact valid item/subgroup n unavailable | Original source [S03] Original parent-difficulty table, Parent Age rows, third numeric column |
| Parent age 45–54 | 14% | Youth age 10–18 and one parent/guardian; age 10–12 preteens explicitly distinguished from teens 13–15 and 16–18 March 13–20, 2024 · United States · Exact valid item/subgroup n unavailable | Original source [S03] Original parent-difficulty table, Parent Age rows, third numeric column |
| Parent age 55+ | 12% | Youth age 10–18 and one parent/guardian; age 10–12 preteens explicitly distinguished from teens 13–15 and 16–18 March 13–20, 2024 · United States · Exact valid item/subgroup n unavailable | Original source [S03] Original parent-difficulty table, Parent Age rows, third numeric column |
F14 Same communication-difficulty column, source’s parent–child gender labels. Parent/guardian report of struggling to communicate effectively with selected child. Sample ages 10–18, not teen-only overall. Descriptive groups, not clinical diagnoses or causal age/gender effects; subgroup n unavailable. These pairs label respondent relationships, not differences between two matched reports.
| Measure / group | Published result | Eligible audience, period and base | Source |
|---|---|---|---|
| Mother–daughter | 19% | Youth age 10–18 and one parent/guardian; age 10–12 preteens explicitly distinguished from teens 13–15 and 16–18 March 13–20, 2024 · United States · Exact valid item/subgroup n unavailable | Original source [S03] Original parent-difficulty table, Parent–Child Gender rows, third numeric column |
| Father–daughter | 13% | Youth age 10–18 and one parent/guardian; age 10–12 preteens explicitly distinguished from teens 13–15 and 16–18 March 13–20, 2024 · United States · Exact valid item/subgroup n unavailable | Original source [S03] Original parent-difficulty table, Parent–Child Gender rows, third numeric column |
| Mother–son | 13% | Youth age 10–18 and one parent/guardian; age 10–12 preteens explicitly distinguished from teens 13–15 and 16–18 March 13–20, 2024 · United States · Exact valid item/subgroup n unavailable | Original source [S03] Original parent-difficulty table, Parent–Child Gender rows, third numeric column |
| Father–son | 15% | Youth age 10–18 and one parent/guardian; age 10–12 preteens explicitly distinguished from teens 13–15 and 16–18 March 13–20, 2024 · United States · Exact valid item/subgroup n unavailable | Original source [S03] Original parent-difficulty table, Parent–Child Gender rows, third numeric column |
The difficulty question concerns the parent’s experience of communicating effectively with the selected child. The age and gender pair labels identify respondent groups; they do not compare two matched parent and youth ratings. Cross-sectional differences cannot show that a child’s age, a parent’s age or a gender pairing caused communication to be harder. Full-study sample size is not the valid base of every subgroup.
How easy do Canadian students find talking to their parents?

F15 Easy or very easy to talk to mother, by grade band and gender. Source 2022 cycle collected 2022–2023. Grade bands not exact ages; younger band includes preteens. Relevant-parent denominator, not all students. Original 95% CI for each percentage retained; no new difference CI or causal gender effect.
| Measure / group | Published result | Eligible audience, period and base | Source |
|---|---|---|---|
| Cisgender boys — grades 6–8 | 81% Published 95% CI: 79.1%–82.4% | Cisgender boys in grades 6–8 with a mother in the participating Canadian HBSC sample 2022 HBSC cycle; collected in 2022–2023 during school years 2021–22 and 2022–23 · Canada participating jurisdictions; New Brunswick and Nunavut did not participate · Exact valid item/subgroup n unavailable | Original source [S04] Figure 3.4 accessible data table, both grade rows |
| Cisgender girls — grades 6–8 | 70% Published 95% CI: 67.7%–72.1% | Cisgender girls in grades 6–8 with a mother in the participating Canadian HBSC sample 2022 HBSC cycle; collected in 2022–2023 during school years 2021–22 and 2022–23 · Canada participating jurisdictions; New Brunswick and Nunavut did not participate · Exact valid item/subgroup n unavailable | Original source [S04] Figure 3.4 accessible data table, both grade rows |
| Transgender/gender-diverse youth — grades 6–8 | 49% Published 95% CI: 43.2%–54.8% | Transgender/gender-diverse youth in grades 6–8 with a mother in the participating Canadian HBSC sample 2022 HBSC cycle; collected in 2022–2023 during school years 2021–22 and 2022–23 · Canada participating jurisdictions; New Brunswick and Nunavut did not participate · Exact valid item/subgroup n unavailable | Original source [S04] Figure 3.4 accessible data table, both grade rows |
| Cisgender boys — grades 9–10 | 72% Published 95% CI: 69.7%–73.5% | Cisgender boys in grades 9–10 with a mother in the participating Canadian HBSC sample 2022 HBSC cycle; collected in 2022–2023 during school years 2021–22 and 2022–23 · Canada participating jurisdictions; New Brunswick and Nunavut did not participate · Exact valid item/subgroup n unavailable | Original source [S04] Figure 3.4 accessible data table, both grade rows |
| Cisgender girls — grades 9–10 | 63% Published 95% CI: 60.7%–65.5% | Cisgender girls in grades 9–10 with a mother in the participating Canadian HBSC sample 2022 HBSC cycle; collected in 2022–2023 during school years 2021–22 and 2022–23 · Canada participating jurisdictions; New Brunswick and Nunavut did not participate · Exact valid item/subgroup n unavailable | Original source [S04] Figure 3.4 accessible data table, both grade rows |
| Transgender/gender-diverse youth — grades 9–10 | 35% Published 95% CI: 27.3%–41.9% | Transgender/gender-diverse youth in grades 9–10 with a mother in the participating Canadian HBSC sample 2022 HBSC cycle; collected in 2022–2023 during school years 2021–22 and 2022–23 · Canada participating jurisdictions; New Brunswick and Nunavut did not participate · Exact valid item/subgroup n unavailable | Original source [S04] Figure 3.4 accessible data table, both grade rows |
F16 Easy or very easy to talk to father, by grade band and gender. Source 2022 cycle collected 2022–2023. Grade bands not exact ages; younger band includes preteens. Relevant-parent denominator, not all students. Original 95% CI for each percentage retained; no new difference CI or causal gender effect.
| Measure / group | Published result | Eligible audience, period and base | Source |
|---|---|---|---|
| Cisgender boys — grades 6–8 | 70% Published 95% CI: 67.9%–72.1% | Cisgender boys in grades 6–8 with a father in the participating Canadian HBSC sample 2022 HBSC cycle; collected in 2022–2023 during school years 2021–22 and 2022–23 · Canada participating jurisdictions; New Brunswick and Nunavut did not participate · Exact valid item/subgroup n unavailable | Original source [S04] Figure 3.5 accessible data table, both grade rows |
| Cisgender girls — grades 6–8 | 53% Published 95% CI: 50.6%–55.3% | Cisgender girls in grades 6–8 with a father in the participating Canadian HBSC sample 2022 HBSC cycle; collected in 2022–2023 during school years 2021–22 and 2022–23 · Canada participating jurisdictions; New Brunswick and Nunavut did not participate · Exact valid item/subgroup n unavailable | Original source [S04] Figure 3.5 accessible data table, both grade rows |
| Transgender/gender-diverse youth — grades 6–8 | 34% Published 95% CI: 28.1%–39.0% | Transgender/gender-diverse youth in grades 6–8 with a father in the participating Canadian HBSC sample 2022 HBSC cycle; collected in 2022–2023 during school years 2021–22 and 2022–23 · Canada participating jurisdictions; New Brunswick and Nunavut did not participate · Exact valid item/subgroup n unavailable | Original source [S04] Figure 3.5 accessible data table, both grade rows |
| Cisgender boys — grades 9–10 | 60% Published 95% CI: 57.2%–61.7% | Cisgender boys in grades 9–10 with a father in the participating Canadian HBSC sample 2022 HBSC cycle; collected in 2022–2023 during school years 2021–22 and 2022–23 · Canada participating jurisdictions; New Brunswick and Nunavut did not participate · Exact valid item/subgroup n unavailable | Original source [S04] Figure 3.5 accessible data table, both grade rows |
| Cisgender girls — grades 9–10 | 42% Published 95% CI: 39.1%–43.9% | Cisgender girls in grades 9–10 with a father in the participating Canadian HBSC sample 2022 HBSC cycle; collected in 2022–2023 during school years 2021–22 and 2022–23 · Canada participating jurisdictions; New Brunswick and Nunavut did not participate · Exact valid item/subgroup n unavailable | Original source [S04] Figure 3.5 accessible data table, both grade rows |
| Transgender/gender-diverse youth — grades 9–10 | 23% Published 95% CI: 17.9%–28.8% | Transgender/gender-diverse youth in grades 9–10 with a father in the participating Canadian HBSC sample 2022 HBSC cycle; collected in 2022–2023 during school years 2021–22 and 2022–23 · Canada participating jurisdictions; New Brunswick and Nunavut did not participate · Exact valid item/subgroup n unavailable | Original source [S04] Figure 3.5 accessible data table, both grade rows |
The Canadian report labels these data the 2022 HBSC cycle, but fieldwork took place in 2022–2023 across the 2021–22 and 2022–23 school years. Nine provinces and two territories participated; New Brunswick and Nunavut did not. School-grade bands are not exact ages, and grades 6–8 can include preteens. Public Health Agency of Canada / Canadian HBSC study [S04].
Mother figures are among students with a mother and father figures among those with a father, so valid denominators differ. The report separates cisgender boys, cisgender girls and transgender/gender-diverse youth using its stated classifications. We retain all twelve published 95% confidence intervals, which account for classroom clustering. Wider intervals remain visible; no interval or new significance test is calculated for a difference.
The source’s provincial/territorial sample table lists 26,360 students in 317 schools. Its grade/gender classification table has 25,943 because some students did not supply those classifications. Neither total is substituted for a valid parent-specific item or subgroup base. Grade-group differences are cross-sectional, rather than the same students followed through school.
How can readers use this evidence?
For a story about willingness to talk, use the comfort question and identify whose comfort was measured. For a story about interruption, use the phone-conversation item. For a story about what teens want in an upsetting moment, specify the age band and desired response. For Canadian ease-of-talking figures, keep the grade band, gender group, relevant-parent eligibility and fieldwork span.
For a family discussion, these findings can prompt a specific question about whether a young person wants listening, advice, reassurance or space at that moment. This is a discussion prompt, not a tested intervention or a recommended conversation schedule. Communication in adulthood has different contexts; see our parent–adult child relationship statistics.
Ten reproducible descriptive comparisons
The workbook subtracts compatible published percentages using stable observation IDs. Results are percentage-point differences, with no new significance test or confidence interval. A numeric zero is a valid result: equal overall argument rates still do not establish agreement within pairs.
| ID | Comparison | First | Second | Difference | Qualification |
|---|---|---|---|---|---|
| C01 | Mental-health comfort: parents minus teens | 80% | 52% | +28 percentage points | Different respondent perspectives about own comfort; aggregate difference, not percent of pairs disagreeing. Rounded inputs; no new significance test. |
| C02 | Parents’ own comfort: mothers minus fathers | 84% | 75% | +9 percentage points | Parent gender groups, not teens rating their mother and father. Rounded inputs; no new significance test. |
| C03 | Phone distraction: teen report minus parent self-report | 46% | 31% | +15 percentage points | All-respondent published NETs; not matched-pair disagreement or observed distraction. Rounded inputs; no new significance test. |
| C04 | Phone arguments: teen minus parent aggregate | 38% | 38% | +0 percentage points | Equal overall rates do not establish agreement within every pair. Rounded inputs; no new significance test. |
| C05 | Want listening: age 16–18 minus age 10–12 | 64% | 61% | +3 percentage points | Cross-sectional youth age groups, not maturation in the same children. Rounded inputs; no new significance test. |
| C06 | Want space: age 13–15 minus age 10–12 | 63% | 43% | +20 percentage points | Preference when upset, not rejection or treatment effect. Rounded inputs; no new significance test. |
| C07 | Want physical comfort: age 10–12 minus age 13–15 | 41% | 21% | +20 percentage points | Separate age groups; preference, not what every child wants. Rounded inputs; no new significance test. |
| C08 | Parent communication struggle: child 13–15 minus 16–18 | 19% | 12% | +7 percentage points | Parent-reported difficulty by child age, not youth-reported difficulty or causal age effect. Rounded inputs; no new significance test. |
| C09 | Canada mother ease: older-grade boys minus girls | 72% | 63% | +9 percentage points | Cisgender grade 9–10 groups with mother; no causal effect or difference interval. Rounded inputs; no new significance test. |
| C10 | Canada father ease: older-grade boys minus girls | 60% | 42% | +18 percentage points | Cisgender grade 9–10 groups with father; no causal effect or difference interval. Rounded inputs; no new significance test. |
Common questions
What percentage of teens feel comfortable talking to a parent?
Pew’s 2024 US survey found 52% of teens ages 13–17 would be extremely or very comfortable discussing their mental health with a parent. This is a specific hypothetical-comfort question, not a universal rating of every family conversation.
Do parents and teens see these conversations the same way?
Parents and teens report different aggregate comfort and distraction figures. Those differences do not identify the percentage of individual pairs who disagree, and each respondent’s perspective must remain explicit.
How often do families argue about phone use?
In Pew’s 2023 survey, 38% of teens and 38% of parents reported arguing about teen phone time at least sometimes. These are all-respondent combined figures, and equal aggregates do not prove pairwise agreement.
Do teens want listening or advice when upset?
Gallup’s March 2024 age table found 60% of 13–15-year-olds and 64% of 16–18-year-olds wanted listening, while 26% and 30% wanted advice. Responses can overlap; preferences are not tested treatment effects.
Are the Gallup overall figures teen-only?
No. The overall sample includes ages 10–18. Preteens age 10–12 are identified separately in the tables.
Are Canadian school grades exact age groups?
No. Grade bands are not interchangeable with ages 13–17. The selected cycle was collected in 2022–2023, and two jurisdictions did not participate.
Do confidence intervals establish the cause of group differences?
No. They describe uncertainty around published estimates. The selected data do not establish causal gender, age or communication effects, and no new difference interval is calculated here.
Do these sources establish an ideal amount of daily conversation?
No. These selected descriptive surveys do not test an ideal daily duration or conversation schedule.
Research method and limitations
Selection and concentration. We selected original survey reports and tables that directly address conversations, perceived communication difficulty, phone-related conversational experiences or desired parental responses. The database contains 67 observations in 16 groups from four source records and three publisher labels: Pew 2024 mental-health survey 10; Pew 2023 screen-time survey 12; Gallup 2024 survey 33; Canadian HBSC 12. Gallup contributes 33 and Pew 22 across two surveys. Related categories and subgroup cells are not independent studies; four charts and ten comparisons reuse inputs. MyLittleDesire conducted no new survey.
Verification. Original Pew reports, toplines and methods were checked. The 2025 report’s comfort page and 2024 report’s distraction page were rendered and visually inspected. Gallup’s original article, methods and original publisher HTML data tables were checked. Canadian methods, sample tables and accessible data tables for Figures 3.4/3.5 were checked. Published aggregates were verified; confidential respondent records were not audited.
Bases and uncertainty. All 67 selected valid item/subgroup bases and weighted bases remain blank because the exact selected bases were not established. Full pair samples and Canadian student totals are separately labelled. Smartphone-only route counts are not assigned to all-respondent report estimates. All twelve Canadian percentages retain their published 95% confidence intervals. No raw counts are reconstructed, full-sample margin assigned to a subgroup, or new interval/significance test derived.
Measurement. Hypothetical comfort, actual reported arguments, perceived distraction, desired responses, parental difficulty and ease talking to a relevant parent remain distinct. Parent and youth populations are weighted separately in Pew’s paired surveys; aggregate gaps do not estimate paired disagreement. Often is nested in at-least-sometimes. Original combined NETs are retained where rounded components do not reproduce them. Gallup preferences may overlap. Canadian parent-availability denominators differ.
Scope. Ages 13–17, ages 10–18 and school-grade groups are not interchangeable. Actual fieldwork spans are shown, including Canadian 2022–2023 collection and nonparticipating jurisdictions. Cross-sectional age/grade/group differences are not individual change or causal effects. No pooled global rate, country ranking, clinical benefit, ideal schedule or future outcome is inferred.
Maintenance. Recheck original wording, respondent direction, age/grade group, routing, sample design, denominator and dates before replacing values. Change the review date after substantive source review and retain the evergreen article URL.
Original sources and supporting records
- Pew Research Center. Teens, Social Media and Mental Health — comfort discussing mental health [S01]
Published: April 22, 2025. Actual period: September 18–October 10, 2024.
Population: Teens age 13–17 living with parents and parents of teens age 13–17, with respondent perspective specified per row.
Full study sample: 1,391. 1,391 parent–teen survey pairs; teen and parent populations weighted separately. Full study size not assigned as every valid item/subgroup n..
Item bases: Selected item-complete and gender-subgroup n not supplied beside published NETs; unknown bases left blank.
Method: Ipsos probability-based KnowledgePanel. One teen selected where multiple eligible teens; parent passes survey to teen to complete privately. Original article, report, topline PTTALKMH/TTALKMH and methods checked; comfort page rendered and visually inspected.
Limits: Hypothetical comfort, not actual disclosure, conversation frequency, treatment or clinical outcome. Parent asked about own comfort talking with teen; teen about own comfort talking with a parent. Aggregate differences are not percent of pairs disagreeing or proof of parental overestimation. Mother/father values describe parents’ own comfort, not teens’ ease talking to mother versus father. Published therapist NET 31 retained rather than adding rounded 10+20=30.
Supporting record 1 · Supporting record 2 · Supporting record 3 - Pew Research Center. How Teens and Parents Approach Screen Time — arguments and distracted conversations [S02]
Published: March 11, 2024. Actual period: September 26–October 23, 2023.
Population: All teens age 13–17 and all parents of teens age 13–17 in the report’s published overall figures; specified teen online-frequency groups.
Full study sample: 1,453. 1,453 parent–teen pairs; separately weighted respondent populations. All-respondent figures distinguished from smartphone-user-only topline cuts..
Item bases: Smartphone-only routing n=1,389 teens, n=1,384 parents of teen smartphone users, n=1,412 parent smartphone users are not assigned to selected all-respondent report figures. Exact selected valid n unavailable.
Method: Probability-based Ipsos KnowledgePanel online paired parent/teen study. Original article, report, separate parent/teen toplines and methods checked. Report’s distracted-parenting page rendered and checked; all-respondent versus routed smartphone-user bases traced in toplines.
Limits: At-least-sometimes NET includes often. Never is not complement of NET because rarely and nonuser/no-answer categories also exist. Published parent argument NET 38 retained despite rounded all-parent 10+29=39; user-only parent NET is a different base. Equal 38% aggregates do not mean all pairs agree. Phone distraction is self-report/perception, not observed attention or proof of causal relationship damage. Online-frequency association is not causal.
Supporting record 1 · Supporting record 2 · Supporting record 3 · Supporting record 4 - Gallup / Walton Family Foundation. Gen Zers to Their Parents: When We Are Upset, Just Listen [S03]
Published: July 29, 2024. Actual period: March 13–20, 2024.
Population: Youth age 10–18 and one parent/guardian; age 10–12 preteens explicitly distinguished from teens 13–15 and 16–18.
Full study sample: 1,675. 1,675 parent/guardian–youth pairs, not 1,675 in every age or gender group. Parent and youth sections answered sequentially..
Item bases: Valid question/subgroup and weighted bases unavailable in selected article tables; full 1,675 pairs not assigned to individual rows.
Method: Probability-based Gallup Panel web survey. Parents 18+ with a 10–18-year-old at home; next-birthday child selected if multiple eligible children. Original article methods, overall text and two original publisher HTML noscript data tables checked: communication difficulty and desired parental responses by age.
Limits: Overall results include preteens; not all Gen Z or all teens only. Desired responses may overlap and are not an exclusive distribution; exact selection limit not established from selected article. Wanting space is not rejection or lack of closeness; preferences are not tested interventions. Parent difficulty table reports struggle with effective communication, not a clinical diagnosis. Parent–child gender pairs are respondent classifications, not matched disagreements or causal gender effects. - Public Health Agency of Canada / Canadian HBSC study. The health of young people in Canada: Focus on mental health — communication with mother and father [S04]
Published: June 23, 2025. Actual period: 2022 HBSC cycle; collected in 2022–2023 during school years 2021–22 and 2022–23.
Population: Participating school students in grades 6–10, grouped grades 6–8 or 9–10, with the relevant parent; cisgender boys, cisgender girls and transgender/gender-diverse (TGD) groups.
Full study sample: 26,360. 26,360 students in 317 schools in provincial/territorial table; grade/gender classification table has 25,943 due to missing grade/gender. Neither is selected valid parent-item n..
Item bases: Mother ease estimates among students with a mother; father estimates among those with a father. Exact valid grade/gender/parent-item n unavailable. Twelve original 95% CIs retained; all unweighted and weighted item bases blank.
Method: Classroom-based HBSC survey across nine provinces/two territories; web or paper self-report. Weighted for grade and provincial/territorial enrolment, with 95% CIs accounting for classroom clustering. Original methods, sample tables and Figures 3.4/3.5 accessible data tables checked. Gender groups follow source’s definitions.
Limits: Grade bands are not exact ages or a teen-only 13–17 sample. Younger grades can include preteens. Repeated cross-sectional grade differences are not change in the same students. Parental availability creates different mother/father denominators. Ease of talking is not actual disclosure, frequency or causal mental-health protection. CI bounds belong to each estimate, not calculated differences. No country ranking, new interval or significance test.
How to cite this resource
MyLittleDesire. Parent Teen Communication Statistics. https://mylittledesire.com/parent-teen-communication-statistics/.