
Research following couples through first parenthood often finds an average decline in relationship satisfaction, while individual experiences vary. A 2022 meta-analysis reports first-year standardized changes of g=−0.31 for women and −0.29 for men. A German panel analysis published in 2026 also finds lower satisfaction after first birth in adjusted models. Those numbers use specific scales and study designs; they are not percentages of couples who become unhappy. Bogdan, Turliuc & Candel [S04]; Matthias Pollmann-Schult [S03].
This resource collects 52 published numerical observations in 16 groups, four charts and ten reproducible comparisons. Five numerical publications comprise four cohort/panel papers and one meta-analysis, published by four publisher labels. The tables distinguish observed means, adjusted means, study-defined dissatisfaction percentages, regression coefficients and standardized effects. Repeated waves and summaries are not independent studies.
−0.31 / −0.29
15.7%
First-year standardized satisfaction changes for women / men.Hedges g, 2022 meta-analysis; negative indicates average decline. Bogdan, Turliuc & Candel [S04]
Met the PFB-K ≤13 dissatisfaction threshold at fourteen months.Selected DREAM fathers; exact cutoff question base unreported. Mack, Brunke, Staudt, Kopp, Weise & Garthus-Niegel [S02]
41.23 → 38.20
−0.418 / −0.271
Observed QMI mean for parent wives from late pregnancy to twelve months after birth.Historical US cohort; QMI range 6–45, valid cell n unknown. Lawrence, Cobb, Rothman, Rothman & Bradbury [S01]
Women’s / men’s adjusted coefficients when the first child was aged 0–2.2026 pairfam analysis; points on a 0–10 item, reference no child. Matthias Pollmann-Schult [S03]
What do parenthood and relationship satisfaction statistics measure?
Relationship satisfaction concerns a person’s evaluation of the couple relationship. It is distinct from enjoyment of parenting, overall life satisfaction, stress, depression and whether a relationship ends. A lower group mean can coexist with substantial variation between couples. A study may also find a change among people without children over a comparable interval.
| Estimate | Meaning here | What must stay attached |
|---|---|---|
| Observed mean | Average published score among the respondents observed at a visit | Scale range, group, visit timing and valid score base |
| Adjusted mean | Predicted score from a fitted model with listed covariates | Model, covariates, parity group and published rounding |
| Threshold percentage | Share below a stated relationship-satisfaction score cutoff | Exact cutoff, eligible cohort and available question base |
| Fixed-effects coefficient | Within-person model estimate relative to a reference category | Outcome scale, reference, child-age band and model controls |
| Hedges g | Standardized mean change synthesized across studies | Time window, study set, row-specific N/K and heterogeneity |
| Cohen d for level change | Published standardized birth-associated model change | Original model and cohort; do not interchange with meta-analytic g |
Also Read:-
Parenting Partnership Roles Statistics 2027
Wedding Cost by State Statistics 2027
Wedding Planning Stress Statistics 2027
Micro Wedding Elopement Statistics 2027
Destination Wedding Statistics 2027
How did satisfaction change around the first birth in a US cohort?
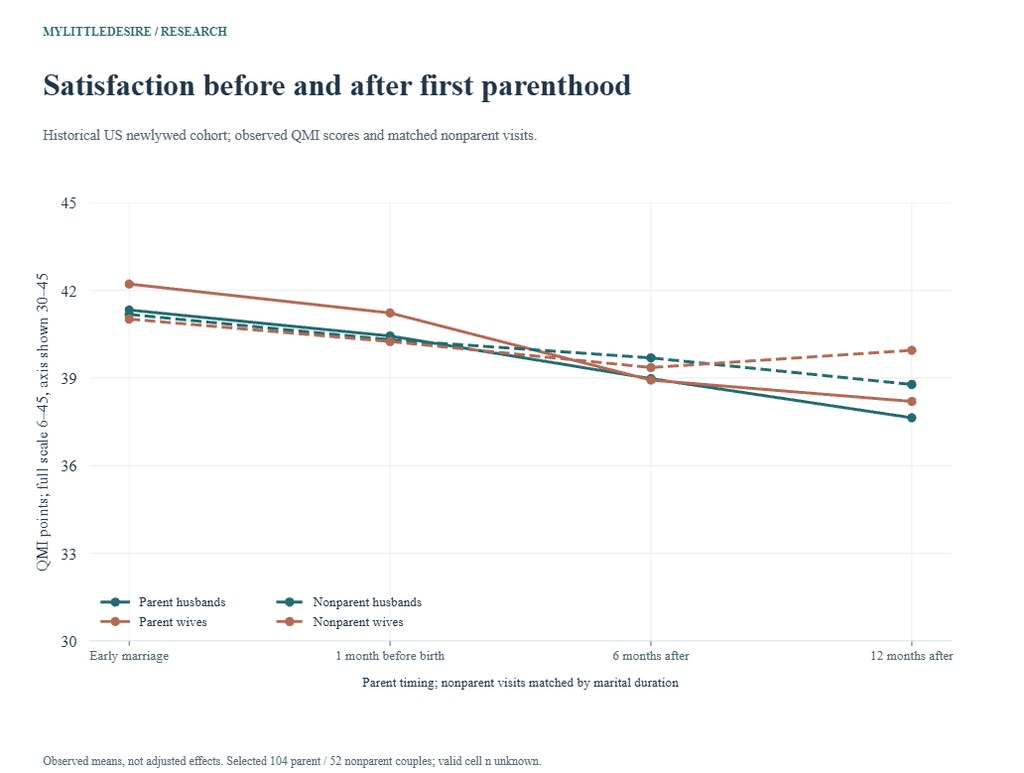
F01 Observed QMI means, range 6–45, higher means greater satisfaction. Parent T1 averages three marriage months; T2/T3/T4 align around birth. Nonparents observed at comparable marital duration. Group totals are not confirmed valid cell n. Historical selected cohort; no percentage or causal conversion.
| Measure / timing | Published estimate | Audience, actual period and analysis base | Source |
|---|---|---|---|
| T1: early marriage, before pregnancy | 41.33 QMI points | Parent husbands in selected US newlywed cohort T1: early marriage, before pregnancy; calendar field years unavailable. Exact valid item n unavailable. Reported analysis N=104 couples in analysis group; exact valid sex/wave n unavailable. | Original source [S01] Table 1 and table note |
| T2: one month before birth | 40.44 QMI points | Parent husbands in selected US newlywed cohort T2: one month before birth; calendar field years unavailable. Exact valid item n unavailable. Reported analysis N=104 couples in analysis group; exact valid sex/wave n unavailable. | Original source [S01] Table 1 and table note |
| T3: six months postpartum | 38.98 QMI points | Parent husbands in selected US newlywed cohort T3: six months postpartum; calendar field years unavailable. Exact valid item n unavailable. Reported analysis N=104 couples in analysis group; exact valid sex/wave n unavailable. | Original source [S01] Table 1 and table note |
| T4: twelve months postpartum | 37.64 QMI points | Parent husbands in selected US newlywed cohort T4: twelve months postpartum; calendar field years unavailable. Exact valid item n unavailable. Reported analysis N=104 couples in analysis group; exact valid sex/wave n unavailable. | Original source [S01] Table 1 and table note |
F02 Observed QMI means, range 6–45, higher means greater satisfaction. Parent T1 averages three marriage months; T2/T3/T4 align around birth. Nonparents observed at comparable marital duration. Group totals are not confirmed valid cell n. Historical selected cohort; no percentage or causal conversion.
| Measure / timing | Published estimate | Audience, actual period and analysis base | Source |
|---|---|---|---|
| T1: early marriage, before pregnancy | 42.22 QMI points | Parent wives in selected US newlywed cohort T1: early marriage, before pregnancy; calendar field years unavailable. Exact valid item n unavailable. Reported analysis N=104 couples in analysis group; exact valid sex/wave n unavailable. | Original source [S01] Table 1 and table note |
| T2: one month before birth | 41.23 QMI points | Parent wives in selected US newlywed cohort T2: one month before birth; calendar field years unavailable. Exact valid item n unavailable. Reported analysis N=104 couples in analysis group; exact valid sex/wave n unavailable. | Original source [S01] Table 1 and table note |
| T3: six months postpartum | 38.93 QMI points | Parent wives in selected US newlywed cohort T3: six months postpartum; calendar field years unavailable. Exact valid item n unavailable. Reported analysis N=104 couples in analysis group; exact valid sex/wave n unavailable. | Original source [S01] Table 1 and table note |
| T4: twelve months postpartum | 38.20 QMI points | Parent wives in selected US newlywed cohort T4: twelve months postpartum; calendar field years unavailable. Exact valid item n unavailable. Reported analysis N=104 couples in analysis group; exact valid sex/wave n unavailable. | Original source [S01] Table 1 and table note |
The US study starts before pregnancy, which helps address differences already present among people who later become parents. Its observed means and fitted growth analyses still answer different questions. The table means describe each visit; the paper’s models consider trajectories and selection. The publication year should not be substituted for the cohort’s calendar fieldwork dates, which were not established in this source check.
Did couples without children also experience changes?
F03 Observed QMI means, range 6–45, higher means greater satisfaction. Parent T1 averages three marriage months; T2/T3/T4 align around birth. Nonparents observed at comparable marital duration. Group totals are not confirmed valid cell n. Historical selected cohort; no percentage or causal conversion.
| Measure / timing | Published estimate | Audience, actual period and analysis base | Source |
|---|---|---|---|
| T1: matched marital-duration comparison point | 41.18 QMI points | Nonparent husbands in selected US newlywed cohort T1: matched marital-duration comparison point; calendar field years unavailable. Exact valid item n unavailable. Reported analysis N=52 couples in analysis group; exact valid sex/wave n unavailable. | Original source [S01] Table 1 and table note |
| T2: matched marital-duration comparison point | 40.31 QMI points | Nonparent husbands in selected US newlywed cohort T2: matched marital-duration comparison point; calendar field years unavailable. Exact valid item n unavailable. Reported analysis N=52 couples in analysis group; exact valid sex/wave n unavailable. | Original source [S01] Table 1 and table note |
| T3: matched marital-duration comparison point | 39.69 QMI points | Nonparent husbands in selected US newlywed cohort T3: matched marital-duration comparison point; calendar field years unavailable. Exact valid item n unavailable. Reported analysis N=52 couples in analysis group; exact valid sex/wave n unavailable. | Original source [S01] Table 1 and table note |
| T4: matched marital-duration comparison point | 38.78 QMI points | Nonparent husbands in selected US newlywed cohort T4: matched marital-duration comparison point; calendar field years unavailable. Exact valid item n unavailable. Reported analysis N=52 couples in analysis group; exact valid sex/wave n unavailable. | Original source [S01] Table 1 and table note |
F04 Observed QMI means, range 6–45, higher means greater satisfaction. Parent T1 averages three marriage months; T2/T3/T4 align around birth. Nonparents observed at comparable marital duration. Group totals are not confirmed valid cell n. Historical selected cohort; no percentage or causal conversion.
| Measure / timing | Published estimate | Audience, actual period and analysis base | Source |
|---|---|---|---|
| T1: matched marital-duration comparison point | 41.02 QMI points | Nonparent wives in selected US newlywed cohort T1: matched marital-duration comparison point; calendar field years unavailable. Exact valid item n unavailable. Reported analysis N=52 couples in analysis group; exact valid sex/wave n unavailable. | Original source [S01] Table 1 and table note |
| T2: matched marital-duration comparison point | 40.25 QMI points | Nonparent wives in selected US newlywed cohort T2: matched marital-duration comparison point; calendar field years unavailable. Exact valid item n unavailable. Reported analysis N=52 couples in analysis group; exact valid sex/wave n unavailable. | Original source [S01] Table 1 and table note |
| T3: matched marital-duration comparison point | 39.36 QMI points | Nonparent wives in selected US newlywed cohort T3: matched marital-duration comparison point; calendar field years unavailable. Exact valid item n unavailable. Reported analysis N=52 couples in analysis group; exact valid sex/wave n unavailable. | Original source [S01] Table 1 and table note |
| T4: matched marital-duration comparison point | 39.95 QMI points | Nonparent wives in selected US newlywed cohort T4: matched marital-duration comparison point; calendar field years unavailable. Exact valid item n unavailable. Reported analysis N=52 couples in analysis group; exact valid sex/wave n unavailable. | Original source [S01] Table 1 and table note |
The comparison group consisted of voluntarily childless couples observed at similar marital durations. Some of their published means also decreased. This is why a simple before-and-after decline in new parents cannot by itself identify the contribution of parenthood. These couples were selected rather than randomly assigned, so they do not represent all people who have no children.
What did the German father cohort report?
F05 PFB-K observed sum-score means, range 0–27; first- and second-time fathers combined. Table 2 sample sizes retained exactly. Source four-wave ANOVA n=353 conflicts with Table 2 final-wave n=246; no reconciliation or matched-person change inferred.
| Measure / timing | Published estimate | Audience, actual period and analysis base | Source |
|---|---|---|---|
| Pregnancy | 20.65 PFB-K points | DREAM analytic fathers, first and second child combined Pregnancy; data available January 31, 2022. Published valid score n=600. Reported analysis N=600 fathers with score, as printed in Table 2. | Original source [S02] Table 2, total-sample column |
| About eight weeks postpartum | 19.45 PFB-K points | DREAM analytic fathers, first and second child combined About eight weeks postpartum; data available January 31, 2022. Published valid score n=599. Reported analysis N=599 fathers with score, as printed in Table 2. | Original source [S02] Table 2, total-sample column |
| About fourteen months postpartum | 18.09 PFB-K points | DREAM analytic fathers, first and second child combined About fourteen months postpartum; data available January 31, 2022. Published valid score n=599. Reported analysis N=599 fathers with score, as printed in Table 2. | Original source [S02] Table 2, total-sample column |
| About two years postpartum | 17.84 PFB-K points | DREAM analytic fathers, first and second child combined About two years postpartum; data available January 31, 2022. Published valid score n=246. Reported analysis N=246 fathers with score, as printed in Table 2. | Original source [S02] Table 2, total-sample column |
F06 Percentage with PFB-K score ≤13, the study-defined unsatisfying-relationship cutoff. Selected DREAM fathers, not national prevalence or a clinical diagnosis. Exact valid cutoff bases unreported; neither full 606 nor other analysis counts assigned. Percentages at visits do not identify the same individuals changing category.
| Measure / timing | Published estimate | Audience, actual period and analysis base | Source |
|---|---|---|---|
| Pregnancy | 5.9% percent | DREAM analytic fathers, first and second child combined; exact cutoff item n unknown Pregnancy; data available January 31, 2022. Exact valid item n unavailable. | Original source [S02] Results, Relationship satisfaction paragraph |
| About eight weeks postpartum | 8.3% percent | DREAM analytic fathers, first and second child combined; exact cutoff item n unknown About eight weeks postpartum; data available January 31, 2022. Exact valid item n unavailable. | Original source [S02] Results, Relationship satisfaction paragraph |
| About fourteen months postpartum | 15.7% percent | DREAM analytic fathers, first and second child combined; exact cutoff item n unknown About fourteen months postpartum; data available January 31, 2022. Exact valid item n unavailable. | Original source [S02] Results, Relationship satisfaction paragraph |
| About two years postpartum | 9.9% percent | DREAM analytic fathers, first and second child combined; exact cutoff item n unknown About two years postpartum; data available January 31, 2022. Exact valid item n unavailable. | Original source [S02] Results, Relationship satisfaction paragraph |
DREAM uses a different instrument: the PFB-K sum score ranges from 0 to 27. The percentage result applies a score threshold of 13 or less. It should be quoted as that study’s dissatisfaction classification for its selected regional fathers. It does not estimate a clinical condition, a breakup probability or the percentage of all German couples whose relationships worsen after childbirth.
Follow-up and sample-count qualification: Table 2 gives valid score counts of 600, 599, 599 and 246 for its four means. Elsewhere, the paper reports 353 complete four-wave cases for a repeated-measures analysis. That inconsistency is unresolved here. The table’s counts stay attached to its means; the exact denominators for the four threshold percentages remain unknown. Neither set of numbers is used to reconstruct counts or individual transitions. Mack, Brunke, Staudt, Kopp, Weise & Garthus-Niegel [S02].
How did first- and second-time fathers’ modeled trajectories differ?
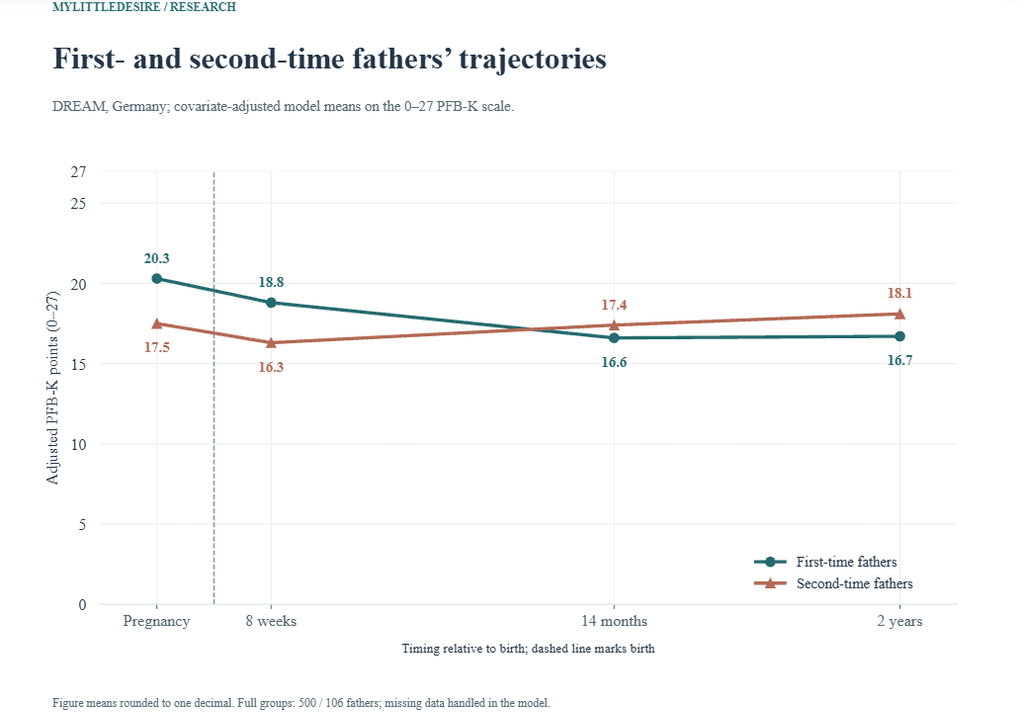
F07 Figure 3 model-implied PFB-K means, rounded to one decimal. Adjusted for age, education, income, relationship duration, marital status, child sex and child temperament. Source model handles partial missing data. Full parity-group n is not a valid per-wave base. Rounded group trajectories do not prove second birth protective.
| Measure / timing | Published estimate | Audience, actual period and analysis base | Source |
|---|---|---|---|
| Pregnancy | 20.3 PFB-K points | First-time fathers in DREAM analytic cohort Pregnancy; data available January 31, 2022. Exact valid item n unavailable. Reported analysis N=500 fathers in full parity analysis group, not exact valid wave n. | Original source [S02] Figure 3 and caption |
| About eight weeks postpartum | 18.8 PFB-K points | First-time fathers in DREAM analytic cohort About eight weeks postpartum; data available January 31, 2022. Exact valid item n unavailable. Reported analysis N=500 fathers in full parity analysis group, not exact valid wave n. | Original source [S02] Figure 3 and caption |
| About fourteen months postpartum | 16.6 PFB-K points | First-time fathers in DREAM analytic cohort About fourteen months postpartum; data available January 31, 2022. Exact valid item n unavailable. Reported analysis N=500 fathers in full parity analysis group, not exact valid wave n. | Original source [S02] Figure 3 and caption |
| About two years postpartum | 16.7 PFB-K points | First-time fathers in DREAM analytic cohort About two years postpartum; data available January 31, 2022. Exact valid item n unavailable. Reported analysis N=500 fathers in full parity analysis group, not exact valid wave n. | Original source [S02] Figure 3 and caption |
F08 Figure 3 model-implied PFB-K means, rounded to one decimal. Adjusted for age, education, income, relationship duration, marital status, child sex and child temperament. Source model handles partial missing data. Full parity-group n is not a valid per-wave base. Rounded group trajectories do not prove second birth protective.
| Measure / timing | Published estimate | Audience, actual period and analysis base | Source |
|---|---|---|---|
| Pregnancy | 17.5 PFB-K points | Second-time fathers in DREAM analytic cohort Pregnancy; data available January 31, 2022. Exact valid item n unavailable. Reported analysis N=106 fathers in full parity analysis group, not exact valid wave n. | Original source [S02] Figure 3 and caption |
| About eight weeks postpartum | 16.3 PFB-K points | Second-time fathers in DREAM analytic cohort About eight weeks postpartum; data available January 31, 2022. Exact valid item n unavailable. Reported analysis N=106 fathers in full parity analysis group, not exact valid wave n. | Original source [S02] Figure 3 and caption |
| About fourteen months postpartum | 17.4 PFB-K points | Second-time fathers in DREAM analytic cohort About fourteen months postpartum; data available January 31, 2022. Exact valid item n unavailable. Reported analysis N=106 fathers in full parity analysis group, not exact valid wave n. | Original source [S02] Figure 3 and caption |
| About two years postpartum | 18.1 PFB-K points | Second-time fathers in DREAM analytic cohort About two years postpartum; data available January 31, 2022. Exact valid item n unavailable. Reported analysis N=106 fathers in full parity analysis group, not exact valid wave n. | Original source [S02] Figure 3 and caption |
The adjusted first-time-father trajectory starts higher, declines through the fourteen-month visit and then changes little in the rounded published means. The second-time-father trajectory follows a different shape. These are model-implied values adjusted for seven variables, including child temperament, and use partly missing follow-up data. They cannot be substituted for the raw averages or interpreted as evidence that having another child improves a relationship.
What does the meta-analysis show for the first year?
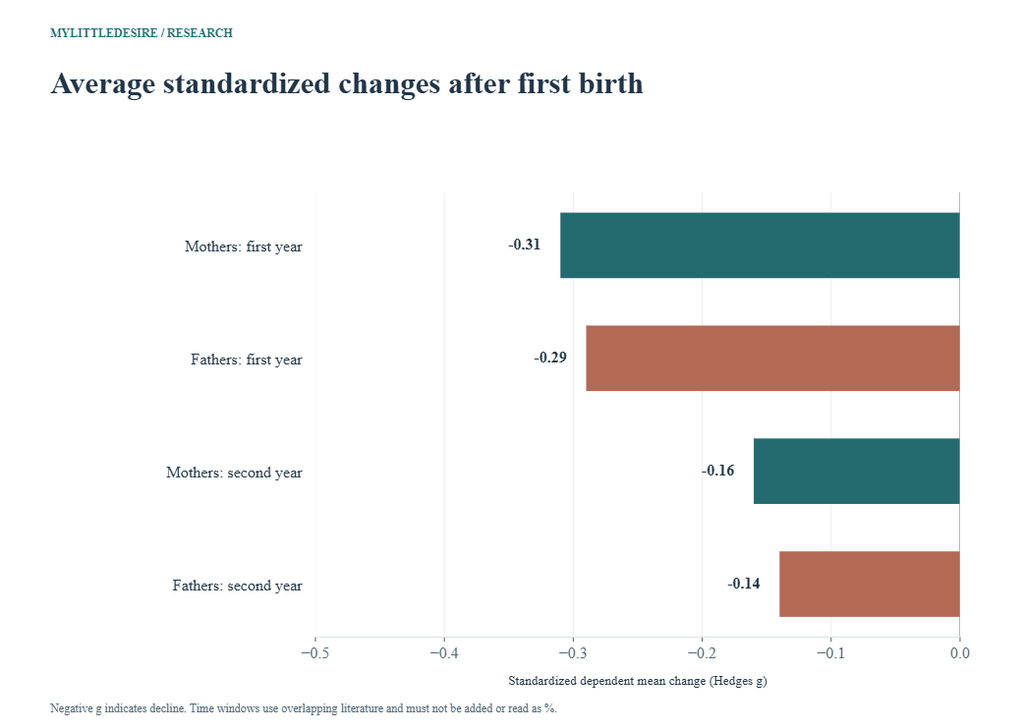
F12 Published standardized dependent mean-change effect, Hedges g; negative indicates lower satisfaction. Different time windows and sex/couple summaries can overlap and must not be added. N/K are row-specific source metadata. High heterogeneity limits a single typical-couple interpretation. No percent decline or new causal/significance claim.
| Measure / timing | Published estimate | Audience, actual period and analysis base | Source |
|---|---|---|---|
| Women: pregnancy to first year | -0.31 Hedges g | Included first-time-parent longitudinal samples and smaller nonparent comparison samples; English-language peer-reviewed studies under stated criteria Original longitudinal studies located in searches September 2019–December 2021; pregnancy through first two postpartum years. Exact valid item n unavailable. Reported analysis N=139,791 N as reported for this meta-analytic row; not a single item base. K=50 effect sizes. | Original source [S04] Table 1, corresponding time-window rows |
| Men: pregnancy to first year | -0.29 Hedges g | Included first-time-parent longitudinal samples and smaller nonparent comparison samples; English-language peer-reviewed studies under stated criteria Original longitudinal studies located in searches September 2019–December 2021; pregnancy through first two postpartum years. Exact valid item n unavailable. Reported analysis N=4,625 N as reported for this meta-analytic row; not a single item base. K=45 effect sizes. | Original source [S04] Table 1, corresponding time-window rows |
| Undifferentiated couple samples: first year | -0.28 Hedges g | Included first-time-parent longitudinal samples and smaller nonparent comparison samples; English-language peer-reviewed studies under stated criteria Original longitudinal studies located in searches September 2019–December 2021; pregnancy through first two postpartum years. Exact valid item n unavailable. Reported analysis N=291 N as reported for this meta-analytic row; not a single item base. K=3 effect sizes. | Original source [S04] Table 1, corresponding time-window rows |
F13 Published standardized dependent mean-change effect, Hedges g; negative indicates lower satisfaction. Different time windows and sex/couple summaries can overlap and must not be added. N/K are row-specific source metadata. High heterogeneity limits a single typical-couple interpretation. No percent decline or new causal/significance claim.
| Measure / timing | Published estimate | Audience, actual period and analysis base | Source |
|---|---|---|---|
| Nonparent women: comparable first-year interval | -0.12 Hedges g | Included first-time-parent longitudinal samples and smaller nonparent comparison samples; English-language peer-reviewed studies under stated criteria Original longitudinal studies located in searches September 2019–December 2021; pregnancy through first two postpartum years. Exact valid item n unavailable. Reported analysis N=165 N as reported for this meta-analytic row; not a single item base. K=4 effect sizes. | Original source [S04] Table 1, corresponding time-window rows |
| Nonparent men: comparable first-year interval | -0.13 Hedges g | Included first-time-parent longitudinal samples and smaller nonparent comparison samples; English-language peer-reviewed studies under stated criteria Original longitudinal studies located in searches September 2019–December 2021; pregnancy through first two postpartum years. Exact valid item n unavailable. Reported analysis N=165 N as reported for this meta-analytic row; not a single item base. K=4 effect sizes. | Original source [S04] Table 1, corresponding time-window rows |
The synthesis standardizes change so that studies using different instruments can be analyzed together. A value of −0.31 does not mean a 31% decrease or 31% of couples becoming dissatisfied. The large heterogeneity reported for the main parent summaries indicates substantial variation across included effects. The nonparent evidence is much smaller, and its average changes are not interchangeable with an experimentally controlled parenthood effect.
Does average satisfaction continue changing in the second year?
F14 Published standardized dependent mean-change effect, Hedges g; negative indicates lower satisfaction. Different time windows and sex/couple summaries can overlap and must not be added. N/K are row-specific source metadata. High heterogeneity limits a single typical-couple interpretation. No percent decline or new causal/significance claim.
| Measure / timing | Published estimate | Audience, actual period and analysis base | Source |
|---|---|---|---|
| Women: first to second postpartum year | -0.16 Hedges g | Included first-time-parent longitudinal samples and smaller nonparent comparison samples; English-language peer-reviewed studies under stated criteria Original longitudinal studies located in searches September 2019–December 2021; pregnancy through first two postpartum years. Exact valid item n unavailable. Reported analysis N=136,337 N as reported for this meta-analytic row; not a single item base. K=15 effect sizes. | Original source [S04] Table 1, corresponding time-window rows |
| Men: first to second postpartum year | -0.14 Hedges g | Included first-time-parent longitudinal samples and smaller nonparent comparison samples; English-language peer-reviewed studies under stated criteria Original longitudinal studies located in searches September 2019–December 2021; pregnancy through first two postpartum years. Exact valid item n unavailable. Reported analysis N=1,445 N as reported for this meta-analytic row; not a single item base. K=11 effect sizes. | Original source [S04] Table 1, corresponding time-window rows |
F15 Published standardized dependent mean-change effect, Hedges g; negative indicates lower satisfaction. Different time windows and sex/couple summaries can overlap and must not be added. N/K are row-specific source metadata. High heterogeneity limits a single typical-couple interpretation. No percent decline or new causal/significance claim.
| Measure / timing | Published estimate | Audience, actual period and analysis base | Source |
|---|---|---|---|
| Overall: pregnancy to two postpartum years | -0.37 Hedges g | Included first-time-parent longitudinal samples and smaller nonparent comparison samples; English-language peer-reviewed studies under stated criteria Original longitudinal studies located in searches September 2019–December 2021; pregnancy through first two postpartum years. Exact valid item n unavailable. Reported analysis N=137,779 N as reported for this meta-analytic row; not a single item base. K=26 effect sizes. | Original source [S04] Table 1, corresponding time-window rows |
The review reports further average decline between the first and second postpartum years, as well as a separately calculated overall two-year effect. Those estimates use different study subsets and standardization. Adding the two annual effects would not recreate the reported overall effect. The review’s searches ended in December 2021, so its 2022 publication date does not make the underlying studies a single recent cohort.
What does long-term panel study add?
F09 Pooled person-year means for a 0–10 satisfaction item, higher means greater satisfaction. Childless and parent observations can include the same respondent at different times. Person-years are repeated observations, not distinct people. These are descriptive means, separate from within-person regression coefficients.
| Measure / timing | Published estimate | Audience, actual period and analysis base | Source |
|---|---|---|---|
| Women: childless observations | 8.35 satisfaction points (0–10) | Mixed-gender married or unmarried unions, childless in first observed year, at least two observations, one selected relationship per respondent German Family Panel (pairfam), 2008–2022; selected available waves, excluding 2,4,6,8. Exact valid item n unavailable. Reported analysis N=6,367 person-years in descriptive cell. | Original source [S03] Table 1, Relationship satisfaction and N rows |
| Women: parent observations | 7.82 satisfaction points (0–10) | Mixed-gender married or unmarried unions, childless in first observed year, at least two observations, one selected relationship per respondent German Family Panel (pairfam), 2008–2022; selected available waves, excluding 2,4,6,8. Exact valid item n unavailable. Reported analysis N=3,196 person-years in descriptive cell. | Original source [S03] Table 1, Relationship satisfaction and N rows |
| Men: childless observations | 8.28 satisfaction points (0–10) | Mixed-gender married or unmarried unions, childless in first observed year, at least two observations, one selected relationship per respondent German Family Panel (pairfam), 2008–2022; selected available waves, excluding 2,4,6,8. Exact valid item n unavailable. Reported analysis N=5,558 person-years in descriptive cell. | Original source [S03] Table 1, Relationship satisfaction and N rows |
| Men: parent observations | 7.89 satisfaction points (0–10) | Mixed-gender married or unmarried unions, childless in first observed year, at least two observations, one selected relationship per respondent German Family Panel (pairfam), 2008–2022; selected available waves, excluding 2,4,6,8. Exact valid item n unavailable. Reported analysis N=2,889 person-years in descriptive cell. | Original source [S03] Table 1, Relationship satisfaction and N rows |
The 2026 paper broadens the observation period by using German Family Panel data from 2008–2022. Its descriptive table pools person-years, so a person can contribute observations before and after becoming a parent. The parent-versus-childless descriptive mean difference therefore is not a comparison of two fixed, independent groups and is not the same quantity as the fixed-effects coefficients.
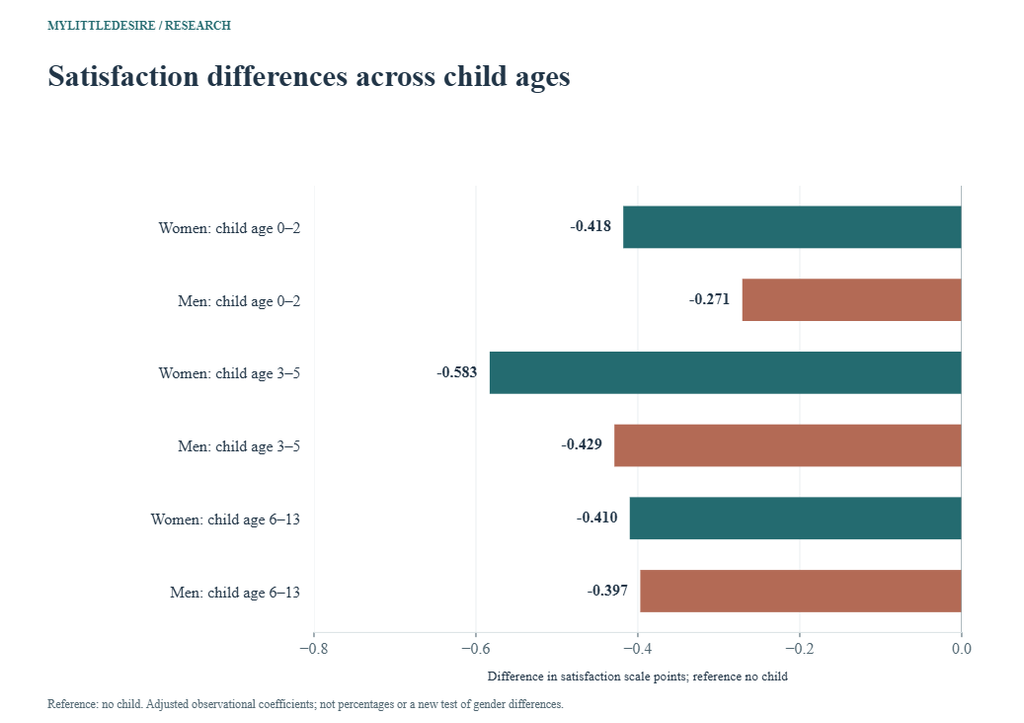
F10 Table 2 fixed-effects coefficients on the 0–10 satisfaction item; reference category no child. Controls include age, pregnancy, marriage, relationship duration and its square, health, employment, education and survey year. Observational model; time-varying confounding remains. Coefficients are scale points, not percent declines, raw means or a test of sex differences.
| Measure / timing | Published estimate | Audience, actual period and analysis base | Source |
|---|---|---|---|
| First child age 0–2 years | -0.418 satisfaction points (0–10) | Women in selected initially childless mixed-gender union panel German Family Panel (pairfam), 2008–2022; selected available waves, excluding 2,4,6,8. Exact valid item n unavailable. Reported analysis N=2,187 persons in sex-specific model; 9,563 person-years. | Original source [S03] Table 2, first-child-age coefficients and model N |
| First child age 3–5 years | -0.583 satisfaction points (0–10) | Women in selected initially childless mixed-gender union panel German Family Panel (pairfam), 2008–2022; selected available waves, excluding 2,4,6,8. Exact valid item n unavailable. Reported analysis N=2,187 persons in sex-specific model; 9,563 person-years. | Original source [S03] Table 2, first-child-age coefficients and model N |
| First child age 6–13 years | -0.410 satisfaction points (0–10) | Women in selected initially childless mixed-gender union panel German Family Panel (pairfam), 2008–2022; selected available waves, excluding 2,4,6,8. Exact valid item n unavailable. Reported analysis N=2,187 persons in sex-specific model; 9,563 person-years. | Original source [S03] Table 2, first-child-age coefficients and model N |
F11 Table 2 fixed-effects coefficients on the 0–10 satisfaction item; reference category no child. Controls include age, pregnancy, marriage, relationship duration and its square, health, employment, education and survey year. Observational model; time-varying confounding remains. Coefficients are scale points, not percent declines, raw means or a test of sex differences.
| Measure / timing | Published estimate | Audience, actual period and analysis base | Source |
|---|---|---|---|
| First child age 0–2 years | -0.271 satisfaction points (0–10) | Men in selected initially childless mixed-gender union panel German Family Panel (pairfam), 2008–2022; selected available waves, excluding 2,4,6,8. Exact valid item n unavailable. Reported analysis N=1,921 persons in sex-specific model; 8,447 person-years. | Original source [S03] Table 2, first-child-age coefficients and model N |
| First child age 3–5 years | -0.429 satisfaction points (0–10) | Men in selected initially childless mixed-gender union panel German Family Panel (pairfam), 2008–2022; selected available waves, excluding 2,4,6,8. Exact valid item n unavailable. Reported analysis N=1,921 persons in sex-specific model; 8,447 person-years. | Original source [S03] Table 2, first-child-age coefficients and model N |
| First child age 6–13 years | -0.397 satisfaction points (0–10) | Men in selected initially childless mixed-gender union panel German Family Panel (pairfam), 2008–2022; selected available waves, excluding 2,4,6,8. Exact valid item n unavailable. Reported analysis N=1,921 persons in sex-specific model; 8,447 person-years. | Original source [S03] Table 2, first-child-age coefficients and model N |
Fixed-effects models compare people with themselves over time while controlling for specified changing characteristics. That addresses stable differences between respondents, but unmeasured factors that change with time can remain. The negative coefficients describe lower satisfaction relative to the no-child reference on the 0–10 item. They do not show a percentage loss, prove a particular mechanism or establish a statistically significant difference between women and men.
What did the eight-year prospective study estimate around birth?
F16 Author-reported Cohen d for modeled level change in satisfaction around first birth. Parent model group 132 couples, not a population percentage. Effects differ from simple before/after means and meta-analytic g. Raw table/response-scale alignment unresolved, so raw-score means and point drops excluded.
| Measure / timing | Published estimate | Audience, actual period and analysis base | Source |
|---|---|---|---|
| Mothers: modeled level change | -0.71 Cohen d | Selected premarital-education cohort recruited through religious organizations; 132 couples became first-time parents within the larger 218-couple analysis Historical cohort followed over first eight marriage years; calendar field years not established in checked source. Exact valid item n unavailable. Reported analysis N=132 couples in parent model group; exact valid item n unavailable. | Original source [S05] Results, Mean Change in Relationship Functioning After Birth; Table 2 |
| Fathers: modeled level change | -0.45 Cohen d | Selected premarital-education cohort recruited through religious organizations; 132 couples became first-time parents within the larger 218-couple analysis Historical cohort followed over first eight marriage years; calendar field years not established in checked source. Exact valid item n unavailable. Reported analysis N=132 couples in parent model group; exact valid item n unavailable. | Original source [S05] Results, Mean Change in Relationship Functioning After Birth; Table 2 |
The eight-year prospective paper modeled a level change around first birth alongside longer-running relationship trajectories. This collection includes its clearly labelled standardized satisfaction effects. Its methods describe a seven-category response while its raw tables use larger numerical coding, so raw-score means and point drops are excluded here. A standardized model effect remains distinct from a simple before-and-after average and from the later meta-analysis’s Hedges g.
How can readers use the research in a partnership discussion?
These are editorial questions prompted by the research, rather than interventions tested by this collection. They can help partners describe what has changed without treating a group average as a forecast for their own relationship.
| Topic | Question to discuss | Research distinction |
|---|---|---|
| Expectations | Which parts of our shared routine have changed since pregnancy or birth? | Separate change over time from a judgment about parenthood itself |
| Time and responsibilities | Which practical or planning tasks need a clearer owner or backup? | Task division and global relationship satisfaction are different measures |
| Connection | When does each person feel heard, appreciated or supported? | Use concrete experiences alongside a broad satisfaction rating |
| First versus later birth | Which demands are new this time, and which are familiar? | Parity groups differ before birth as well as afterward |
| Money and work | Which work, spending or administration changes are affecting daily life? | Context can change at the same time as parenthood |
| Tracking changes | Are we comparing the same question at comparable times? | A mean score, adjusted prediction and cutoff percentage answer different questions |
For the financial side of shared responsibilities, see our couples’ money management statistics. The linked topic provides context rather than an explanation established by the studies above.
Ten reproducible descriptive comparisons
Each comparison is first value minus second. Score differences retain their scale units; differences between percentages use percentage points. The workbook checks unique observation IDs and matching units and measure types. These calculations reuse published numbers and add no independent observations, significance tests or causal estimates.
| Comparison | Published inputs | Difference | Qualification |
|---|---|---|---|
| Parent husbands: twelve months after minus one month before birth | 37.64 QMI points − 40.44 QMI points | -2.8 QMI points | Difference of published observed QMI means, not the fitted growth-model effect. |
| Parent wives: twelve months after minus one month before birth | 38.2 QMI points − 41.23 QMI points | -3.03 QMI points | Selected historical parent cohort; no percent conversion or individual prediction. |
| Nonparent husbands: fourth minus second matched visit | 38.78 QMI points − 40.31 QMI points | -1.53 QMI points | Matched marital duration; no childbirth occurred in this comparison group. |
| Nonparent wives: fourth minus second matched visit | 39.95 QMI points − 40.25 QMI points | -0.3 QMI points | Comparison group is selected and voluntarily childless; not all people without children. |
| Observed father score: fourteen months minus pregnancy | 18.09 PFB-K points − 20.65 PFB-K points | -2.56 PFB-K points | Different published valid score bases. Difference of means is not an exact matched-person decline. |
| Father cutoff share: fourteen months minus pregnancy | 15.7% − 5.9% | 9.8 percentage points | Descriptive percentage-point contrast; exact cutoff bases and person-level transitions unavailable. |
| Father cutoff share: two years minus fourteen months | 9.9% − 15.7% | -5.8 percentage points | Changing follow-up availability; no tested recovery or individuals leaving threshold inferred. |
| Adjusted first-time father score: two years minus pregnancy | 16.7 PFB-K points − 20.3 PFB-K points | -3.6 PFB-K points | Difference from rounded model-implied means; no raw-person change or causal effect. |
| Adjusted second-time father score: two years minus pregnancy | 18.1 PFB-K points − 17.5 PFB-K points | 0.6 PFB-K points | Different parity group and adjusted trajectory; no proof a second birth improves relationships. |
| German women’s descriptive mean: parent minus childless observations | 7.82 satisfaction points (0–10) − 8.35 satisfaction points (0–10) | -0.53 satisfaction points (0–10) | Pooled person-year contrast, not the within-person fixed-effects coefficient. |
Common questions
Does relationship satisfaction decline after having a baby?
Several selected longitudinal studies and the meta-analysis report average declines around first parenthood. The size and shape depend on the cohort, timing, comparison and instrument. These averages do not determine what happens to every couple.
What percentage of couples become unhappy after a baby?
This collection does not establish one universal percentage. DREAM reports a specific PFB-K score threshold in a selected regional father cohort. Standardized effects and mean scores from the other studies cannot be converted into a share of unhappy couples.
Does g=−0.31 mean satisfaction falls by 31%?
No. Hedges g is a standardized mean-change effect. It is neither a percentage-point difference nor a prevalence rate.
Can the first and second postpartum years be added together?
The meta-analysis uses different subsets and standardization for those windows. Use its separately reported overall two-year effect rather than adding the annual effects.
Are first-time fathers less satisfied than second-time fathers?
In DREAM’s adjusted model, their relative positions changed across visits. First-time fathers started higher, while the rounded later means were higher for second-time fathers. The result is specific to that selected cohort and model, not a universal parity ranking.
Does a second child improve a relationship?
The selected observational comparison does not establish that causal effect. Groups differ at baseline and the model adjusts only for measured covariates.
Do the German panel counts refer to people or repeated observations?
Both units appear. The analysis includes 4,108 people contributing 18,010 person-years. Descriptive cell bases are person-years, while regression tables give people and person-years by sex. Those denominators must stay separate.
Research method and limitations
The collection has 52 selected numerical observations in 16 groups: Lawrence 16, DREAM 16, pairfam ten, the Bogdan meta-analysis eight and Doss two. Five publications come from four publisher labels. There are 24 observed means, eight model-implied means, four threshold percentages, six fixed-effects coefficients, eight meta-analytic effects and two standardized birth-level effects. Repeated waves and the review literature are not independent replications.
Original papers, accessible tables, methods and figure captions were checked. DREAM’s Table 2 and Figure 3 and the meta-analysis’s Table 1 were inspected visually in original graphics/PDF. Lawrence’s original table and the current pairfam and Doss texts were checked through original-source retrieval when direct local downloads were unavailable. This is a review of published aggregates, not an audit of confidential participant data or a new meta-analysis.
Four DREAM observed means have an explicit valid score n in Table 2. Exact valid item bases for the other 48 records remain blank. Full analysis groups, person-years, meta-analysis row N/K and subgroup totals are stored separately with their units. No raw counts were reconstructed from rounded percentages. The meta-analysis’s reported grand participant count does not reconcile with its stated sex subtotals and is not used as an exact denominator. Pairfam’s final model counts are consistent across its tables, while an intermediate attrition count is not arithmetically consistent; no correction is invented.
Limits to preserve: Distinct scales and estimands cannot be pooled into a universal satisfaction score or parenthood-harm rate. Selected empirical cohorts concern the US and Germany; the review covers international studies. This collection does not establish separate national UK, Canadian, Australian or Indian prevalence. Most selected couple analyses concern husband–wife or mixed-gender relationships, so no universal inference for every family type is made. No new causal experiment, respondent-level analysis, statistical test or clinical diagnosis was performed.
Original sources and screened context
- S01. Lawrence, Cobb, Rothman, Rothman & Bradbury. Marital Satisfaction Across the Transition to Parenthood. Publication: February 2008; author manuscript available February 2009. Actual period: Historical US newlywed cohort followed into first parenthood; calendar field years not established in checked paper. Analysis sample: 156 Couples in selected analysis: 104 parent and 52 nonparent couples, from an original 172-couple cohort. Not the valid respondent n in each table cell. Table 1 gives group totals of 104 and 52 couples, but no separate exact valid person count for each sex/wave mean. Method: Prospective cohort, marriage-license recruitment, Quality of Marriage Index (QMI), four selected waves. QMI range 6–45, higher means greater satisfaction. Parents measured early in marriage, one month before birth, six and twelve months after birth; nonparents aligned by marital duration. Small selected historical cohort, observational and not nationally representative. Parent selection and pregnancy planning matter. Published observed means are not adjusted growth-model estimates or percentages. Unknown cell n remains blank; couple totals are separate. Supporting records: record 1.
- S02. Mack, Brunke, Staudt, Kopp, Weise & Garthus-Niegel. Changes in relationship satisfaction in the transition to parenthood among fathers. Publication: August 30, 2023. Actual period: DREAM recruitment June 2017–December 2020; data available January 31, 2022; pregnancy to approximately two years postpartum. Analysis sample: 606 Fathers in final analytic sample: 500 first-time and 106 second-time fathers. Larger DREAM parent cohort and enrolled fathers are different denominators. Table 2 observed-score means explicitly report n=600,599,599,246. Exact bases for four cutoff percentages unreported. Figure 3 model uses partially missing longitudinal data; full parity groups are not valid n at every wave. Method: Community cohort; PFB-K nine-item relationship-satisfaction sum, range 0–27. Four assessments: pregnancy, about eight weeks after anticipated birth, fourteen months and two years after actual birth. Observed means, cutoff percentages and adjusted latent-growth means retained as distinct estimates. Selected relatively advantaged regional fathers, not a national prevalence survey. PFB-K ≤13 is the paper’s dissatisfaction threshold, not a diagnosis or breakup risk. Figure 3 values rounded to one decimal and adjusted for listed covariates. Table 2 final-wave n=246 cannot be reconciled with text reporting 353 complete four-wave cases; preserve table bases only for those means, keep cutoff bases unknown and do not infer paired change. Supporting records: record 1, record 2, record 3.
- S03. Matthias Pollmann-Schult. Why Parenthood Strains Relationships: Investigating the Mechanisms Behind Declining Relationship Satisfaction. Publication: First published January 28, 2026; volume 88, issue 4, pp.1144–1158. Actual period: German Family Panel (pairfam), 2008–2022; selected available waves, excluding 2,4,6,8. Analysis sample: 4108 Respondents contributing 18,010 person-years. Women: 2,187 persons/9,563 person-years; men: 1,921/8,447. These units are not interchangeable. Table 1 descriptive cells use person-years: women childless 6,367, parent 3,196; men childless 5,558, parent 2,889. Table 2 model bases are sex-specific persons/person-years, not cell-specific survey item n. Method: Unbalanced longitudinal panel pooling main respondents and partners. Satisfaction item ranges 0–10. Table 1 pooled descriptive means kept separate from Table 2 within-person fixed-effects coefficients for first-child age bands, with covariate controls and panel-robust standard errors. Analytic subset of nationally representative panel, not a nationally representative parent prevalence estimate. Same people may contribute preparent and parent person-years. Fixed effects control time-constant differences; unmeasured time-varying factors remain. Methods attrition arithmetic has an inconsistent intermediate count (4,186 minus 78 versus stated 4,111); use final table-supported 4,108/18,010 without repairing it. No causal mediation or gender-difference test added. Supporting records: record 1.
- S04. Bogdan, Turliuc & Candel. Transition to Parenthood and Marital Satisfaction: A Meta-Analysis. Publication: July 20, 2022. Actual period: Original longitudinal studies located in searches September 2019–December 2021; pregnancy through first two postpartum years. Analysis sample: 49 Studies in the meta-analysis, not respondents. Authors report 97 parent and nine nonparent samples; each selected row has its own reported K and N. Reported grand participant total does not reconcile with stated male/female subtotals and is not used as an exact denominator. Table 1 reported analysis N and effect-count K retained in separate fields; no single valid item n assigned. N/K across sex, couple and time-window summaries must not be summed. Method: Original random-effects meta-analysis of standardized dependent mean changes (Hedges g). Negative g indicates lower satisfaction after the specified interval. Some missing pre/post correlations imputed using authors’ average. Selected point effects, reported uncertainty and heterogeneity retained as metadata. Synthesis overlaps underlying literature and is not a new independent cohort. High heterogeneity in major parent summaries and few nonparent samples. Different time-window g values are not additive or percent declines. Published label medium is not adopted as a universal interpretation. Table 1 uncertainty retained as printed; no recalculated confidence intervals, pooled counts or new significance tests. Supporting records: record 1, record 2.
- S05. Doss, Rhoades, Stanley & Markman. The Effect of the Transition to Parenthood on Relationship Quality: An Eight-Year Prospective Study. Publication: March 2009; author manuscript available March 2010. Actual period: Historical cohort followed over first eight marriage years; calendar field years not established in checked source. Analysis sample: 218 Couples across parent/nonparent analyses; the selected birth-associated standardized effects concern 132 parent couples. Parent model group is 132 couples, not exact valid n for a single birth assessment. No exact selected item n assigned. Method: Prospective repeated assessments and interrupted-time-series/growth-model comparison around first birth. Two selected author-reported Cohen d effects describe modeled level changes in satisfaction, not raw mean changes or percentages. Selected historical, predominantly White married sample and not a universal parent rate. Birth not randomized. Methods describe a 1–7 satisfaction response but raw tables use larger numerical coding; raw-score means and point drops excluded because scale alignment was not resolved. Only clearly labelled published standardized satisfaction effects retained. Supporting records: record 1.
Screened context, without added observations
- R01. Mitnick, Heyman & Slep. Changes in Relationship Satisfaction Across the Transition to Parenthood: A Meta-Analysis. Earlier review describes small average changes and emphasizes newlywed nonparent comparisons. Screened as context; no numerical observations added from this review. Different synthesis scope and assessment windows cannot be treated as a measured annual trend or independent evidence summed with overlapping later reviews.
- R02. Original numerical publications S02–S05. Sample, coding and analysis distinctions. DREAM Table 2 and complete-case ANOVA counts do not align; pairfam intermediate attrition arithmetic is inconsistent; Doss raw response/table scale alignment unresolved; meta-analysis grand participant and sex totals do not reconcile. Preserve clearly attributed selected aggregates, reported analysis units and uncertainty. Do not invent corrections, substitute bases or pool populations.
How to cite this resource
MyLittleDesire. Parenthood & Relationship Satisfaction Statistics 2027. https://mylittledesire.com/parenthood-relationship-satisfaction-statistics/.