Chosen family describes people who are treated as family through meaningful personal bonds beyond blood or legal ties. In Ipsos’s September 2025 US survey, 49% of adults considered a friend they were not blood- or legally related to part of their family. A different question found that 80% selected the view that chosen family is as important as blood or legal relations over the alternative that only blood or legally designated relatives count. One measures personal inclusion; the other measures a view expressed in a forced choice. Ipsos [S01].
This resource collects 71 published numerical observations in 25 groups, four original charts and ten reproducible descriptive comparisons from eight numerical source records and five publisher labels. The evidence covers US surveys, a Canadian survey, Australian volunteer participants and a self-selected Indian WhatsApp sample. Repeated response categories and demographic cells are not independent studies, and these sources do not provide a comparable global or four-country prevalence rate.
49%
80%
Considered a nonrelative friend part of their family.Ipsos US, September 2025; Q2 personal inclusion. Ipsos [S01]
Selected chosen family as equally important in a forced choice.Ipsos US, September 2025; a view, not possession. Ipsos [S01]
78%
77%
Agreed they rely on chosen family for emotional support.Harris LGBTQIA+ online sample, May–June 2023. The Harris Poll [S02]
Agreed chosen family plays an important role in their life.Ipsos Canada, January 2026; different question from US. Ipsos [S07]
What do chosen family statistics measure?
The sources use related but distinct ideas: considering a nonrelative family, valuing the concept of chosen family, relying on someone for care, and reporting a strained relationship. Someone can value chosen family without identifying a particular person in a survey, and can maintain chosen-family bonds alongside biological or legally recognized family. A general friendship statistic does not establish a chosen-family bond unless the question explicitly asks about family.
| Construct | Example in this collection | Boundary |
|---|---|---|
| Personal family inclusion | Considering a nonrelative friend family | Not the number or share of members in a family network |
| Forced-choice opinion | Selecting chosen family as equally important | Not an agreement scale or possession rate |
| Importance / agreement | Valuing the concept or agreeing it matters in one’s life | Different prompts and response thresholds |
| Prospective care | Who someone would rely on if health needs required time off | Intention, not observed receipt |
| Reported care experience | Having called on or been called on by chosen family | Separate unpaired questions; not care hours or reciprocity |
| Historical time-off need | Being called on when help required time off work | Ever-reported need, not annual paid-leave use |
| Estrangement | Not communicating due to lost closeness in a broad chosen-family category | All-adult base, not failure rate among chosen-family holders |
Also Read:-
Parenthood Relationship Satisfaction Statistics 2027
Parenting Partnership Roles Statistics 2027
Wedding Cost by State Statistics 2027
Wedding Planning Stress Statistics 2027
Micro Wedding Elopement Statistics 2027
Who counts nonrelatives as family in the US?
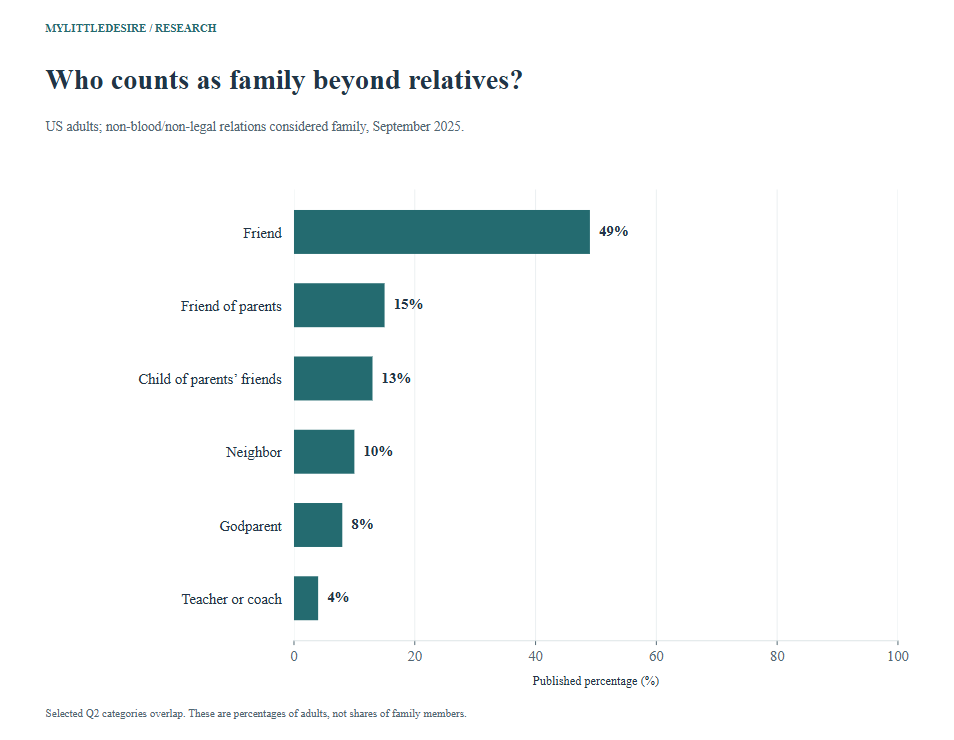
F01 All eleven Q2 published response categories; no computed total. Among non-blood/non-legal relations, considers this category family. Multiple categories overlap; not a distribution of chosen-family members or the population lacking any support.
| Measure / response | Published result | Eligible audience, period and base | Source |
|---|---|---|---|
| Friend | 49% | US adults 18+ in the Ipsos Future of Family survey; specified gender and generation groups September 25–26, 2025 · United States · Reported unweighted/question base n=1,305; weighted banner base=1,305 | Original source [S01] Original tables physical p.10, Q2 Total column |
| Neighbor | 10% | US adults 18+ in the Ipsos Future of Family survey; specified gender and generation groups September 25–26, 2025 · United States · Reported unweighted/question base n=1,305; weighted banner base=1,305 | Original source [S01] Original tables physical p.10, Q2 Total column |
| Friend of parents | 15% | US adults 18+ in the Ipsos Future of Family survey; specified gender and generation groups September 25–26, 2025 · United States · Reported unweighted/question base n=1,305; weighted banner base=1,305 | Original source [S01] Original tables physical p.10, Q2 Total column |
| Godparent | 8% | US adults 18+ in the Ipsos Future of Family survey; specified gender and generation groups September 25–26, 2025 · United States · Reported unweighted/question base n=1,305; weighted banner base=1,305 | Original source [S01] Original tables physical p.10, Q2 Total column |
| Child/children of parents’ friends | 13% | US adults 18+ in the Ipsos Future of Family survey; specified gender and generation groups September 25–26, 2025 · United States · Reported unweighted/question base n=1,305; weighted banner base=1,305 | Original source [S01] Original tables physical p.10, Q2 Total column |
| Caregiver, nanny or babysitter | 3% | US adults 18+ in the Ipsos Future of Family survey; specified gender and generation groups September 25–26, 2025 · United States · Reported unweighted/question base n=1,305; weighted banner base=1,305 | Original source [S01] Original tables physical p.10, Q2 Total column |
| Housekeeper | 3% | US adults 18+ in the Ipsos Future of Family survey; specified gender and generation groups September 25–26, 2025 · United States · Reported unweighted/question base n=1,305; weighted banner base=1,305 | Original source [S01] Original tables physical p.10, Q2 Total column |
| Teacher or coach | 4% | US adults 18+ in the Ipsos Future of Family survey; specified gender and generation groups September 25–26, 2025 · United States · Reported unweighted/question base n=1,305; weighted banner base=1,305 | Original source [S01] Original tables physical p.10, Q2 Total column |
| Clergy or religious leader | 4% | US adults 18+ in the Ipsos Future of Family survey; specified gender and generation groups September 25–26, 2025 · United States · Reported unweighted/question base n=1,305; weighted banner base=1,305 | Original source [S01] Original tables physical p.10, Q2 Total column |
| Other | 2% | US adults 18+ in the Ipsos Future of Family survey; specified gender and generation groups September 25–26, 2025 · United States · Reported unweighted/question base n=1,305; weighted banner base=1,305 | Original source [S01] Original tables physical p.10, Q2 Total column |
| None of these | 40% | US adults 18+ in the Ipsos Future of Family survey; specified gender and generation groups September 25–26, 2025 · United States · Reported unweighted/question base n=1,305; weighted banner base=1,305 | Original source [S01] Original tables physical p.10, Q2 Total column |
The Q2 prompt specifically concerns people outside blood or legal relationships. A respondent could select several categories, so the percentages cannot be added into a composition of their family. The 40% “none of these” response should retain that wording: it is not proof that every respondent in that group has no chosen family or support network. Ipsos [S01].
F02 Friend row, male/female columns. Among non-blood/non-legal relations, considers this category family. Multiple categories overlap; not a distribution of chosen-family members or the population lacking any support.
| Measure / response | Published result | Eligible audience, period and base | Source |
|---|---|---|---|
| Male respondents | 48% | US adult male respondents September 25–26, 2025 · United States · Reported unweighted/question base n=662; weighted banner base=635 | Original source [S01] Original tables physical p.10, Q2 Friend × gender |
| Female respondents | 51% | US adult female respondents September 25–26, 2025 · United States · Reported unweighted/question base n=641; weighted banner base=668 | Original source [S01] Original tables physical p.10, Q2 Friend × gender |
F03 Four adult generation columns; source birth-year labels retained. Among non-blood/non-legal relations, considers this category family. Multiple categories overlap; not a distribution of chosen-family members or the population lacking any support. Only adult participants, not all people born in those year ranges. Cross-sectional groups, not a trend.
| Measure / response | Published result | Eligible audience, period and base | Source |
|---|---|---|---|
| Gen Z, born 1997–2012 | 57% | US adult respondents in Gen Z, born 1997–2012 September 25–26, 2025 · United States · Reported unweighted/question base n=192; weighted banner base=230 | Original source [S01] Original tables physical p.10, Q2 Friend × generation |
| Millennials, born 1981–1996 | 51% | US adult respondents in Millennials, born 1981–1996 September 25–26, 2025 · United States · Reported unweighted/question base n=475; weighted banner base=367 | Original source [S01] Original tables physical p.10, Q2 Friend × generation |
| Gen X, born 1965–1980 | 51% | US adult respondents in Gen X, born 1965–1980 September 25–26, 2025 · United States · Reported unweighted/question base n=331; weighted banner base=339 | Original source [S01] Original tables physical p.10, Q2 Friend × generation |
| Boomers, born 1946–1964 | 41% | US adult respondents in Boomers, born 1946–1964 September 25–26, 2025 · United States · Reported unweighted/question base n=288; weighted banner base=353 | Original source [S01] Original tables physical p.10, Q2 Friend × generation |
The adult Gen Z–Boomer contrast is cross-sectional. It does not follow the same people as they age or establish a historical increase. The source’s birth-year labels are retained, but the sample includes adults only. For broader measures of friend counts, contact and quality, see our friendship statistics.
How important do US adults consider chosen family?
Ipsos’s Q11 asks people to choose which of two statements is closer to their view, even if neither fits exactly. This matters when quoting the 80% result. Describing it as an ordinary agreement question would change the measurement; describing it as the share who personally have chosen family would change the outcome. Ipsos [S01].
F04 Q11 selects the closer of two statements, even if neither exactly fits. Forced choice: selected chosen family as equally important rather than only blood/legal relatives counting. Not an agree/disagree question, and not a measure of personally having chosen family.
| Measure / response | Published result | Eligible audience, period and base | Source |
|---|---|---|---|
| All respondents | 80% | US adults 18+ in the Ipsos Future of Family survey; specified gender and generation groups September 25–26, 2025 · United States · Reported unweighted/question base n=1,305; weighted banner base=1,305 | Original source [S01] Original tables physical p.120, Q11 chosen-family row |
| Male respondents | 75% | US adult male respondents September 25–26, 2025 · United States · Reported unweighted/question base n=662; weighted banner base=635 | Original source [S01] Original tables physical p.120, Q11 chosen-family row |
| Female respondents | 86% | US adult female respondents September 25–26, 2025 · United States · Reported unweighted/question base n=641; weighted banner base=668 | Original source [S01] Original tables physical p.120, Q11 chosen-family row |
F05 Same forced-choice statement, four adult generation columns. Forced choice: selected chosen family as equally important rather than only blood/legal relatives counting. Not an agree/disagree question, and not a measure of personally having chosen family. Cross-sectional differences; no same-person aging change.
| Measure / response | Published result | Eligible audience, period and base | Source |
|---|---|---|---|
| Gen Z, born 1997–2012 | 85% | US adult respondents in Gen Z, born 1997–2012 September 25–26, 2025 · United States · Reported unweighted/question base n=192; weighted banner base=230 | Original source [S01] Original tables physical p.120, Q11 chosen-family × generation |
| Millennials, born 1981–1996 | 81% | US adult respondents in Millennials, born 1981–1996 September 25–26, 2025 · United States · Reported unweighted/question base n=475; weighted banner base=367 | Original source [S01] Original tables physical p.120, Q11 chosen-family × generation |
| Gen X, born 1965–1980 | 82% | US adult respondents in Gen X, born 1965–1980 September 25–26, 2025 · United States · Reported unweighted/question base n=331; weighted banner base=339 | Original source [S01] Original tables physical p.120, Q11 chosen-family × generation |
| Boomers, born 1946–1964 | 75% | US adult respondents in Boomers, born 1946–1964 September 25–26, 2025 · United States · Reported unweighted/question base n=288; weighted banner base=353 | Original source [S01] Original tables physical p.120, Q11 chosen-family × generation |
The male/female and generation results describe different respondent groups. They do not establish why views differ or predict an individual’s family relationships. Small other-gender and Silent Generation columns are not used in this collection.
What does LGBTQIA+ chosen-family research show?
The Harris report defines chosen family around intentional relationships of care and support without requiring blood or marriage. Its 2023 online sample contains LGBTQIA+ adults. The importance result and the separate agreement items give useful information about those respondents, while the report provides limited detail on recruitment and weighting. This resource therefore does not treat the percentages as universal facts about every LGBTQIA+ community. The Harris Poll [S02].
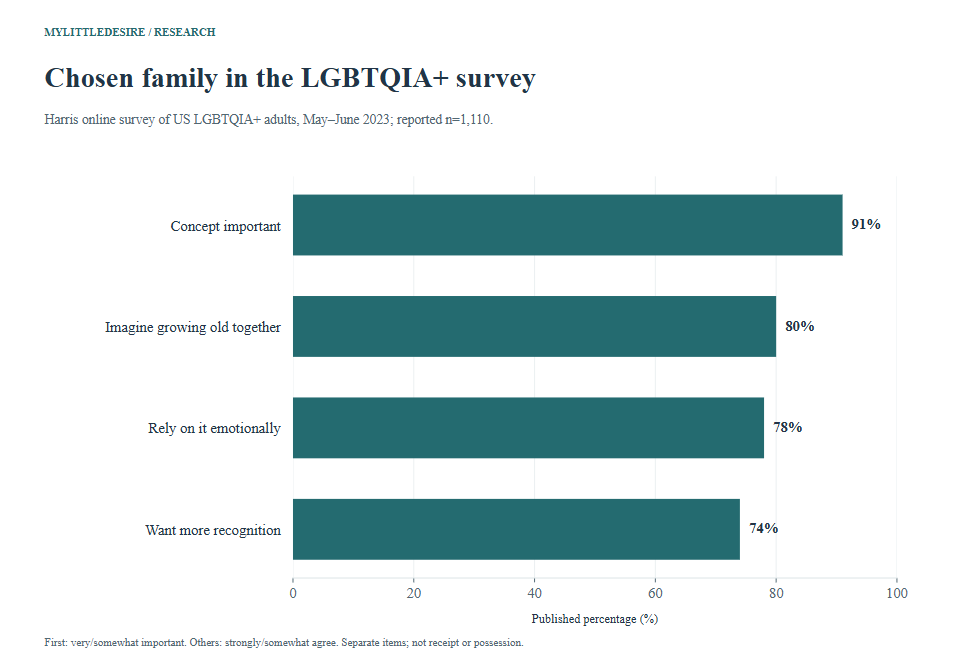
F06 Q16 very/somewhat important NET and the nested very-important response. Harris online sample of LGBTQIA+ adults; reported question base n=1,110. No probability-sampling claim. Concepts and agreement do not establish observed network size or receipt. The 59% subgroup is within 91%; do not add.
| Measure / response | Published result | Eligible audience, period and base | Source |
|---|---|---|---|
| Very or somewhat important | 91% | 1,110 LGBTQIA+ adults age 18+ in the Harris online survey May 26–June 1, 2023 · United States · Reported unweighted/question base n=1,110 | Original source [S02] Report physical p.4, Q16 |
| Very important | 59% | 1,110 LGBTQIA+ adults age 18+ in the Harris online survey May 26–June 1, 2023 · United States · Reported unweighted/question base n=1,110 | Original source [S02] Report physical p.4, Q16 |
F07 Q22 strongly/somewhat agree with three separate statements. Harris online sample of LGBTQIA+ adults; reported question base n=1,110. No probability-sampling claim. Concepts and agreement do not establish observed network size or receipt. Statements independently rated; not one exclusive distribution.
| Measure / response | Published result | Eligible audience, period and base | Source |
|---|---|---|---|
| Imagine growing old with chosen family | 80% | 1,110 LGBTQIA+ adults age 18+ in the Harris online survey May 26–June 1, 2023 · United States · Reported unweighted/question base n=1,110 | Original source [S02] Report physical p.4, Q22 |
| Rely on chosen family for emotional support | 78% | 1,110 LGBTQIA+ adults age 18+ in the Harris online survey May 26–June 1, 2023 · United States · Reported unweighted/question base n=1,110 | Original source [S02] Report physical p.4, Q22 |
| Want more products/services recognizing chosen family | 74% | 1,110 LGBTQIA+ adults age 18+ in the Harris online survey May 26–June 1, 2023 · United States · Reported unweighted/question base n=1,110 | Original source [S02] Report physical p.4, Q22 |
The 59% very-important response is included within the 91% important NET. The 78% emotional-reliance figure is an agreement response, rather than an independently observed support event. The 80% aging response concerns an expectation or imagined future, rather than a measured later-life outcome.
How does chosen family feature in health-related care?
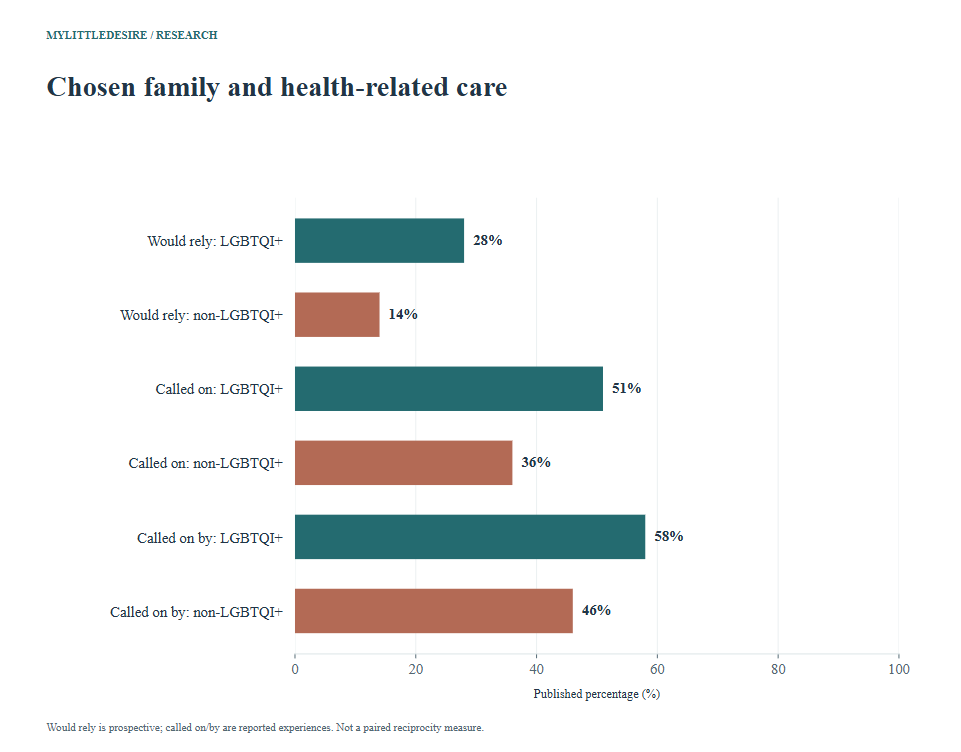
CAP’s 2022 survey separates likely sources of future care from reported experiences of asking or being asked for help. The prospective question allowed multiple selections and described chosen family as close friends regarded as family. The survey combines probability-recruited AmeriSpeak respondents with calibrated online opt-in respondents. Center for American Progress [S03].
F08 Prospective caretaking support when needing time off work; close friends like family. Multiple selections allowed. CAP/NORC 2022 weighted survey with probability and calibrated opt-in components. Exact valid item/subgroup n unavailable. Separate respondent groups; no causal identity effect.
| Measure / response | Published result | Eligible audience, period and base | Source |
|---|---|---|---|
| LGBTQI+ adults | 28% | US adults 18+, separately self-identified LGBTQI+ and non-LGBTQI+ groups; narrower transgender and LGBTQI+ people-of-color groups where specified May 27–June 23, 2022 · United States · Exact valid item/subgroup n unavailable | Original source [S03] Caregiving-support section, prospective question and following paragraph |
| Non-LGBTQI+ adults | 14% | US adults 18+, separately self-identified LGBTQI+ and non-LGBTQI+ groups; narrower transgender and LGBTQI+ people-of-color groups where specified May 27–June 23, 2022 · United States · Exact valid item/subgroup n unavailable | Original source [S03] Caregiving-support section, prospective question and following paragraph |
| Transgender adults | 35% | US adults 18+, separately self-identified LGBTQI+ and non-LGBTQI+ groups; narrower transgender and LGBTQI+ people-of-color groups where specified May 27–June 23, 2022 · United States · Exact valid item/subgroup n unavailable | Original source [S03] Caregiving-support section, prospective question and following paragraph |
| LGBTQI+ people of color | 30% | US adults 18+, separately self-identified LGBTQI+ and non-LGBTQI+ groups; narrower transgender and LGBTQI+ people-of-color groups where specified May 27–June 23, 2022 · United States · Exact valid item/subgroup n unavailable | Original source [S03] Caregiving-support section, prospective question and following paragraph |
F09 Reported having called on chosen family for support for a health-related need. CAP/NORC 2022 weighted survey with probability and calibrated opt-in components. Exact valid item/subgroup n unavailable. Separate respondent groups; no causal identity effect. Retrospective experience, not prospective willingness; reference period not specified in the published summary.
| Measure / response | Published result | Eligible audience, period and base | Source |
|---|---|---|---|
| LGBTQI+ adults | 51% | US adults 18+, separately self-identified LGBTQI+ and non-LGBTQI+ groups; narrower transgender and LGBTQI+ people-of-color groups where specified May 27–June 23, 2022 · United States · Exact valid item/subgroup n unavailable | Original source [S03] Caregiving-support section, 51%/36% paragraph |
| Non-LGBTQI+ adults | 36% | US adults 18+, separately self-identified LGBTQI+ and non-LGBTQI+ groups; narrower transgender and LGBTQI+ people-of-color groups where specified May 27–June 23, 2022 · United States · Exact valid item/subgroup n unavailable | Original source [S03] Caregiving-support section, 51%/36% paragraph |
F10 Reported having been relied on by chosen family to provide support for a health-related need. CAP/NORC 2022 weighted survey with probability and calibrated opt-in components. Exact valid item/subgroup n unavailable. Separate respondent groups; no causal identity effect. Does not quantify care hours or matched reciprocity; reference period not specified in the published summary.
| Measure / response | Published result | Eligible audience, period and base | Source |
|---|---|---|---|
| LGBTQI+ adults | 58% | US adults 18+, separately self-identified LGBTQI+ and non-LGBTQI+ groups; narrower transgender and LGBTQI+ people-of-color groups where specified May 27–June 23, 2022 · United States · Exact valid item/subgroup n unavailable | Original source [S03] Caregiving-support section, 58%/46% paragraph |
| Non-LGBTQI+ adults | 46% | US adults 18+, separately self-identified LGBTQI+ and non-LGBTQI+ groups; narrower transgender and LGBTQI+ people-of-color groups where specified May 27–June 23, 2022 · United States · Exact valid item/subgroup n unavailable | Original source [S03] Caregiving-support section, 58%/46% paragraph |
No reciprocity calculation: Reporting that chosen family has asked for help and reporting that one has asked chosen family for help are different, unpaired questions. Their percentages do not establish whether the same people gave and received comparable care. The published summary does not specify a reference period for the two experience questions; no annual rate is inferred.
What did the historical time-off survey find?
The 2017 CAP/GfK question asks about having been called on by a friend or chosen family member when helping required time off work. The appendix gives more precise one-decimal values than the rounded prose. We retain those values and the question’s event definition, rather than turning them into an annual paid-leave measure. Center for American Progress [S04].
F11 Published overall Appendix Figure 1 estimate, not rounded prose 32%. January 2017 CAP/GfK survey; ever called on by a friend or chosen family member when help required time off work. Not annual prevalence, paid-leave entitlement or verified completed leave use. One-decimal appendix estimates retained; valid item/subgroup n unknown.
| Measure / response | Published result | Eligible audience, period and base | Source |
|---|---|---|---|
| All respondents | 31.8% | US residents in CAP/GfK survey, with source-labelled LGBT, disability, age, gender and current-employment groups January 2017 · United States · Exact valid item/subgroup n unavailable | Original source [S04] Report physical/printed p.6, Appendix Figure 1, All respondents |
F12 Same ever-called/need-time-off question. January 2017 CAP/GfK survey; ever called on by a friend or chosen family member when help required time off work. Not annual prevalence, paid-leave entitlement or verified completed leave use. One-decimal appendix estimates retained; valid item/subgroup n unknown.
| Measure / response | Published result | Eligible audience, period and base | Source |
|---|---|---|---|
| LGBT respondents | 42.2% | US residents in CAP/GfK survey, with source-labelled LGBT, disability, age, gender and current-employment groups January 2017 · United States · Exact valid item/subgroup n unavailable | Original source [S04] Appendix Figure 1, LGBT status |
| Non-LGBT respondents | 31.0% | US residents in CAP/GfK survey, with source-labelled LGBT, disability, age, gender and current-employment groups January 2017 · United States · Exact valid item/subgroup n unavailable | Original source [S04] Appendix Figure 1, LGBT status |
F13 Same ever-called/need-time-off question. January 2017 CAP/GfK survey; ever called on by a friend or chosen family member when help required time off work. Not annual prevalence, paid-leave entitlement or verified completed leave use. One-decimal appendix estimates retained; valid item/subgroup n unknown.
| Measure / response | Published result | Eligible audience, period and base | Source |
|---|---|---|---|
| People with disabilities | 41.9% | US residents in CAP/GfK survey, with source-labelled LGBT, disability, age, gender and current-employment groups January 2017 · United States · Exact valid item/subgroup n unavailable | Original source [S04] Appendix Figure 1, Disability status |
| People without disabilities | 29.5% | US residents in CAP/GfK survey, with source-labelled LGBT, disability, age, gender and current-employment groups January 2017 · United States · Exact valid item/subgroup n unavailable | Original source [S04] Appendix Figure 1, Disability status |
F14 Four cross-sectional age groups. January 2017 CAP/GfK survey; ever called on by a friend or chosen family member when help required time off work. Not annual prevalence, paid-leave entitlement or verified completed leave use. One-decimal appendix estimates retained; valid item/subgroup n unknown. Current age group, not necessarily age when the event occurred.
| Measure / response | Published result | Eligible audience, period and base | Source |
|---|---|---|---|
| Age 18–29 | 27.1% | US residents in CAP/GfK survey, with source-labelled LGBT, disability, age, gender and current-employment groups January 2017 · United States · Exact valid item/subgroup n unavailable | Original source [S04] Appendix Figure 1, Age in years |
| Age 30–44 | 30.9% | US residents in CAP/GfK survey, with source-labelled LGBT, disability, age, gender and current-employment groups January 2017 · United States · Exact valid item/subgroup n unavailable | Original source [S04] Appendix Figure 1, Age in years |
| Age 45–59 | 36.5% | US residents in CAP/GfK survey, with source-labelled LGBT, disability, age, gender and current-employment groups January 2017 · United States · Exact valid item/subgroup n unavailable | Original source [S04] Appendix Figure 1, Age in years |
| Age 60+ | 31.4% | US residents in CAP/GfK survey, with source-labelled LGBT, disability, age, gender and current-employment groups January 2017 · United States · Exact valid item/subgroup n unavailable | Original source [S04] Appendix Figure 1, Age in years |
F15 Source-labelled male/female groups. January 2017 CAP/GfK survey; ever called on by a friend or chosen family member when help required time off work. Not annual prevalence, paid-leave entitlement or verified completed leave use. One-decimal appendix estimates retained; valid item/subgroup n unknown.
| Measure / response | Published result | Eligible audience, period and base | Source |
|---|---|---|---|
| Identify as male | 29.8% | US residents in CAP/GfK survey, with source-labelled LGBT, disability, age, gender and current-employment groups January 2017 · United States · Exact valid item/subgroup n unavailable | Original source [S04] Appendix Figure 1, Gender |
| Identify as female | 33.6% | US residents in CAP/GfK survey, with source-labelled LGBT, disability, age, gender and current-employment groups January 2017 · United States · Exact valid item/subgroup n unavailable | Original source [S04] Appendix Figure 1, Gender |
F16 Source current-employment categories, not status when care was needed. January 2017 CAP/GfK survey; ever called on by a friend or chosen family member when help required time off work. Not annual prevalence, paid-leave entitlement or verified completed leave use. One-decimal appendix estimates retained; valid item/subgroup n unknown.
| Measure / response | Published result | Eligible audience, period and base | Source |
|---|---|---|---|
| Currently employed | 33.3% | US residents in CAP/GfK survey, with source-labelled LGBT, disability, age, gender and current-employment groups January 2017 · United States · Exact valid item/subgroup n unavailable | Original source [S04] Appendix Figure 1, Employment status |
| Not currently employed | 29.4% | US residents in CAP/GfK survey, with source-labelled LGBT, disability, age, gender and current-employment groups January 2017 · United States · Exact valid item/subgroup n unavailable | Original source [S04] Appendix Figure 1, Employment status |
These findings cannot measure unmet needs among people unable to take time off, prove that leave was paid or establish completed leave use for every reported request. Current age and employment groups describe respondents at the survey date, not necessarily their situation when a past care request occurred. The 2017 and 2022 care figures use different questions and cannot be subtracted into a trend.
What do Australian participant results show?
AIFS asked participants whether chosen family or close friends were included when they thought about their family. This is a combined category. Its 2021 online convenience sample was not representative of Australia; the report’s complete-case analytic sample contained 4,436 people and only 12% were men. The following results describe participant groups. Australian Institute of Family Studies [S05].
F17 Included chosen family or close friends when thinking about family. Nonrepresentative Australian online convenience sample; analytic n=4,436 is not selected valid subgroup n. Combined chosen family or close friends category; not all Australians.
| Measure / response | Published result | Eligible audience, period and base | Source |
|---|---|---|---|
| Women participants | 43% | Convenience-sample Families in Australia respondents in the report’s complete-case analytic sample; specified gender and LGBTQ+ groups November 4–December 13, 2021 · Australia · Exact valid item/subgroup n unavailable | Original source [S05] Gender differences, paragraph following Figure 3 |
| Men participants | 31% | Convenience-sample Families in Australia respondents in the report’s complete-case analytic sample; specified gender and LGBTQ+ groups November 4–December 13, 2021 · Australia · Exact valid item/subgroup n unavailable | Original source [S05] Gender differences, paragraph following Figure 3 |
F18 Same combined inclusion category. Nonrepresentative Australian online convenience sample; analytic n=4,436 is not selected valid subgroup n. Combined chosen family or close friends category; not all Australians.
| Measure / response | Published result | Eligible audience, period and base | Source |
|---|---|---|---|
| LGBTQ+ participants | 58% | Convenience-sample Families in Australia respondents in the report’s complete-case analytic sample; specified gender and LGBTQ+ groups November 4–December 13, 2021 · Australia · Exact valid item/subgroup n unavailable | Original source [S05] LGBTQ+ family definitions, paragraph following Figure 6 |
| Non-LGBTQ+ participants | 39% | Convenience-sample Families in Australia respondents in the report’s complete-case analytic sample; specified gender and LGBTQ+ groups November 4–December 13, 2021 · Australia · Exact valid item/subgroup n unavailable | Original source [S05] LGBTQ+ family definitions, paragraph following Figure 6 |
The original report gives conflicting overall values: 41% in its key messages and 42% in Figure 2 and the discussion. It also differs on a non-Indigenous comparison. This resource excludes those conflicting estimates and uses the four consistent gender/LGBTQ+ subgroup figures. Pet-inclusive categories and general ratings of family values are not counted as chosen-family prevalence.
Can chosen-family ties become estranged?
Chosen-family relationships are also included in the Harris estrangement survey. Its category includes close friends and family friends who are not directly related. The original table defines estrangement as not communicating because closeness has been lost. Crucially, the table base is all US respondents, rather than only people already estranged or only people with chosen family. The Harris Poll [S06].
F19 Yes to the original broad chosen-family category. All US adult respondents, not a chosen-family-holder or already-estranged subset. Source defines estrangement as not communicating due to lost closeness; chosen category includes close/family friends. No permanent-cutoff, relationship-count or causal interpretation. Weighted banner bases are rounded, not raw counts.
| Measure / response | Published result | Eligible audience, period and base | Source |
|---|---|---|---|
| All respondents | 27% | All US adult respondents and the specified gender, age and race/ethnicity groups; not restricted to people who have chosen family or are already estranged November 8–11, 2024 · United States · Reported unweighted/question base n=1,068; weighted banner base=1,068 | Original source [S06] Core demographics physical p.5 / 5 of 31, QS1Q1 chosen family |
F20 Same all-adult category, source-labelled male/female. All US adult respondents, not a chosen-family-holder or already-estranged subset. Source defines estrangement as not communicating due to lost closeness; chosen category includes close/family friends. No permanent-cutoff, relationship-count or causal interpretation. Weighted banner bases are rounded, not raw counts.
| Measure / response | Published result | Eligible audience, period and base | Source |
|---|---|---|---|
| Male respondents | 25% | All US adult respondents and the specified gender, age and race/ethnicity groups; not restricted to people who have chosen family or are already estranged November 8–11, 2024 · United States · Reported unweighted/question base n=495; weighted banner base=515 | Original source [S06] Core demographics p.5, Gender columns |
| Female respondents | 30% | All US adult respondents and the specified gender, age and race/ethnicity groups; not restricted to people who have chosen family or are already estranged November 8–11, 2024 · United States · Reported unweighted/question base n=562; weighted banner base=541 | Original source [S06] Core demographics p.5, Gender columns |
F21 Same source category, three cross-sectional age groups. All US adult respondents, not a chosen-family-holder or already-estranged subset. Source defines estrangement as not communicating due to lost closeness; chosen category includes close/family friends. No permanent-cutoff, relationship-count or causal interpretation. Weighted banner bases are rounded, not raw counts.
| Measure / response | Published result | Eligible audience, period and base | Source |
|---|---|---|---|
| Age 18–34 | 37% | All US adult respondents and the specified gender, age and race/ethnicity groups; not restricted to people who have chosen family or are already estranged November 8–11, 2024 · United States · Reported unweighted/question base n=315; weighted banner base=309 | Original source [S06] Core demographics p.5, Age columns |
| Age 35–54 | 32% | All US adult respondents and the specified gender, age and race/ethnicity groups; not restricted to people who have chosen family or are already estranged November 8–11, 2024 · United States · Reported unweighted/question base n=379; weighted banner base=346 | Original source [S06] Core demographics p.5, Age columns |
| Age 55+ | 16% | All US adult respondents and the specified gender, age and race/ethnicity groups; not restricted to people who have chosen family or are already estranged November 8–11, 2024 · United States · Reported unweighted/question base n=374; weighted banner base=412 | Original source [S06] Core demographics p.5, Age columns |
F22 Two broad original table labels; not separate estimates for every racial group. All US adult respondents, not a chosen-family-holder or already-estranged subset. Source defines estrangement as not communicating due to lost closeness; chosen category includes close/family friends. No permanent-cutoff, relationship-count or causal interpretation. Weighted banner bases are rounded, not raw counts.
| Measure / response | Published result | Eligible audience, period and base | Source |
|---|---|---|---|
| White only, non-Hispanic/Latino | 20% | All US adult respondents and the specified gender, age and race/ethnicity groups; not restricted to people who have chosen family or are already estranged November 8–11, 2024 · United States · Reported unweighted/question base n=714; weighted banner base=646 | Original source [S06] Core demographics p.5, Race & Ethnicity columns |
| All people of color | 38% | All US adult respondents and the specified gender, age and race/ethnicity groups; not restricted to people who have chosen family or are already estranged November 8–11, 2024 · United States · Reported unweighted/question base n=354; weighted banner base=422 | Original source [S06] Core demographics p.5, Race & Ethnicity columns |
The 27% result is therefore an all-adult percentage for that broad category. It is not a failure rate among chosen-family holders, a count of broken ties or evidence that everyone in the group wants reconciliation. For other definitions and relationship-specific results, see our family estrangement statistics.
What does the 2026 Canadian survey show?
F23 Agreement with chosen family playing an important role in one’s life. Exact agreement-category options unavailable. 2026 Ipsos Canadian survey; full n=1,000 separately recorded, valid item/weighted base unknown. Different from US forced-choice question; no country difference calculated.
| Measure / response | Published result | Eligible audience, period and base | Source |
|---|---|---|---|
| Chosen family plays an important role in my life | 77% | Canadian adults in Ipsos Future of Family survey January 23–24, 2026 · Canada · Exact valid item/subgroup n unavailable | Original source [S07] Canadian edition physical/printed p.7, left callout and source note |
The Canadian item concerns chosen family’s role in the respondent’s own life. It is different from the US forced choice between general statements. Subtracting Canada’s 77% from the US 80% would create a misleading country comparison. The selected Canadian page supplies the survey dates and full sample, but does not separately provide a valid item count, weighted base or exact agreement-category thresholds. Ipsos [S07].
What does the Indian volunteer survey show?
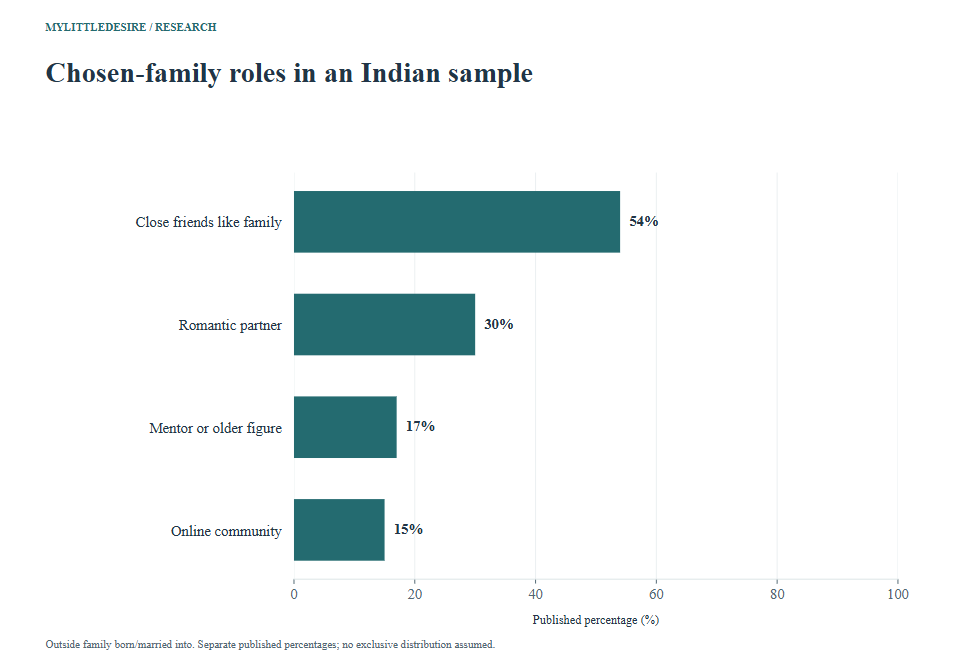
Dil, Dosti, Data 2 asks about people outside the family a respondent was born or married into. Its May 2026 WhatsApp survey is explicitly voluntary and self-selected, with predominantly young, urban and male participants. It provides a dated view of that sample rather than a national estimate for all young Indians. Youth Ki Awaaz / Rohini Nilekani Philanthropies [S08].
F24 Six Q19 response categories, kept as separately published percentages. Voluntary, self-selected May 2026 WhatsApp sample, predominantly young, urban and male; not representative of all young Indians. Q19 asks outside the family born/married into. Published categories are not an exclusive 100% distribution; selection rules not given in reproduced instrument. Valid item/subgroup n unknown; do not sum negative categories.
| Measure / response | Published result | Eligible audience, period and base | Source |
|---|---|---|---|
| Close friends who feel like family | 54% | Self-selected WhatsApp survey participants, predominantly young, urban and male; not a probability sample of all young Indians May 2026, Wave 2 · India · Exact valid item/subgroup n unavailable | Original source [S08] Report physical/printed p.23, finding 17 chart; questionnaire Q19 |
| A romantic partner | 30% | Self-selected WhatsApp survey participants, predominantly young, urban and male; not a probability sample of all young Indians May 2026, Wave 2 · India · Exact valid item/subgroup n unavailable | Original source [S08] Report physical/printed p.23, finding 17 chart; questionnaire Q19 |
| A mentor or older figure | 17% | Self-selected WhatsApp survey participants, predominantly young, urban and male; not a probability sample of all young Indians May 2026, Wave 2 · India · Exact valid item/subgroup n unavailable | Original source [S08] Report physical/printed p.23, finding 17 chart; questionnaire Q19 |
| An online community | 15% | Self-selected WhatsApp survey participants, predominantly young, urban and male; not a probability sample of all young Indians May 2026, Wave 2 · India · Exact valid item/subgroup n unavailable | Original source [S08] Report physical/printed p.23, finding 17 chart; questionnaire Q19 |
| Do not think of anyone this way | 16% | Self-selected WhatsApp survey participants, predominantly young, urban and male; not a probability sample of all young Indians May 2026, Wave 2 · India · Exact valid item/subgroup n unavailable | Original source [S08] Report physical/printed p.23, finding 17 chart; questionnaire Q19 |
| No one outside given family | 12% | Self-selected WhatsApp survey participants, predominantly young, urban and male; not a probability sample of all young Indians May 2026, Wave 2 · India · Exact valid item/subgroup n unavailable | Original source [S08] Report physical/printed p.23, finding 17 chart; questionnaire Q19 |
F25 Named a romantic partner as family outside the family born/married into. Voluntary, self-selected May 2026 WhatsApp sample, predominantly young, urban and male; not representative of all young Indians. Q19 asks outside the family born/married into. Published categories are not an exclusive 100% distribution; selection rules not given in reproduced instrument. Valid item/subgroup n unknown; do not sum negative categories.
| Measure / response | Published result | Eligible audience, period and base | Source |
|---|---|---|---|
| Women respondents | 34% | Self-selected WhatsApp survey participants, predominantly young, urban and male; not a probability sample of all young Indians May 2026, Wave 2 · India · Exact valid item/subgroup n unavailable | Original source [S08] Report physical/printed p.23, finding 17 gender paragraph |
| Men respondents | 28% | Self-selected WhatsApp survey participants, predominantly young, urban and male; not a probability sample of all young Indians May 2026, Wave 2 · India · Exact valid item/subgroup n unavailable | Original source [S08] Report physical/printed p.23, finding 17 gender paragraph |
The published chart does not form an exclusive 100% distribution, and the reproduced questionnaire does not state the selection rules. The two negative responses remain separate; we do not add them or calculate a combined chosen-family prevalence. Wave 1 is not pooled into these Wave 2 observations.
How can readers use these statistics?
For a story about who people regard as family, use an inclusion question. For a story about care, use the relevant care question and specify whether it asks about intention or experience. For a story about recognition, use the importance or recognition item. Keep the actual survey dates, population, sample design and denominator in the sentence or an adjacent source note.
For a personal conversation, these findings can prompt clearer questions about whom people rely on, what support they want and what they can offer. They do not prescribe a family structure, require replacing biological relatives or establish an ideal network size. These are discussion prompts, not interventions tested by the selected studies.
Ten reproducible descriptive comparisons
Each workbook comparison subtracts two compatible percentages within the same source measure. It uses stable observation IDs and preserves the source’s input precision. Percentage-point differences are descriptive arithmetic, not percentage changes, new significance tests or causal effects.
| ID | Comparison | First | Second | Difference | Qualification |
|---|---|---|---|---|---|
| C01 | US friend-as-family: female minus male | 51% | 48% | +3 percentage points | Same Q2 friend item; separate respondent groups. Rounded published inputs; no new significance test or interval. |
| C02 | US friend-as-family: Gen Z minus Boomers | 57% | 41% | +16 percentage points | Cross-sectional adult generations, not change with age. Rounded published inputs; no new significance test or interval. |
| C03 | US chosen-family forced choice: female minus male | 86% | 75% | +11 percentage points | Closer-statement forced choice, not percentage agreeing or having chosen family. Rounded published inputs; no new significance test or interval. |
| C04 | Would rely on chosen-family care: LGBTQI+ minus non-LGBTQI+ | 28% | 14% | +14 percentage points | Same 2022 prospective question; not actual support received. Rounded published inputs; no new significance test or interval. |
| C05 | Called on chosen family: LGBTQI+ minus non-LGBTQI+ | 51% | 36% | +15 percentage points | Same 2022 retrospective support question. Rounded published inputs; no new significance test or interval. |
| C06 | Called on by chosen family: LGBTQI+ minus non-LGBTQI+ | 58% | 46% | +12 percentage points | Same 2022 request-for-support experience; no matched reciprocity. Rounded published inputs; no new significance test or interval. |
| C07 | 2017 care needing time off: LGBT minus non-LGBT | 42.2% | 31.0% | +11.2 percentage points | One-decimal appendix values; historical ever-called question, not annual leave use. Rounded published inputs; no new significance test or interval. |
| C08 | 2017 care needing time off: disability minus no disability | 41.9% | 29.5% | +12.4 percentage points | One-decimal historical values; descriptive comparison, not a disability effect. Rounded published inputs; no new significance test or interval. |
| C09 | Australia chosen-family/friend inclusion: women minus men | 43% | 31% | +12 percentage points | Volunteer analytic sample; not a national Australian gender gap. Rounded published inputs; no new significance test or interval. |
| C10 | US chosen-family estrangement: age 18–34 minus 55+ | 37% | 16% | +21 percentage points | All-adult category bases, not rates among chosen-family holders or an aging trajectory. Rounded published inputs; no new significance test or interval. |
Common questions
What percentage of people have chosen family?
There is no single interchangeable possession rate here. Ipsos’s 49% concerns a nonrelative friend considered family, its 80% is a forced-choice opinion, and Canada’s 77% concerns chosen family’s importance in one’s own life. Other sources use care or estrangement questions.
Is chosen family the same as friendship?
These sources require an explicit family-like meaning, such as considering a friend family or relying on close friends like family. A general friendship count does not establish that every friendship is a chosen-family relationship.
Is chosen family only relevant to LGBTQIA+ people?
No. CAP’s 2022 survey reports chosen-family care responses among both LGBTQI+ and non-LGBTQI+ adults. Specific survey groups and definitions still matter; higher group percentages do not imply a universal experience.
Does chosen family replace biological family?
The selected questions do not establish universal replacement. People can recognize chosen family alongside blood or legal relatives. The studies do not support treating rejection by biological family as everyone’s reason for forming chosen family.
Can chosen-family ties become estranged?
Harris’s November 2024 all-adult survey found 27% reporting estrangement in its broad chosen-family category. The category includes close and family friends, and the result is not conditional on personally having a chosen family.
Are there comparable national results for every country?
No. The selected US and Canadian survey questions differ; the Australian convenience sample and Indian WhatsApp sample are not nationally representative. No country ranking or comparable global average is constructed.
Research method and limitations
Selection and concentration. We selected original survey tables, reports and analyses with explicit chosen-family or nonrelative-as-family wording. The database contains 71 observations in 25 groups from eight numerical source records and five publisher labels. Source contributions are S01 24, S02 5, S03 8, S04 13, S05 4, S06 8, S07 1 and S08 8. Ipsos contributes 25 across two surveys; CAP 21 across two surveys; Harris 13 across two surveys; AIFS 4; Youth Ki Awaaz/Rohini Nilekani Philanthropies 8. These observations include related categories and subgroup cells, not 71 independent studies. MyLittleDesire conducted no new survey.
Verification. Original Ipsos US crosstab physical pages 10 and 120, Harris LGBTQIA+ slide 4, CAP 2017 appendix page 6, Harris estrangement table page 5, Canadian edition page 7 and Indian report page 23 were rendered and visually checked. The US companion report confirms the 2025 fieldwork year. CAP 2022 source text and linked methods, AIFS source passages and sampling appendix, and the Indian methods/questionnaire were checked. Published aggregates were verified; confidential respondent records were not independently audited.
Bases and missing information. Thirty-seven observations have explicit reported question or unweighted banner bases; 32 also have weighted banner bases. Weighted bases are not raw respondent counts. The other 34 valid item/subgroup bases and 39 weighted bases remain blank. Full study samples and AIFS’s complete-case analytic sample are separately labelled. No raw counts are reconstructed from weighted percentages, and no full-sample error margin is assigned to subgroups.
Sampling and scope. CAP 2022 combines AmeriSpeak with a calibrated opt-in supplement. CAP 2017 describes its results as nationally representative. The AIFS and Indian samples are explicitly nonrepresentative. Recruitment or weighting details not established in the selected Ipsos/Harris records remain qualified, rather than assumed. Selected identity labels follow the original studies; LGBT, LGBTQ+, LGBTQIA+ and LGBTQI+ do not automatically mean identical populations.
Measurement and calculation limits. Inclusion, attitudes, importance, prospective care, reported care experiences and estrangement stay separate. Overlapping categories are not summed. The nested Harris importance response is identified. Ipsos forced choice is not relabelled agreement. Precise CAP 2017 appendix values replace only their rounded prose counterparts, not later survey results. Cross-sectional age/generation differences are not changes in the same people. No global mean, comparable country difference, causal effect, matched reciprocity measure, new significance test or interval is generated.
Source inconsistencies and exclusions. Conflicting AIFS overall/Indigenous comparisons are excluded. Harris’s original all-respondent estrangement table determines the denominator despite ambiguous companion wording. The Indian chart’s negative categories are not combined. General friendship, pet, household-structure and broad family-value statistics are not relabelled chosen-family possession. Historical policy discussion is not presented as current legal guidance.
Updating. The edition year is editorial. Recheck the original prompt, population, sample design, base and publication/fieldwork dates before replacing a number. Preserve older findings as historical evidence where useful. Change the review date only after a substantive review and keep the evergreen article URL.
Original sources and supporting records
- Ipsos. What the Future: Family — US survey tables, Q2 and Q11 [S01]
Published: November 2025 report; related Ipsos page dated November 27, 2025. Actual period: September 25–26, 2025.
Population: US adults 18+ in the Ipsos Future of Family survey; specified gender and generation groups.
Reported study / analytic sample: 1,305. Full survey n=1,305; selected question banners provide unweighted and weighted bases for each selected column.
Item bases: Q2/Q11 total unweighted/weighted n=1,305/1,305; male 662/635; female 641/668; Gen Z 192/230; Millennials 475/367; Gen X 331/339; Boomers 288/353. Exact selected banner bases retained per observation.
Method: Original 190-page crosstab Q2 physical p.10 and Q11 physical p.120 checked and rendered. Companion report verifies full field dates/year. Weighted percentage estimates; selected banner supplies explicit unweighted and weighted bases. Recruitment/probability details not established by the checked records; no probability-sampling claim.
Limits: Q2 asks which non-blood/non-legal relations are considered family; categories overlap. None of these is not a complete measure of lacking chosen family. Q11 is a forced choice between two statements, not an agree/disagree or chosen-family possession question. Generation groups cross-sectional. Small other-gender and Silent Generation columns excluded; no reconstructed counts or new significance tests.
Supporting record 1 · Supporting record 2 - The Harris Poll. Inclusive Insights: LGBTQIA+ & Social — chosen family [S02]
Published: October 2023. Actual period: May 26–June 1, 2023.
Population: 1,110 LGBTQIA+ adults age 18+ in the Harris online survey.
Reported study / analytic sample: 1,110. Full LGBTQIA+ survey; Q16/Q22 explicitly show n=1,110 on the selected slide.
Item bases: Reported Q16/Q22 base n=1,110 retained for five observations; weighted item bases not supplied. No inferred raw counts.
Method: Online custom survey; report physical p.2 gives field dates and sample, p.4 gives chosen-family definition, Q16 importance and Q22 agreement results. Slide rendered and visually checked because several headline numerals are vector graphics absent from extracted PDF text.
Limits: Importance, imagined aging, agreement with emotional reliance and demand for recognition are different questions. The 59% very-important response is nested within the 91% important NET. Q22 top two are strongly/somewhat agree; not an observed support receipt rate. No heterosexual comparison group or detailed probability/weighting design in the selected report; no universal LGBTQIA+ estimate or causal claim. - Center for American Progress. Paid Leave Policies Must Include Chosen Family — 2022 survey analysis [S03]
Published: March 1, 2023. Actual period: May 27–June 23, 2022.
Population: US adults 18+, separately self-identified LGBTQI+ and non-LGBTQI+ groups; narrower transgender and LGBTQI+ people-of-color groups where specified.
Reported study / analytic sample: 3,370. Combined full sample: 1,828 LGBTQI+ plus 1,542 non-LGBTQI+ adults; these group totals are not assigned as every valid support-item base.
Item bases: Exact valid support-item/subgroup n and weighted bases not supplied beside selected percentages; all eight remain blank.
Method: CAP/NORC survey using probability-recruited AmeriSpeak supplemented by Dynata nonprobability opt-in respondents and NORC TrueNorth calibration. Original care article and linked original methods checked. Prospective care question allowed multiple selections; actual experience questions separately ask calling on or being called on by chosen family.
Limits: Would rely on close friends like family is prospective, while having called on or been relied on is retrospective. Separate unpaired group reports do not establish reciprocity or a causal identity effect. Definitions and questions differ from CAP 2017, so no trend subtraction. Historical policy discussion is not treated as a current legal summary.
Supporting record 1 - Center for American Progress. People Need Paid Leave Policies That Cover Chosen Family — Appendix Figure 1 [S04]
Published: October 30, 2017. Actual period: January 2017.
Population: US residents in CAP/GfK survey, with source-labelled LGBT, disability, age, gender and current-employment groups.
Reported study / analytic sample: 1,864. Full online English-language sample: 857 LGBT and 1,007 heterosexual/cisgender respondents; not valid item n for all rows.
Item bases: Exact valid item/subgroup and weighted bases unavailable in the selected appendix. Full subgroup totals not assigned as question bases.
Method: CAP commissioned/designed a GfK SE online English survey; report describes results as nationally representative. Appendix Figure 1 physical/printed p.6 provides one-decimal percentages and exact question about ever being called on by a friend or chosen family member when help required time off work. Original PDF rendered and visually checked.
Limits: Question concerns an ever-reported call for help and need for time off; not annual prevalence, paid-leave entitlement or verified completed leave use. Source prose rounds appendix values; precise appendix inputs retained. Age/employment groups are current classifications, not necessarily status when the event happened. No causal effect, new significance test or current 2027 claim.
Supporting record 1 - Australian Institute of Family Studies. What is family? Australian views on what makes a family [S05]
Published: Web page published December 7, 2023; report labelled October 2023. Actual period: November 4–December 13, 2021.
Population: Convenience-sample Families in Australia respondents in the report’s complete-case analytic sample; specified gender and LGBTQ+ groups.
Reported study / analytic sample: 4,436. Complete-case analytic sample 4,436 selected from almost 6,000 survey participants; not a representative Australian population sample.
Item bases: Selected valid question/subgroup n unavailable beside the four chosen-family percentages; analytic sample and demographic counts are not substituted as item bases.
Method: Fourth Families in Australia online volunteer survey. Original report body and Appendix A checked: not population-representative; men only 12% of analytic sample. Selected body passages compare inclusion of chosen family or close friends by gender and LGBTQ+ status.
Limits: Inclusion of chosen family OR close friends is a combined category. Participant-group results are not rates for all Australians. Overall chosen-family figure is 41% in key messages but 42% in Figure 2/discussion; non-Indigenous comparison also differs 42/41. Conflicting overall/Indigenous figures excluded rather than silently corrected. Pet-inclusive categories and general values ratings not relabelled chosen-family prevalence.
Supporting record 1 - The Harris Poll. Family Estrangement — Core Demographic Profile, QS1Q1 chosen-family table [S06]
Published: November 2024 tables; companion article November 22, 2024. Actual period: November 8–11, 2024.
Population: All US adult respondents and the specified gender, age and race/ethnicity groups; not restricted to people who have chosen family or are already estranged.
Reported study / analytic sample: 1,068. Full online survey n=1,068; selected table physical p.5 supplies unweighted and weighted column bases.
Item bases: Exact unweighted/weighted bases: all 1068/1068; male 495/515; female 562/541; age18–34 315/309,35–54 379/346,55+ 374/412; White only non-Hispanic/Latino 714/646; all people of color 354/422. Reported weighted bases rounded, not raw respondent counts.
Method: Weighted online survey of US adults 18+; original crosstab p.5 QS1Q1 has table base US RESPONDENTS. Question defines estrangement as not communicating due to loss of closeness and includes close friends/family friends not directly related in its chosen-family category. Original table rendered and visually checked; companion article supplies field dates/weighting.
Limits: All-adult prevalence of the source’s broad chosen-family estrangement category, not prevalence among chosen-family holders or a tie-level failure rate. Companion prose says “of those” but original table base is all respondents; table denominator used. Categories of relative types can overlap. No assumed permanent cutoff, reconciliation need or causal age/race difference.
Supporting record 1 - Ipsos. What the Future: Family — Canadian Edition, chosen-family role [S07]
Published: February 2026 PDF edition; exact publication day not established. Actual period: January 23–24, 2026.
Population: Canadian adults in Ipsos Future of Family survey.
Reported study / analytic sample: 1,000. Full survey of 1,000 Canadian adults; source states 54% parents, which is sample context, not an added chosen-family statistic.
Item bases: Full source n=1,000 is given in the chart footnote; exact valid item and weighted base are not separately reported and remain blank.
Method: Original Canadian edition physical/printed p.7 gives 77% agreement that chosen family plays an important role in the respondent’s life, plus field dates and full sample. Page rendered and visually checked. Detailed recruitment, weighting and agreement-category thresholds not established from the selected record.
Limits: Agreement with importance in one’s life, not a count of network members or an observed caregiving rate. Not the same question as US forced-choice 80%; no US–Canada difference or ranking. Broader unsourced narrative figures from other pages not adopted. - Youth Ki Awaaz / Rohini Nilekani Philanthropies. Dil, Dosti, Data 2 — Loneliness and Reaching Out, chosen family [S08]
Published: July 21, 2026 publisher page. Actual period: May 2026, Wave 2.
Population: Self-selected WhatsApp survey participants, predominantly young, urban and male; not a probability sample of all young Indians.
Reported study / analytic sample: 3,072. Wave 2 total 3,072 voluntary respondents; Wave 1 not pooled, and selected question/subgroup bases are not separately supplied.
Item bases: Exact Q19 valid response/subgroup n and weighted bases unavailable; full wave sample not assigned as each item n.
Method: Yoot/Youth Ki Awaaz voluntary WhatsApp polling. Original report explicitly calls sample self-selected and nonprobabilistic. About six in ten are 18–24, over seven in ten urban and about three-quarters male. Physical/printed p.23 chosen-family question and gender contrast checked and rendered; questionnaire Q19 and methods checked.
Limits: Selected roles are people outside the family one was born or married into. Published category percentages are not an exclusive 100% distribution; selection rules not specified in the reproduced questionnaire. Do not add negative categories or infer a missing combined prevalence. Report-wide prose about 3-point uncertainty is not adopted as a design-based margin for this volunteer sample. No national benchmark, trend, causal buffering effect or regression result inferred.
Supporting record 1
Companion methods and report records add context without adding duplicate numerical observations. The downloadable source audit records the selected values and verification limits.
How to cite this resource
MyLittleDesire. Chosen Family Statistics 2027. https://mylittledesire.com/chosen-family-statistics/.