Ghosting can mean ending a dating relationship without explanation, cutting off a friendship, or leaving a message unanswered in a way that feels like an ending. Research uses each of these definitions. A useful statistic needs its question, population and time period beside the number.
50 grouped, source-linked findings from 10 original-source publications and analyses, four MyLittleDesire chart designs and 20 reproducible comparisons. Related response categories stay grouped. A percentage, mean intention rating and coded narrative count answer different questions.
What are the key ghosting statistics?
29%
42% / 14%
US adults reporting lifetime dating ghosting in October 2019. Pew Research Center / Ipsos [S01].
Receipt among ages 18–29 / 65+ in that survey; a cross-sectional 28-point gap. Pew Research Center / Ipsos [S01].
53% / 19%
8%
Receipt among people with / without online-dating experience; not proof of where events happened. Pew Research Center / Ipsos [S01].
Single-and-looking adults saying they would ignore further contact after an unwanted first date; hypothetical intentions. Pew Research Center / Ipsos [S01].
24%
25% / 19%
US adults reporting receipt in December 2022 fieldwork, published in 2023. Survey Center on American Life / American Enterprise Institute; Ipsos [S02].
Adults selecting ghosting by a friend / someone dated in October 2021; overlapping categories. YouGov US [S04].
38.6% / 23.0%
30 + 15
Friendship / romantic receipt in one selected US-resident academic sample, published in 2019. Freedman, Powell, Le and Williams; Dartmouth, Roanoke, Haverford and Purdue [S05].
People in ghosting-only and combined repeated profiles, giving a calculated inclusive 7.2% of 626 (C09). Navarro, Larrañaga, Yubero and Víllora; Universidad de Castilla-La Mancha [S06].
6.03 / 10
2.45 / 2.81
Mean painfulness among 207 selected mobile daters answering that retrospective rating. Timmermans, Hermans and Opree; Erasmus University Rotterdam [S07].
Needs-satisfaction means after ghosting / direct-rejection recall on a 1–7 scale. Leckfor, Wood, Slatcher and Hales; University of Georgia and University of Mississippi [S08].
3.23 / 1.94
p = 0.357
Imagined ghoster feelings / another perspective’s prediction, on a 1–5 scale; 2025 scenarios published in 2026. Li, Zheng and Schroeder; University of California Berkeley and University of Cambridge [S09].
The 2026 paper’s overall primary live-chat feeling comparison was nonsignificant; subgroup findings do not replace it. Li, Zheng and Schroeder; University of California Berkeley and University of Cambridge [S09].
What does a ghosting statistic actually measure?
Compare numbers only when the definition, relationship and recall period match. One unanswered message is not automatically a verified relationship ending. Some papers study broader perceived nonresponse, including relationships that later continue.
| Measure | What it describes | Comparison rule |
|---|---|---|
| Lifetime dating receipt | A person’s report of ever being ghosted | Not the percentage of dates, partners or conversations ending this way. |
| Initiation | A report of one’s own conduct | Initiators can also be recipients; marginal rates do not identify overlap. |
| Repeated past-year experience | Whether a frequency threshold was reached | Three or more differs from once; an exclusive profile can omit a combined group. |
| Attitudes and intentions | Approval or a likelihood rating | Mean ratings/stated percentages are not observed behavior prevalence. |
| Coded narratives | Themes in open responses | Multiple themes can apply to one account; valid item bases can differ. |
| Recall or live-chat outcomes | Responses in selected or arranged settings | Different from population clinical outcomes or long-term effects. |
| Breadcrumbing, orbiting and hiring ghosting | Related communication practices | Do not pool intermittent contact, social-media observation and professional nonresponse into one dating rate. |
How common is ghosting in US population surveys?
Pew found lifetime dating-ghosting receipt among 29% of US adults in October 2019. The question described someone they had gone out with suddenly not answering calls or messages without explanation.
Related: online dating statistics; friendship statistics; breakup statistics.
| ID | Finding and qualification | Population, actual period and base | Original source and locator |
|---|---|---|---|
| F01 | In the 2019 survey, 29% of US adults said someone they had gone out with had suddenly stopped answering calls or messages without explanation. | US adults aged 18+; first-date intention items restricted to single-and-looking respondents 2019-10-16 to 2019-10-28; lifetime reports and hypothetical intentions as labeled Overall 4,860; first-date intention base 1,123; subgroup counts not supplied beside every estimate | Original source [S01] Report printed pp.33–34 / physical pp.34–35; topline physical p.12, DATEGHOST. |
| F02 | Reported ghosting experience was 42% at ages 18–29, 37% at 30–49, 21% at 50–64 and 14% at 65+. Age groups are cross-sectional; they do not show individual aging effects or a 2027 Gen Z rate. | US adults aged 18+; first-date intention items restricted to single-and-looking respondents 2019-10-16 to 2019-10-28; lifetime reports and hypothetical intentions as labeled Overall 4,860; first-date intention base 1,123; subgroup counts not supplied beside every estimate | Original source [S01] Report printed pp.33–34; personal-experiences chapter, ghosting subsection. |
| F03 | Receipt was reported by 53% of adults who had ever used online dating versus 19% who had never used it; the figure was 62% among current online daters. These groups differ in exposure and selection. The survey does not establish that app use caused ghosting or that every event happened online. | US adults aged 18+; first-date intention items restricted to single-and-looking respondents 2019-10-16 to 2019-10-28; lifetime reports and hypothetical intentions as labeled Overall 4,860; first-date intention base 1,123; subgroup counts not supplied beside every estimate | Original source [S01] Report printed p.34 / physical p.35; personal-experiences ghosting subsection. |
| F04 | The reported receipt figures were 29% for men and 30% for women. Pew describes men and women as equally likely to report this experience; a one-point estimate difference is not a demonstrated population difference. | US adults aged 18+; first-date intention items restricted to single-and-looking respondents 2019-10-16 to 2019-10-28; lifetime reports and hypothetical intentions as labeled Overall 4,860; first-date intention base 1,123; subgroup counts not supplied beside every estimate | Original source [S01] Report printed p.34; personal-experiences ghosting subsection. |
| F05 | Sixty-two percent had heard of the term ghosting; 9% had heard of breadcrumbing. Term awareness is different from having experienced a behavior; breadcrumbing involves intermittent contact rather than complete unexplained withdrawal. | US adults aged 18+; first-date intention items restricted to single-and-looking respondents 2019-10-16 to 2019-10-28; lifetime reports and hypothetical intentions as labeled Overall 4,860; first-date intention base 1,123; subgroup counts not supplied beside every estimate | Original source [S01] Topline physical p.12, DATEVOCAB a–b. |
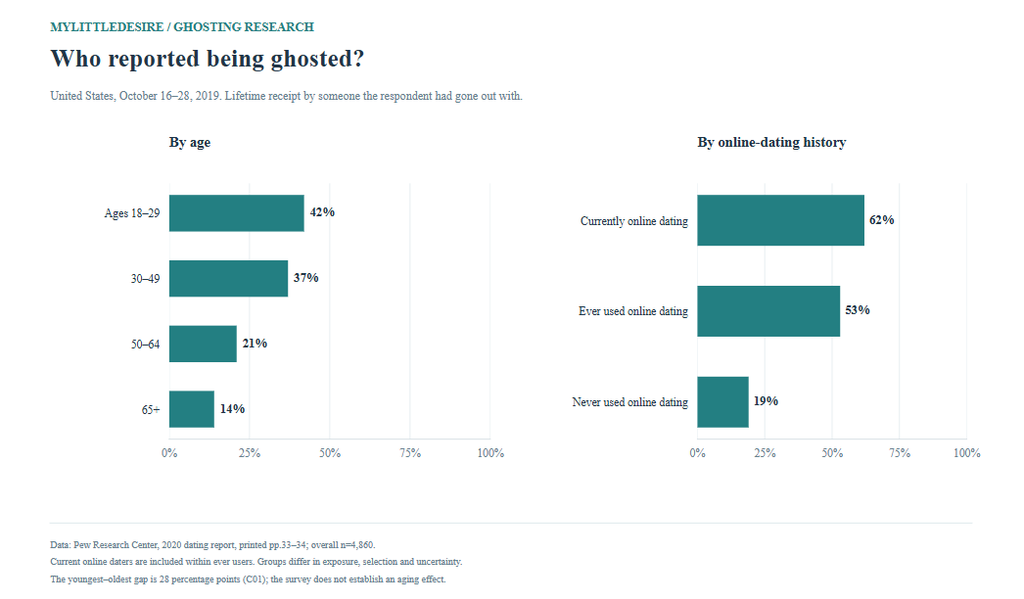
The youngest–oldest gap is 28 percentage points, or a raw ratio of 3.00 from rounded estimates (C01–C02). Ever-online versus never-online receipt differs by 34 points; current-online versus never-online by 43 points (C03–C04). Exposure, selection and reporting differ. These are not causal effects of apps or aging.
What did the later US probability-panel survey find?
A separate report published in 2023 found 24% overall receipt using December 2022 fieldwork. Its January 2023 survey branding is different from the interviewing period recorded in its methods and questionnaire.
| ID | Finding and qualification | Population, actual period and base | Original source and locator |
|---|---|---|---|
| F09 | Twenty-four percent of all adults and 29% of currently single adults reported having been ghosted by someone they were dating. Current single status is not the same eligibility as single-and-looking; this is not a continuation of Pew’s survey. | US adults aged 18+; current-single and generation subgroups as labeled 2022-12-09 to 2022-12-18; survey branded January 2023; lifetime dating experience Survey overall 5,055; exact Q22C valid/unweighted subgroup bases are not separately printed beside these estimates | Original source [S02] Report Ghosting subsection; topline physical p.10, Q22C (24% yes, 74% no, 2% refused). |
| F10 | The reported lifetime-receipt figures were 26% for women and 23% for men. The source describes men and women as about equally likely; do not turn the point difference into a proven gender effect. | US adults aged 18+; current-single and generation subgroups as labeled 2022-12-09 to 2022-12-18; survey branded January 2023; lifetime dating experience Survey overall 5,055; exact Q22C valid/unweighted subgroup bases are not separately printed beside these estimates | Original source [S02] Report Ghosting subsection. |
| F11 | The report’s millennial group had a 34% lifetime-receipt figure, compared with 21% in its adult Gen Z group. Cohorts have unequal time at risk and dating histories. This is not evidence that Gen Z in 2027 ghosts less, or that cohort membership causes receipt. | US adults aged 18+; current-single and generation subgroups as labeled 2022-12-09 to 2022-12-18; survey branded January 2023; lifetime dating experience Survey overall 5,055; exact Q22C valid/unweighted subgroup bases are not separately printed beside these estimates | Original source [S02] Report Ghosting subsection. |
The source’s millennial–adult-Gen-Z difference is 13 points (C05), with unequal lifetime exposure and source-specific cohort labels. It is not a measurement of teenagers or Gen Z in 2027. Pew’s 29% and this survey’s 24% do not establish a five-point decline: they are different questions and surveys, rather than a consistent time series.
See the wider app-use context in our online dating statistics resource.
Would people ghost after a first date?
Eight percent of Pew’s single-and-looking respondents said they would ignore further contact after deciding against a second date. The more common choices were to decline proactively or explain if contacted. Waiting to be contacted and then replying is different from ignoring the person.
| ID | Finding and qualification | Population, actual period and base | Original source and locator |
|---|---|---|---|
| F06 | After an unwanted first date, 8% of single-and-looking adults said they would ignore further contact, 40% would proactively decline and 52% would explain only if contacted. Hypothetical intended action after one date, not a measured percentage who ever ghosted. Waiting to be contacted but then replying is not the ignore-contact category. | US single-and-looking adults seeking relationships and/or dates 2019-10-16 to 2019-10-28; lifetime reports and hypothetical intentions as labeled 1,123; gender/age subgroup bases not separately verified | Original source [S01] Public-attitudes chapter, first-date subsection; topline physical p.7, BREAKUP. |
| F07 | Single-and-looking men were more likely than women to say they would proactively decline another date: 47% versus 30%. Women more often said they would explain only if contacted: 59% versus 47% of men. Response strategies, not observed honesty or gender-specific ghosting prevalence. | US single-and-looking men/women 2019-10-16 to 2019-10-28; lifetime reports and hypothetical intentions as labeled First-date item 1,123 overall; subgroup bases unavailable | Original source [S01] Public-attitudes chapter, first-date subsection. |
| F08 | Proactive refusal after a first date was selected by 49% of single-and-looking adults aged 18–29, 37% at 30–49 and 34% at 50+. Hypothetical intentions; age bands differ from the lifetime-experience question. | US single-and-looking adults in the named age groups 2019-10-16 to 2019-10-28; lifetime reports and hypothetical intentions as labeled First-date item 1,123 overall; subgroup bases unavailable | Original source [S01] Public-attitudes chapter, first-date subsection. |
Hypothetical intentions after one date cannot be compared directly with all-adult lifetime receipt as proof of dishonesty. The roles, populations, time windows and opportunities differ. Intentions also need not predict later conduct.
What does the historical YouGov dating poll show?
The October 2014 poll reported 13% receipt and 11% initiation. Its original tables supply item-specific unweighted counts and age/gender detail.
| ID | Finding and qualification | Population, actual period and base | Original source and locator |
|---|---|---|---|
| F12 | Thirteen percent said they had been ghosted by someone they were dating; 11% said they had ghosted someone they were dating. Receipt and initiation can overlap; they cannot be added to count distinct people. | US adults; demographic estimates as labeled 2014-10-23 to 2014-10-26; lifetime dating receipt and initiation Overall survey 1,000; receipt item unweighted n=990; initiation item n=986; exact age/gender bases in original tables | Original source [S03] Original tables physical pp.4–5, questions 4–5. |
| F13 | Receipt was 11% among men and 15% among women; initiation was 11% among men and 10% among women. Do not claim a universal gender ranking from rounded subgroup estimates. | US adults; demographic estimates as labeled 2014-10-23 to 2014-10-26; lifetime dating receipt and initiation Receipt n=990 (476 men, 514 women); initiation n=986 (476 men, 510 women) | Original source [S03] Original tables physical pp.4–5, gender columns. |
| F14 | Receipt by age was 18% at 18–29, 17% at 30–44, 9% at 45–64 and 11% at 65+. These age bands differ from Pew’s; the polls cannot establish a clean time trend. | US adults; demographic estimates as labeled 2014-10-23 to 2014-10-26; lifetime dating receipt and initiation Unweighted age bases: 176, 267, 379 and 168 respectively; item total 990 | Original source [S03] Original tables physical p.4, age columns. |
| F15 | Initiation by age was 16% at 18–29, 12% at 30–44, 7% at 45–64 and 11% at 65+. Reports of one’s own conduct differ from reports about another person. | US adults; demographic estimates as labeled 2014-10-23 to 2014-10-26; lifetime dating receipt and initiation Unweighted age bases: 174, 267, 379 and 166 respectively; item total 986 | Original source [S03] Original tables physical p.5, age columns. |
These are dated poll results, rather than a 2027 baseline. Age bands differ from Pew’s, and an overall margin cannot be applied unchanged to every subgroup. Receipt and initiation may describe some of the same people.
How does friendship ghosting compare with dating ghosting?
A multi-response daily question found more people selecting receipt from friends than from someone dated. Its question and recruitment differ from a dating-only population survey.
| ID | Finding and qualification | Population, actual period and base | Original source and locator |
|---|---|---|---|
| F16 | Twenty-five percent selected having been ghosted by a friend, 19% by someone they dated and 12% by a family member; 46% selected no and 12% did not know. Select-all-that-apply item: the three relationship categories are not mutually exclusive. Family cutoff is not automatically identical to long-term family estrangement. | US adults answering an opt-in daily question 2021-10-21; lifetime, multiple relationship contexts 7,180 US adults; subgroup/weighted-effective bases not independently verified | Original source [S04] Original daily-result question and All adults answers. |
The friend–dating gap is six points (C06). Adding the relationship categories would overcount recipients because multiple answers were allowed. Family cutoff is not automatically identical to the duration and definitions used in family-estrangement research.
What do academic samples show about friendship and romantic contexts?
In Freedman and colleagues’ Study 2, friendship receipt exceeded romantic receipt within the same selected sample. The paper also measured initiation, attitudes and intentions.
| ID | Finding and qualification | Population, actual period and base | Original source and locator |
|---|---|---|---|
| F17 | In Study 1, 25.3% reported having been ghosted by a romantic partner and 21.7% reported ghosting a romantic partner. Counts were 140 and 120; the two groups may overlap. | Convenience online samples: MTurk Study 1 and US-resident Prolific Study 2 Exact calendar field dates unavailable in the checked paper; data precede 2018 online publication 554 MTurk participants; not a probability sample | Original source [S05] Author PDF physical pp.6–7 / journal pp.910–911, Results and Table 1. |
| F18 | In Study 2, 23.0% reported romantic receipt and 18.9% romantic initiation. Counts were 172 and 141; this is not the percentage of partners or dates who were ghosted. | Convenience online samples: MTurk Study 1 and US-resident Prolific Study 2 Exact calendar field dates unavailable in the checked paper; data precede 2018 online publication 747 US-resident Prolific participants | Original source [S05] Author PDF physical pp.7 and 11, Table 1 / Results. |
| F19 | In the same Study 2 sample, 38.6% reported having been ghosted by a friend and 31.7% reported ghosting a friend. Friendship and romantic histories overlap; differences compare reports within one sample, not population-level causal risks. | Convenience online samples: MTurk Study 1 and US-resident Prolific Study 2 Exact calendar field dates unavailable in the checked paper; data precede 2018 online publication 747 US-resident Prolific participants | Original source [S05] Author PDF physical pp.7 and 13; Table 1 and Friendships results. |
| F20 | In Study 1, 19.5% endorsed ghosting as acceptable for ending a short-term romantic relationship, compared with 4.7% for a long-term one. Binary/check-all endorsement differs from the later study’s mean rating. These are attitudes, not actions. | Convenience online samples: MTurk Study 1 and US-resident Prolific Study 2 Exact calendar field dates unavailable in the checked paper; data precede 2018 online publication 554 MTurk participants | Original source [S05] Author PDF physical pp.6–7, dichotomous measures and Table 1. |
| F21 | Study 1 found 20.6% endorsed ghosting as acceptable only before physical intimacy; 6.5% endorsed acceptability after physical intimacy. These are separately endorsed statements, not complementary groups or an experiment assigning intimacy. | Convenience online samples: MTurk Study 1 and US-resident Prolific Study 2 Exact calendar field dates unavailable in the checked paper; data precede 2018 online publication 554 MTurk participants | Original source [S05] Author PDF physical pp.6–7, item wording and Table 1. |
| F22 | Study 2’s mean intention ratings were 2.86 for short-term and 1.65 for long-term romance, versus 3.35 and 1.88 for friendships. Mean likelihood ratings, not percentages planning to ghost. | Convenience online samples: MTurk Study 1 and US-resident Prolific Study 2 Exact calendar field dates unavailable in the checked paper; data precede 2018 online publication 747 US-resident Prolific participants | Original source [S05] Author PDF physical pp.7 and 11, Table 1 and Measures. |
| F23 | Agreement with thinking poorly of a ghoster averaged 5.27 for romantic relationships and 4.96 for friendships in Study 2. Attitude ratings do not diagnose a person’s character or establish future behavior. | Convenience online samples: MTurk Study 1 and US-resident Prolific Study 2 Exact calendar field dates unavailable in the checked paper; data precede 2018 online publication 747 US-resident Prolific participants | Original source [S05] Author PDF physical pp.7 and 14; Table 1 and exploratory context comparison. |
| F24 | Term familiarity was 45.3% in Study 1 and 64.1% in Study 2. These are different recruited samples and procedures, not measured growth in awareness over time. | Convenience online samples: MTurk Study 1 and US-resident Prolific Study 2 Exact calendar field dates unavailable in the checked paper; data precede 2018 online publication Study 1: 554; Study 2: 747 | Original source [S05] Author PDF physical pp.5 and 10, Procedures. |
The Study 2 friendship–romance gaps are 15.6 points for receipt and 12.8 for initiation (C07–C08). Neither reveals which people had both experiences. Study 1’s binary endorsements and Study 2’s mean ratings are different metrics. The intimacy statements were separately endorsed judgments, not complementary groups or an experiment. Different sample familiarity rates are not a measured time trend.
Our friendship statistics hub covers friendship quantity, quality and contact.
How do repeated experiences and overlapping groups change the answer?
Navarro and colleagues used a restrictive prior-year threshold: at least three experiences. Their table separates ghosting-only, breadcrumbing-only, both and neither repeated profile.
| ID | Finding and qualification | Population, actual period and base | Original source and locator |
|---|---|---|---|
| F25 | Using the paper’s restrictive thresholds, 30 people (4.8%) were in the ghosting-only profile, 88 (14.1%) breadcrumbing-only, 15 (2.4%) both and 493 (78.8%) neither profile. The 4.8% excludes the combined group. Rounded percentages sum to 100.1%. The inclusive repeated-ghosting total is a separate MyLittleDesire calculation, not an additional published finding. | Adults aged 18–40 with at least one prior short- or long-term relationship Spain 2019; experiences during the preceding 12 months 626 participants; 303 men, 323 women; group counts 30/88/15/493 | Original source [S06] Original Results 3.1 and Table 1; group definitions require three or more times in the last year. |
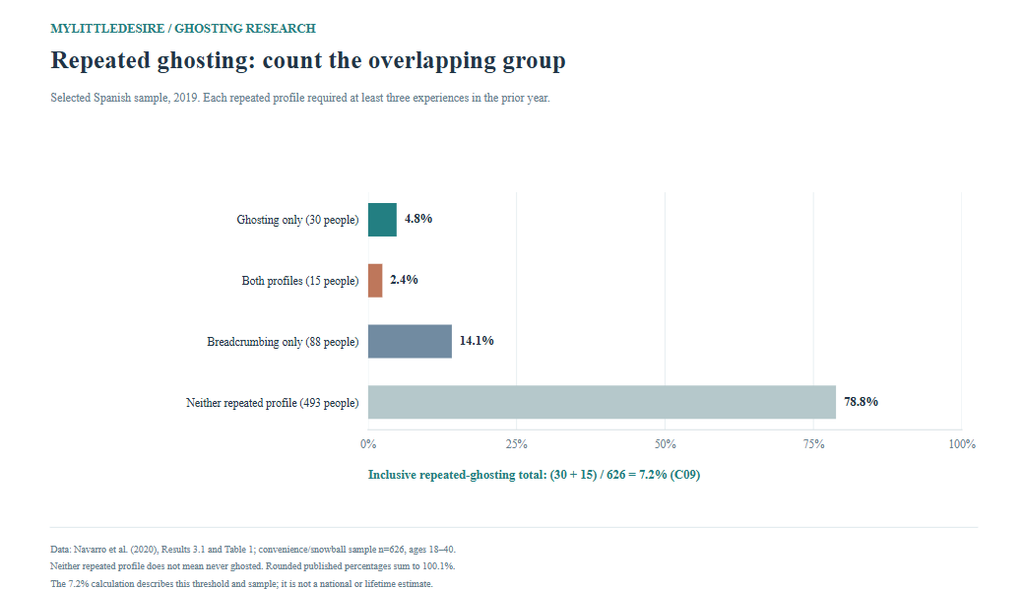
The 4.8% covers the 30-person ghosting-only profile. Another 15 people meet both repeated profiles. Adding the counts gives 45 of 626, or 7.2% (C09). The combined group is 33.3% of that derived 45-person total (C10). This makes the denominator explicit; it is not another survey. Neither repeated profile does not mean never ghosted. Do not equate this selected Spanish past-year classification with US all-adult lifetime receipt.
What do selected dating-app users report?
A mixed-methods study recruited Dutch-speaking mobile daters through Belgian and Dutch media and social channels. It helps describe selected experiences, interpretations and reported motives, rather than estimating a national app-user rate.
| ID | Finding and qualification | Population, actual period and base | Original source and locator |
|---|---|---|---|
| F26 | The paper reports that 279 of 328 selected dating-app users, approximately 85%, had been on the receiving end of ghosting. Recruitment explicitly sought app users willing to share ghosting experiences; do not label this an 85% national or universal app-user rate. | Self-selected mobile dating-app users; thematic follow-up bases differ Exact calendar field period not reported in checked methods; data collected before 2019/2020 conference presentations 328 app users; ghostee narratives n=217; ghoster narratives n=142; painfulness n=207 | Original source [S07] Methods, ghostee question; original repository PDF physical p.6 / journal p.788. |
| F27 | The mean painfulness rating was 6.03 on a 0–10 scale, with SD 2.67. A subjective retrospective rating; not a clinical diagnosis or a share of people in pain. | Self-selected mobile dating-app users; thematic follow-up bases differ Exact calendar field period not reported in checked methods; data collected before 2019/2020 conference presentations 207 respondents answering painfulness | Original source [S07] Measures, Painfulness subsection. |
| F28 | Among 217 ghostee narratives, 128 (59%) blamed the other person, 80 (37%) blamed themselves and 37 (17%) referred to app features. Themes overlap and describe recipients’ interpretations, not verified motives of the people who stopped responding. | Self-selected mobile dating-app users; thematic follow-up bases differ Exact calendar field period not reported in checked methods; data collected before 2019/2020 conference presentations 217 ghostee narratives | Original source [S07] Results RQ1, ghostees’ explanations. |
Recipients’ explanations are perceptions of someone else’s motives. Self-blame is not confirmation that the recipient caused the nonresponse. More than one theme could appear in an account.
Why did respondents say they ghosted?
Ghoster narratives included several overlapping explanations, including reported safety concerns. Those accounts do not establish every ghoster’s motives.
| ID | Finding and qualification | Population, actual period and base | Original source and locator |
|---|---|---|---|
| F29 | Among 142 ghoster narratives, the published themes included other-person-related reasons in 95 (67%), self-related reasons in 62 (44%), app features in 41 (29%), no obligation to communicate in 31 (22%) and concern for the other person in 23 (16%). Overlapping codes in self-selected narratives; these are not an exhaustive nationally ranked list of motives. | Self-selected mobile dating-app users; thematic follow-up bases differ Exact calendar field period not reported in checked methods; data collected before 2019/2020 conference presentations 142 ghoster narratives | Original source [S07] Results RQ1, five ghoster themes. |
| F30 | Twenty-six ghoster narratives mentioned fear of verbal abuse or stalking as a reason to avoid direct rejection. Reported safety concerns were not independently adjudicated. This count does not show every ghoster’s motive or require anyone to maintain unwanted contact. | Self-selected mobile dating-app users; thematic follow-up bases differ Exact calendar field period not reported in checked methods; data collected before 2019/2020 conference presentations 142 ghoster narratives; overlapping subthemes | Original source [S07] Results RQ1, Blaming self (ghoster), protection subtheme. |
The thematic bases differ from the full app-user sample. Safety concerns were reported rather than independently adjudicated. These statistics do not require anyone to maintain unwanted contact.
What did respondents describe doing and feeling afterward?
The source reports coded accounts, not evidence that a particular coping response works. Counts stay in their original form where exact valid item bases are unavailable.
| ID | Finding and qualification | Population, actual period and base | Original source and locator |
|---|---|---|---|
| F31 | Reported coping themes included rationalizing the experience in 52 accounts, needing closure in 46 and attempting contact again in 33. Item-specific valid narrative bases are not fully printed; keep counts rather than inventing percentages. These are descriptions, not evidence that a coping strategy works. | Self-selected mobile dating-app users; thematic follow-up bases differ Exact calendar field period not reported in checked methods; data collected before 2019/2020 conference presentations Ghostee follow-up narratives; exact valid base for each coping code not separately specified | Original source [S07] Results RQ2, coping paragraphs. |
| F32 | The coded emotional accounts included 86 mentions of sadness or hurt, 65 of anger, 48 of disappointment and 28 explicitly describing little or no emotional response. Multiple emotions could occur in one account. No population percentage or independent clinical outcome is inferred. | Self-selected mobile dating-app users; thematic follow-up bases differ Exact calendar field period not reported in checked methods; data collected before 2019/2020 conference presentations Ghostee emotional-response narratives; exact valid item base not separately specified | Original source [S07] Results RQ2, emotional responses. |
Multiple emotions or coping themes can occur in one account. Some initiation and model-level results were excluded because their reported denominators could not be reconciled. Separately documented descriptive and thematic results remain qualified.
What do closure and recall experiments show?
One three-study project found high reported exposure in selected young-adult samples, inconsistent small closure–intention associations and lower needs satisfaction after ghosting recall. These are distinct findings, rather than a universal personality profile.
| ID | Finding and qualification | Population, actual period and base | Original source and locator |
|---|---|---|---|
| F33 | Study 1 reported initiation in 62.90% and receipt in 66.00%; Study 2 reported 66.20% and 70.60%, respectively. The separate initiation and receipt figures do not identify how many had both roles. Do not generalize these selected young-adult samples to all US adults. | US emerging adults aged 18–29 recruited through Prolific; retrospective and hypothetical measures Exact calendar field dates not independently established; all studies predate 2023 publication Study 1: 553; Study 2: 411 | Original source [S08] Author PDF physical pp.7 and 9 / journal pp.2428 and 2430. |
| F34 | Need for closure correlated with ghosting intentions at r=0.14 in Study 1 (95% CI 0.06–0.23), while Study 2 reported r=0.06 with a nonsignificant preregistered one-tailed test (p=0.113). Small, inconsistent associations are not a universal profile of ghosters and do not establish causation. | US emerging adults aged 18–29 recruited through Prolific; retrospective and hypothetical measures Exact calendar field dates not independently established; all studies predate 2023 publication Study 1: 553; Study 2: 411 | Original source [S08] Author PDF physical pp.8 and 10, Results. |
| F35 | In Study 2, direct-rejection intention averaged 4.57, compared with 2.86 for ghosting, on 1–7 scales. Means across 19 scenarios, not percentages selecting one route. The comparison was exploratory. | US emerging adults aged 18–29 recruited through Prolific; retrospective and hypothetical measures Exact calendar field dates not independently established; all studies predate 2023 publication 411 | Original source [S08] Author PDF physical p.10 / journal p.2431. |
| F36 | Study 3 reported needs-satisfaction means of 2.45 after recalling ghosting, 2.81 after direct rejection and 5.90 after inclusion. Randomization concerned recall prompts, not actual rejection experiences or long-term mental health. Rounded mean differences can differ from model coefficients. | US emerging adults aged 18–29 recruited through Prolific; retrospective and hypothetical measures Exact calendar field dates not independently established; all studies predate 2023 publication Ghosting recall 183; direct rejection 172; inclusion 190; total 545 | Original source [S08] Author PDF physical pp.11–12 / journal pp.2432–2433. |
| F37 | Across Study 3 recall prompts, 49% wrote about a friendship, 29% a romantic relationship and 22% a casual dating situation. These are the contexts of all recalled inclusion/rejection/ghosting events, not the proportion of ghosting victims harmed by each relationship type. | US emerging adults aged 18–29 recruited through Prolific; retrospective and hypothetical measures Exact calendar field dates not independently established; all studies predate 2023 publication 545 across all three recall conditions | Original source [S08] Author PDF physical p.12, Experimental manipulation. |
Direct-rejection intention exceeded ghosting intention by 1.71 points on a seven-point scale (C11). The rounded needs-satisfaction means differ by 0.36 points (C12); the source’s model coefficient of 0.37 uses underlying values, so the small difference is not an arithmetic error. Study 3 assigned recall prompts, not actual life rejection. Its mix of all-condition memories is not the relationship-type distribution of all ghosting.
Our breakup statistics resource covers the broader evidence on relationship endings.
What does research published in 2026 add about ghosters’ feelings?
The 2026 paper distinguishes actual self-reports, imagined feelings and another person’s predictions. Collection began in 2023, 2025 and 2024 for its three studies, respectively; publication year does not establish fieldwork year.
| ID | Finding and qualification | Population, actual period and base | Original source and locator |
|---|---|---|---|
| F38 | In the recall study, ghosters’ mean bad-feelings rating was 2.27; ghostees predicted 1.56. The reported standardized difference was d=0.77 (95% CI 0.51–1.06). The role groups recalled separate events; these are not matched former partners. | Recalled nonresponse episodes, imagined friend-message scenarios and an incentivized live chat task Study 1: data collection began 2023-02-02; end date not verified 195: 101 recalled ghosters and 94 recalled ghostees | Original source [S09] Publisher Table 1 and Study 1 Results; author PDF physical pp.10 and 16. |
| F39 | Among recall respondents who perceived the nonresponse as unintentional, ghosters’ mean was 2.62 and ghostees’ prediction was 1.50. Intentionality is each respondent’s perception; this selected, unmatched subgroup does not identify any particular person’s motive. | Recalled nonresponse episodes, imagined friend-message scenarios and an incentivized live chat task Study 1: collection began 2023-02-02; end date not verified 84: 34 ghosters and 50 ghostees rating intentionality below scale midpoint | Original source [S09] Publisher Table 1, Study 1 unintentional subgroup; author PDF physical p.10. |
| F40 | Eighty percent of the recalled nonresponse episodes did not end the relationship. This uses the paper’s broad nonresponse definition. It is not evidence that 80% of romantic breakups reverse, or a universal recovery rate. | Recalled nonresponse episodes, imagined friend-message scenarios and an incentivized live chat task Study 1: collection began 2023-02-02; end date not verified 195 recall respondents; exact valid item base not separately printed | Original source [S09] Study 1 Other measures; publisher text and author PDF physical p.15. |
| F41 | In those recalled episodes, 28.72% reported a follow-up message; the median time since the ghostee’s last message was 10 days. Elapsed time is descriptive of selected recollections. It does not define ghosting, prescribe a waiting period or establish the effectiveness of follow-up. | Recalled nonresponse episodes, imagined friend-message scenarios and an incentivized live chat task Study 1: collection began 2023-02-02; end date not verified 195 recall respondents; exact valid bases not separately printed | Original source [S09] Study 1 Other measures; publisher text and author PDF physical p.14. |
The recall study’s actual-versus-predicted ghoster gap was 0.71 points (C17). Different respondents recalled different episodes; these were not matched former partners. The continuation and follow-up findings use a broad nonresponse definition. They are not romantic-reconciliation rates or instructions about how long someone should wait.
How did imagined ghosting compare with a brief reply?
In friend-message scenarios, the prediction gap was larger for ghosting. Participants were assigned one perspective and rated both response types in randomized order.
| ID | Finding and qualification | Population, actual period and base | Original source and locator |
|---|---|---|---|
| F42 | In Study 2, imagined ghosting produced mean bad-feelings ratings of 3.23 from ghosters versus predictions of 1.94; a short reply produced 2.33 versus 1.82. These are scenario ratings about a less-close friend, not observed clinical outcomes or percentages feeling guilty. | Recalled nonresponse episodes, imagined friend-message scenarios and an incentivized live chat task Study 2: collection began 2025-08-19; end date not verified 601: 301 imagined ghosters/responders and 300 imagined ghostees/receivers | Original source [S09] Publisher Table 1 / Study 2 Results and Figure 1; author PDF physical pp.10 and 25. |
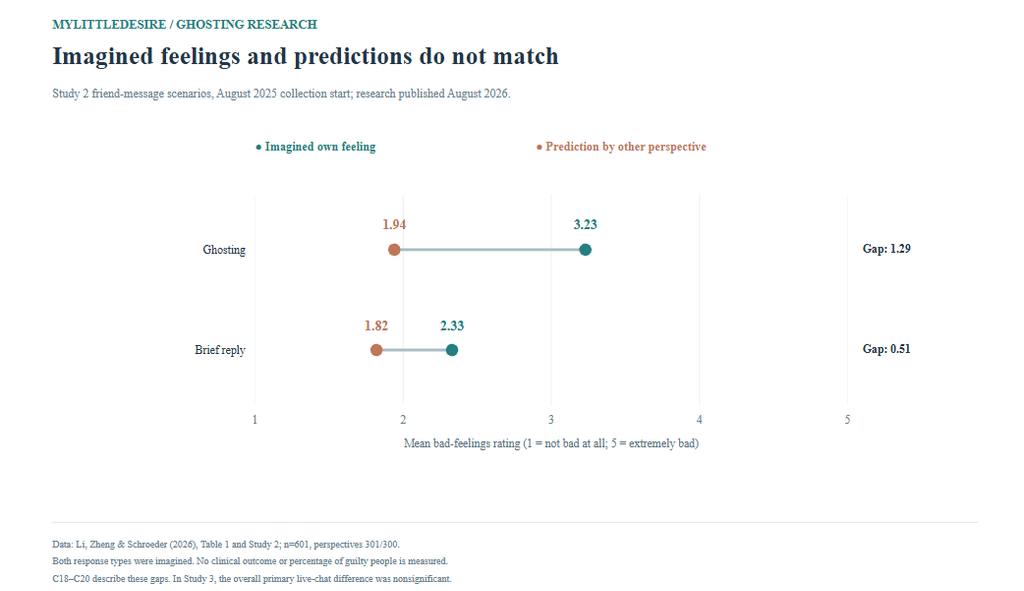
The gaps are 1.29 points for imagined ghosting and 0.51 for a brief reply, a difference of 0.78 points (C18–C20). These are descriptive differences on the same five-point scale. The source already tests the interaction. A convenient chart and transparent arithmetic do not constitute new fieldwork or a novel scientific discovery, and do not prove a brief reply prevents every kind of distress.
Did the live-chat study reproduce the pattern for everyone?
No. Its primary overall paired comparison was nonsignificant. That result stays visible beside the selected subgroup findings.
| ID | Finding and qualification | Population, actual period and base | Original source and locator |
|---|---|---|---|
| F43 | Across the live-chat ghosting pairs, ghosters’ actual mean was 3.26 and ghostees’ predicted mean was 3.35; the primary paired difference was not statistically significant (p=0.357; d=0.07, 95% CI −0.08–0.23). This overall primary result did not reproduce the underestimation pattern. Do not omit it when discussing the paper. | Recalled nonresponse episodes, imagined friend-message scenarios and an incentivized live chat task Study 3: collection began 2024-08-29; end date not verified 350 participants / 175 complete ghosting pairs | Original source [S09] Publisher Table 1 / Study 3 Results; author PDF physical p.35. |
| F44 | In the same live-chat pairs, ghosters labeled their behavior as ghosting at a mean 2.56, compared with 3.06 from ghostees. Different perceptions of a task interaction; no universal duration threshold is identified. | Recalled nonresponse episodes, imagined friend-message scenarios and an incentivized live chat task Study 3: collection began 2024-08-29; end date not verified 350 participants / 175 ghosting pairs | Original source [S09] Study 3 Results / manipulation check; author PDF physical pp.33 and 37. |
| F45 | Ghosters’ mean negative feeling toward the partner was 2.29, while ghostees predicted 3.41. This is evaluation of the conversation partner, a different outcome from feeling bad about one’s behavior. | Recalled nonresponse episodes, imagined friend-message scenarios and an incentivized live chat task Study 3: collection began 2024-08-29; end date not verified 350 participants / 175 ghosting pairs | Original source [S09] Study 3 Results; author PDF physical pp.33–35. |
| F46 | Among Study 3 participants individually rating the nonresponse above the ghosting-recognition midpoint, mean actual and predicted bad feelings were 3.93 and 3.51. A selected perception subgroup with unmatched group sizes; this does not override the nonsignificant result for all 175 pairs. The manuscript notes the moderation analysis was not preregistered. | Recalled nonresponse episodes, imagined friend-message scenarios and an incentivized live chat task Study 3: collection began 2024-08-29; end date not verified 121 individual participants: 46 ghosters and 75 ghostees; not 121 matched pairs | Original source [S09] Publisher Table 1 and Study 3 moderation discussion; author PDF physical pp.10 and 36. |
The task made skipping the second conversation appealing, and ghosters chose whether to skip. The stronger-recognition subgroup selected individual participants according to their own perceptions; its groups are not matched pairs and its moderation analysis was not preregistered. It does not replace the overall null result. Evaluation of the partner, evaluation of one’s behavior and labeling behavior ghosting are separate outcomes.
What can Canadian and US intention comparisons show?
The original public supplement to a June 2026 cross-national paper supplies context-specific mean stated likelihoods. We verified these values in the supplement and country sample sizes in the original abstract. Full restricted main methods, exact field dates and operational duration endpoints remain unavailable.
| ID | Finding and qualification | Population, actual period and base | Original source and locator |
|---|---|---|---|
| F47 | For the Canadian sample, mean stated likelihood was 41.30% for short-term romance and 47.65% for short-term friendship; long-term means were 6.94% and 16.63%. Mean intentions, not shares of people reporting actual conduct. | Selected Canadian Study 1 sample Exact field dates not independently verified; publication is 2026, not proof of 2026 measurement Canada sample 146; exact valid cell bases unavailable | Original source [S10] Original supplement physical p.5, Table S2; abstract country sample. |
| F48 | For the US sample, mean stated likelihood was 34.57% for short-term romance and 45.31% for short-term friendship; long-term means were 8.07% and 11.17%. The original long-term US friendship–romance comparison was not statistically significant. Descriptive point gaps are not new significance tests. | Selected US Study 1 sample Exact field dates not independently verified; publication is 2026, not proof of 2026 measurement US sample 150; exact valid cell bases unavailable | Original source [S10] Original supplement physical p.5, Table S2; abstract country sample. |
| F49 | Across the six Study 1 country samples, the supplement reported mean stated likelihood of 37.82% for friendships and 34.05% for romantic relationships. A sample aggregate, not a population-weighted worldwide estimate; interactions mean the average pattern is not identical in every country. | Selected country samples; full recruitment/age eligibility and exact short-/long-term definitions not independently verified from the restricted main text Exact field dates not independently verified; publication is 2026, not proof of 2026 measurement Study 1 overall 885; Canada 146; US 150. Valid subgroup bases for the intention table not separately verified. Study 2 total 1,741 is not pooled into these results. | Original source [S10] Original supplement physical p.4, unadjusted Study 1 intention results. |
| F50 | The same unadjusted Study 1 analysis reported 51.62% mean stated likelihood for short-term relationships versus 20.26% for long-term ones. Intentions averaged across relationship contexts; do not label them percentages of actual breakups. | Selected country samples; full recruitment/age eligibility and exact short-/long-term definitions not independently verified from the restricted main text Exact field dates not independently verified; publication is 2026, not proof of 2026 measurement Study 1 overall 885; Canada 146; US 150. Valid subgroup bases for the intention table not separately verified. Study 2 total 1,741 is not pooled into these results. | Original source [S10] Original supplement physical p.4, relationship-length main effect. |
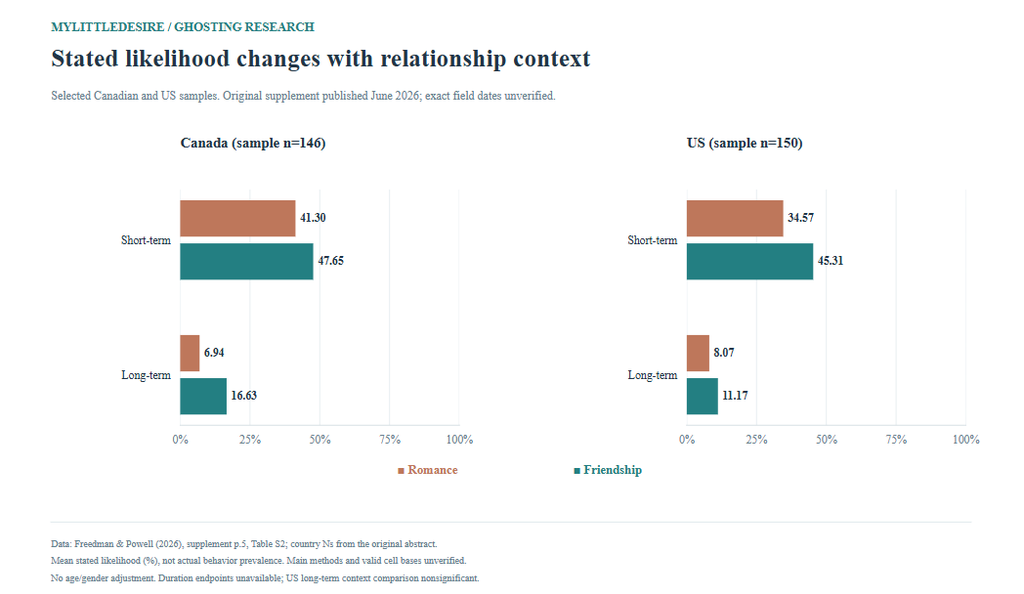
Friend-minus-romance stated-likelihood gaps are 6.35 points for Canadian short-term contexts and 9.69 for long-term; the US gaps are 10.74 and 3.10 (C13–C16). These are mean stated-likelihood differences, not actual behavior-prevalence gaps. The source’s US long-term comparison was nonsignificant. Six-country aggregates are selected-sample averages, not population-weighted world estimates. We have not filled an Australian evidence gap with another country’s data.
What comparisons does MyLittleDesire contribute?
The contribution is organization, chart design and descriptive synthesis. Some contrasts were already discussed or apparent in the originals. No original fieldwork, causal estimate, new confidence interval or novel scientific discovery is claimed.
| ID | Comparison | Result | Qualification and original source |
|---|---|---|---|
| C01 | Pew receipt: youngest minus oldest | 28.0 percentage points | Cross-sectional reported lifetime receipt; not an aging effect. Pew Research Center / Ipsos [S01] |
| C02 | Pew receipt: youngest / oldest | 3.00× | Raw prevalence ratio from rounded percentages; not adjusted causal risk. Pew Research Center / Ipsos [S01] |
| C03 | Pew receipt: ever-online minus never-online | 34.0 percentage points | App exposure and selection differ; receipt need not have occurred online. Pew Research Center / Ipsos [S01] |
| C04 | Pew receipt: current-online minus never-online | 43.0 percentage points | Current online users are a subset of ever users; not app-specific incidence. Pew Research Center / Ipsos [S01] |
| C05 | SCAL: millennial minus adult Gen Z receipt | 13.0 percentage points | Source generation labels and December 2022 field period; unequal exposure history. Survey Center on American Life / American Enterprise Institute; Ipsos [S02] |
| C06 | YouGov: friend minus dating receipt | 6.0 percentage points | Multiple-response categories overlap; do not add to count unique recipients. YouGov US [S04] |
| C07 | Freedman Study 2: friendship minus romantic receipt | 15.6 percentage points | Within one selected sample; joint personal overlap not identified. Freedman, Powell, Le and Williams; Dartmouth, Roanoke, Haverford and Purdue [S05] |
| C08 | Freedman Study 2: friendship minus romantic initiation | 12.8 percentage points | Within one selected sample; not a national rate. Freedman, Powell, Le and Williams; Dartmouth, Roanoke, Haverford and Purdue [S05] |
| C09 | Navarro: inclusive repeated-ghosting classification | 7.2 % of selected sample | 45/626: includes 30 ghosting-only plus 15 combined; requires ≥3 prior-year experiences. Not an additional survey. Navarro, Larrañaga, Yubero and Víllora; Universidad de Castilla-La Mancha [S06] |
| C10 | Navarro: combined share among repeated-ghosting profiles | 33.3 % of repeated-ghosting profiles | 15/45; describes co-classification for repeated breadcrumbing within this selected sample. Navarro, Larrañaga, Yubero and Víllora; Universidad de Castilla-La Mancha [S06] |
| C11 | Leckfor Study 2: direct-rejection minus ghosting intention | 1.71 points on 1–7 intention scale | A gap between scenario-average ratings, not a percentage-point gap. Leckfor, Wood, Slatcher and Hales; University of Georgia and University of Mississippi [S08] |
| C12 | Leckfor Study 3: direct-rejection minus ghosting needs satisfaction | 0.36 points on 1–7 needs scale | Difference between rounded means; the paper’s unrounded model coefficient is 0.37. Recall prompts were assigned, not actual breakup experiences. Leckfor, Wood, Slatcher and Hales; University of Georgia and University of Mississippi [S08] |
| C13 | Canada short-term: friendship minus romantic stated likelihood | 6.35 points in mean stated likelihood (%) | Original unadjusted supplement means; not an actual behavior-prevalence gap. Full main methods unavailable. Gili Freedman and Darcey N. Powell; St. Mary’s College of Maryland and Texas A&M University–Corpus Christi [S10] |
| C14 | Canada long-term: friendship minus romantic stated likelihood | 9.69 points in mean stated likelihood (%) | Original unadjusted supplement means; not an actual behavior-prevalence gap. Full main methods unavailable. Gili Freedman and Darcey N. Powell; St. Mary’s College of Maryland and Texas A&M University–Corpus Christi [S10] |
| C15 | US short-term: friendship minus romantic stated likelihood | 10.74 points in mean stated likelihood (%) | Original unadjusted supplement means; not an actual behavior-prevalence gap. Full main methods unavailable. Gili Freedman and Darcey N. Powell; St. Mary’s College of Maryland and Texas A&M University–Corpus Christi [S10] |
| C16 | US long-term: friendship minus romantic stated likelihood | 3.10 points in mean stated likelihood (%) | Original unadjusted supplement means; not an actual behavior-prevalence gap. Full main methods unavailable. The source’s US long-term context comparison was nonsignificant. Gili Freedman and Darcey N. Powell; St. Mary’s College of Maryland and Texas A&M University–Corpus Christi [S10] |
| C17 | Li Study 1: reported minus predicted ghoster bad feelings | 0.71 points on 1–5 bad-feelings scale | Separate people recalled separate episodes; predictions concern ghosters, not ghostees. Li, Zheng and Schroeder; University of California Berkeley and University of Cambridge [S09] |
| C18 | Li Study 2: imagined ghosting prediction gap | 1.29 points on 1–5 bad-feelings scale | Scenario mean gap, not an observed clinical effect. Li, Zheng and Schroeder; University of California Berkeley and University of Cambridge [S09] |
| C19 | Li Study 2: imagined brief-reply prediction gap | 0.51 points on 1–5 bad-feelings scale | Same scenario framework and scale; both response types rated within assigned perspective. Li, Zheng and Schroeder; University of California Berkeley and University of Cambridge [S09] |
| C20 | Li Study 2: ghosting minus brief-reply prediction gap | 0.78 points on 1–5 bad-feelings scale | Difference of descriptive mean gaps. The source already tests this interaction; no novel discovery or new inferential test is claimed. Li, Zheng and Schroeder; University of California Berkeley and University of Cambridge [S09] |
What should readers check before quoting a ghosting statistic?
Can these rates be averaged into one global number?
No defensible global estimate follows from studies with different questions, populations, recruitment, timeframes and units.
How many days without a reply count as ghosting?
The retained evidence does not establish a universal cutoff. A descriptive median in selected recollections does not provide a rule for everyone.
Are friendship ghosting and dating ghosting interchangeable?
No. Relationship expectations and opportunities differ. Same-sample comparisons can be useful when their question and sample boundaries remain attached.
Do men or women universally ghost more?
These findings do not establish that. Receipt differs from initiation, and small rounded estimate differences without appropriate uncertainty do not prove a population ranking.
Does a high rate in an app study apply to all app users?
Only if recruitment and eligibility support that inference. A self-selected experience-sharing sample can describe its participants without measuring all users.
Does ghosting diagnose someone’s personality or mental health?
No. Measures, associations and respondents’ interpretations do not diagnose an individual or verify why a particular person stopped responding.
How were the findings selected and verified?
We prioritized original questionnaires, tables, primary reports, full author manuscripts and public supplements. Each database record retains its finding ID, values/units, original organization/title/URL, publication and field dates, population, sample availability, methods, locator, definitions, caveats, review date and verification status. Related categories are grouped rather than counted as independent studies.
The core contains 50 grouped findings, 147 numeric inputs and 10 source publications/analyses. The two YouGov publications contribute five findings combined; no single publication supplies more than nine. Multiple studies, shared authors and related survey programs are not automatically independent replications.
Pew and Survey Center on American Life questionnaires/methods, YouGov tables/daily results, full Freedman/Leckfor/Li author papers, Timmermans’ original publication/repository text and the cross-national public supplement were checked. NCBI’s documented public BioC service supplied the Navarro manuscript/tables when ordinary PMC returned a browser challenge. Direct-host failures were not treated as downloaded originals.
The cross-national findings are verified at supplement/abstract level, with full main methods unavailable. Underlying microdata, adjusted models and narrative coding were not independently rerun. Published confidence intervals retained in the database concern a correlation and standardized differences, in their original units. Missing intervals were not manufactured.
All 20 calculations use named inputs from one source at a time. Percentage points, ratios, count-based percentages and rating points stay separate. Decimal rounding avoids floating-point display artifacts. Downloadable chart data identifies every plotted input.
What was withheld?
Unresolved source percentages, ambiguous exposure thresholds, unverified international claims, incompatible trends and unreconciled outcome-score units were excluded. A UK paper published in 2026 used November 2023 convenience data and conflicting exposure-threshold descriptions; its headline prevalence is outside this numeric core. A discovered same-team Spanish prevalence paper was not used to assert a threshold ratio without checking the relevant rows and equivalence.
What are the main limitations?
- Most experiences/motives are self-reported, and another person’s reasons are often unverified.
- Probability panels, opt-in daily polls, selected app users and experimental participants have different generalizability.
- Some exact item/subgroup bases, field dates and full cross-national methods remain unavailable.
- Relationship dissolution differs from the broad temporary-nonresponse definition in the 2026 feelings paper.
- Intentions, narrative counts, means and reported experiences cannot be pooled.
- No national Australian estimate, global average, causal app/age effect or universal recovery probability was established.
Complete original-source bibliography
- S01 · Pew Research Center / Ipsos. Nearly Half of U.S. Adults Say Dating Has Gotten Harder; personal experiences and public attitudes chapters. Published: 2020-08-20. Actual period: 2019-10-16 to 2019-10-28; lifetime reports and hypothetical intentions as labeled. Sample: Overall 4,860; first-date intention base 1,123; subgroup counts not supplied beside every estimate. Method: Weighted probability-panel survey using the American Trends Panel plus an Ipsos KnowledgePanel LGB oversample; English/Spanish; overall sampling margin ±2.1 points. Limits: Self-reports and hypothetical intentions differ. Overall and subgroup estimates have different uncertainty; current online daters are a subset of ever users. Lifetime receipt need not have occurred through an app. Supporting original material: Original tables, paper or methods, Original tables, paper or methods, Original tables, paper or methods, Original tables, paper or methods.
- S02 · Survey Center on American Life / American Enterprise Institute; Ipsos. From Swiping to Sexting: The Enduring Gender Divide in American Dating and Relationships. Published: 2023-02-09. Actual period: 2022-12-09 to 2022-12-18; survey branded January 2023; lifetime dating experience. Sample: Survey overall 5,055; exact Q22C valid/unweighted subgroup bases are not separately printed beside these estimates. Method: Weighted Ipsos KnowledgePanel probability sample; English/Spanish. Topline Q22 asks all; items A/B have separate form labels, so their form Ns are not automatically assigned to item C.. Limits: Publication/branding month is not fieldwork month. Exact generation birth-year cutoffs were not independently verified; retain the report labels instead of inventing 2027 ages. Supporting original material: Original tables, paper or methods.
- S03 · YouGov / Huffington Post. Poll Results: Ghosting. Published: 2014-10-28. Actual period: 2014-10-23 to 2014-10-26; lifetime dating receipt and initiation. Sample: Overall survey 1,000; receipt item unweighted n=990; initiation item n=986; exact age/gender bases in original tables. Method: Online YouGov survey; publisher reports overall margin ±4.2 points; original weighted toplines and unweighted bases inspected. Limits: Historical poll; an overall margin does not describe every subgroup. The dating-breakup wording is narrower than an all-context ghosting question. Rounded differences are not new significance tests. Supporting original material: Original tables, paper or methods.
- S04 · YouGov US. Daily question: Have you ever been ghosted by a friend, family member, or someone you dated?. Published: 2021-10-21. Actual period: 2021-10-21; lifetime, multiple relationship contexts. Sample: 7,180 US adults; subgroup/weighted-effective bases not independently verified. Method: Published YouGov daily-question results; multiple answers permitted; full item-specific weighting/recruitment detail unavailable on the result page. Limits: Multiple selections overlap. Do not sum relationship categories or equate an all-context daily poll with a dating-only probability survey.
- S05 · Freedman, Powell, Le and Williams; Dartmouth, Roanoke, Haverford and Purdue. Ghosting and destiny: Implicit theories of relationships predict beliefs about ghosting. Published: Online 2018-01-12; journal issue March 2019. Actual period: Exact calendar field dates unavailable in the checked paper; data precede 2018 online publication. Sample: Study 1 n=554; Study 2 n=747; one publication with two samples. Method: Cross-sectional self-reports; check-all/dichotomous judgments in Study 1, 1–7 ratings in Study 2; author-hosted full paper checked. Limits: Not national estimates. Study 1 definitions/check-all items and Study 2 standardized definition/rating scales differ. Unknown joint overlap cannot be inferred from marginals. Supporting original material: Original tables, paper or methods.
- S06 · Navarro, Larrañaga, Yubero and Víllora; Universidad de Castilla-La Mancha. Psychological Correlates of Ghosting and Breadcrumbing Experiences: A Preliminary Study among Adults. Published: 2020-02-10. Actual period: Spain 2019; experiences during the preceding 12 months. Sample: 626 participants; 303 men, 323 women; group counts 30/88/15/493. Method: Convenience/snowball online cross-sectional survey; retained classification required at least three experiences in the last year; full original manuscript/tables via documented public NCBI BioC service. Limits: Mutually exclusive profiles separate repeated ghosting only from combined repeated ghosting and breadcrumbing. Not involved means below the classification thresholds, not necessarily never exposed. Several outcome-score descriptions/labels require reconciliation and are not reused here. Supporting original material: Original tables, paper or methods.
- S07 · Timmermans, Hermans and Opree; Erasmus University Rotterdam. Gone with the wind: Exploring mobile daters’ ghosting experiences. Published: Online 2020-11-20; journal issue February 2021. Actual period: Exact calendar field period not reported in checked methods; data collected before 2019/2020 conference presentations. Sample: 328 app users; ghostee narratives n=217; ghoster narratives n=142; painfulness n=207. Method: Mixed open/closed online survey; recruitment through news/magazine websites and social channels; thematic coding permits multiple themes. Limits: Selected app users are not all adults or a national sample. Narrative counts do not measure population prevalence. The paper’s 173/63% initiation description and pain-model sample/df details are internally inconsistent; those claims are withheld. Supporting original material: Original tables, paper or methods.
- S08 · Leckfor, Wood, Slatcher and Hales; University of Georgia and University of Mississippi. From Close to Ghost: Examining the Relationship Between the Need for Closure, Intentions to Ghost, and Reactions to Being Ghosted. Published: Online 2023-01-06; journal issue August 2023. Actual period: Exact calendar field dates not independently established; all studies predate 2023 publication. Sample: Study 1 n=553; Study 2 n=411; Study 3 n=545 after recall/attention/manipulation exclusions. Method: Three preregistered online studies; Study 3 randomly assigned an autobiographical recall prompt, not actual life ghosting. Full author-hosted paper checked.. Limits: Not population prevalence. Need for closure was measured, not randomized. Study 3 excludes people without a qualifying recall and cannot estimate population receipt. Repeated participants across studies were not independently audited. Supporting original material: Original tables, paper or methods.
- S09 · Li, Zheng and Schroeder; University of California Berkeley and University of Cambridge. The Pain of Ghosting? People Underestimate How Bad Their Conversation Partners Feel About Not Responding. Published: 2026-08-31. Actual period: Study 1 collection began 2023-02-02; Study 2 began 2025-08-19; Study 3 began 2024-08-29; end dates not verified. Sample: Study 1 n=195 (101 ghosters/94 ghostees); Study 2 n=601 (301/300); Study 3 primary ghosting pairs n=350 (175 pairs), from 458 completers. Method: Preregistered recall/scenario/live-interaction studies; full publisher text and author manuscript checked. Study 2 randomized perspective, with both response types rated in randomized order.. Limits: Broad process-oriented ghosting can be temporary and need not end a relationship. Live skipping was made appealing by the task; ghosting choice was not a randomized real-world breakup. Study 3 overall primary feeling difference was nonsignificant; selected perception subgroup does not replace that result. Supporting original material: Original tables, paper or methods, Original tables, paper or methods, Original tables, paper or methods.
- S10 · Gili Freedman and Darcey N. Powell; St. Mary’s College of Maryland and Texas A&M University–Corpus Christi. A Cross-National Comparison of Ghosting Knowledge, Attitudes, Intentions, and Behaviors in Friendships and Romantic Relationships Spanning Twelve Countries. Published: 2026-06-24. Actual period: Exact field dates not independently verified; publication is 2026, not proof of 2026 measurement. Sample: Study 1 overall 885; Canada 146; US 150. Valid subgroup bases for the intention table not separately verified. Study 2 total 1,741 is not pooled into these results.. Method: Original abstract plus publicly readable publisher supplement, Study 1 analyses NOT controlling age/gender; Table S2 means and SDs checked through public web retrieval. Limits: Mean stated likelihood (%) is not the percentage who actually ghosted or a national rate. Full main methods, exact field dates and operational duration endpoints remain unavailable. Do not call these adjusted estimates. Supporting original material: Original tables, paper or methods, Original tables, paper or methods.
Background review used for research discovery, outside the numerical core: Freedman and Powell (2024), Ghosting: A Common but Unpopular Rejection Strategy. Text-retrieval support: NCBI BioC documentation, acknowledging Comeau and colleagues’ PMC text-mining subset resource.
How to cite this resource
For a survey finding, consult and cite the original research. For the compilation, chart design or a MyLittleDesire calculation, credit this resource and identify its underlying study. MyLittleDesire did not conduct the source surveys.
MyLittleDesire. Ghosting Statistics 2027: Dating, Friendship and the Research Behind the Numbers. 2027 editorial edition; sources reviewed October 25, 2026. https://mylittledesire.com/ghosting-statistics/. Add an actual access date when required by your citation style.