
Couples therapy and counseling research can help explain who seeks support, what changes during treatment and how outcomes develop over time. The useful question is not simply whether it works, but which intervention helped which population, on which outcome, and for how long.
60 grouped findings from 15 original-source reports and analyses, four MyLittleDesire chart designs and 20 reproducible descriptive calculations. Related categories stay grouped. The 172 numeric inputs are not 172 independent findings; reports can reuse trial participants.
What are the key findings?
18%
25% vs. 10%
reported lifetime counseling attendance in the April 2025 US-citizen poll. YouGov US [S01].
was lifetime attendance at 65+ versus 18–29 in that poll; not a generational time trend. YouGov US [S01].
47%
19%
called therapy very or somewhat important in a separate opinion question (C04). YouGov US [S02].
named professional support after relationship breakdown in the Australian survey; not necessarily couples therapy. Relationships Australia / Social Research Centre [S03].
g = 1.12
50.0% / 45.9%
was the meta-analysis’s pooled within-treatment satisfaction change; not 112% improvement. Roddy, Walsh, Rothman, Hatch and Doss [S04].
met clinically significant improvement criteria at five years in the historical IBCT/TBCT trial. Christensen, Atkins, Baucom and Yi [S05].
26.0% / 12.1%
SMD −0.17
were reliable versus clinically significant GRIMS improvement in one UK clinic’s paired assessments. Hewison, Casey and Mwamba / Tavistock Relationships [S06].
for depressive symptoms versus individual psychotherapy had a confidence interval spanning zero. Barbato, D’Avanzo and Parabiaghi / Cochrane [S07].
49.0% / 44.6%
11.0
were NHS therapy-based recovery and improvement, using different denominators. NHS England [S15].
was the average number of appointments per NHS Couples Therapy for Depression course in 2025–26. NHS England [S15].
65% / 59% / 54%
6.60×
completed full, automated and contingent OurRelationship support formats; completion is not recovery. Le, Roddy, Rothman, Salivar, Guttman and Doss [S12].
was a modeled benefit/cost ratio, not a guaranteed or directly observed financial return. Doss, Guttman, Metser-Waldman, Ajmera and Dopp [S13].
Which therapy statistics can be compared?
Match the population, intervention, outcome, denominator and follow-up before comparing a number. A useful source can report several different kinds of improvement without contradiction.
| Measure | What it means | Boundary when quoting |
|---|---|---|
| Lifetime attendance | A respondent recalls ever attending | Not current utilization or the percentage of couples attending together. |
| Public attitudes | How important people think therapy is | Not actual attendance, need or efficacy. |
| Within-group effect | Change in a treated group over time | May include regression to the mean, selection and changes unrelated to treatment. |
| Controlled effect | Difference in changes or outcomes versus a defined comparison | Waitlist comparisons and two-active-treatment comparisons answer different questions. |
| Reliable change | Movement beyond a source’s measurement-error threshold | Does not necessarily cross into a non-distressed range. |
| Clinically significant change | A source-defined clinical change or threshold | Definitions differ across studies; retain the original rule. |
| Service recovery | Questionnaire-based symptom outcome in a service cohort | NHS symptom recovery is not relationship recovery. |
| Satisfaction with services | A user’s view of the service | Not a recovered percentage; completers may be selectively positive. |
| Model-based benefits | Estimated value under assumptions | Not directly observed cash savings or current therapy prices. |
How many adults have tried couples counseling?
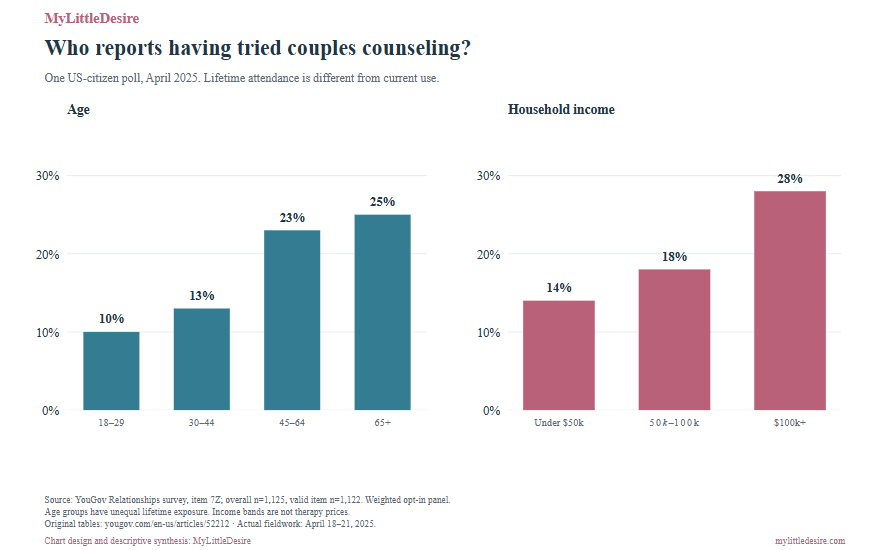
In YouGov’s April 2025 US-citizen survey, 18% reported ever attending couples counseling. Older and higher-income respondents reported greater lifetime attendance.
| ID | Finding and qualification | Population, actual period and base | Original source and locator |
|---|---|---|---|
| F01 | In the April 2025 US-citizen poll, 18% reported ever attending couples counseling; 81% said no and 1% were unsure. These are lifetime responses, not the share currently in counseling. | US adult citizens, age 18+; lifetime attendance question 2025-04-18 to 2025-04-21 Overall n=1,125; valid counseling item unweighted n=1,122; age bases 217 / 205 / 405 / 295; income bases 423 / 347 / 260 | Original research [S01] Original results physical p.38, item 7Z; topline p.2. |
| F02 | Reported lifetime attendance was 10% at ages 18–29, 13% at 30–44, 23% at 45–64 and 25% at 65+. Cross-sectional age differences do not establish generational attitudes or changes over time. | US adult citizens, age 18+; lifetime attendance question 2025-04-18 to 2025-04-21 Overall n=1,125; valid counseling item unweighted n=1,122; age bases 217 / 205 / 405 / 295; income bases 423 / 347 / 260 | Original research [S01] Original results physical p.38, 7Z, age columns. |
| F03 | Lifetime attendance was 14% below $50,000 household income, 18% at $50,000–$100,000 and 28% at $100,000 or more. These are survey income bands and unadjusted lifetime estimates; they are not therapy prices. | US adult citizens, age 18+; lifetime attendance question 2025-04-18 to 2025-04-21 Overall n=1,125; valid counseling item unweighted n=1,122; age bases 217 / 205 / 405 / 295; income bases 423 / 347 / 260 | Original research [S01] Original results physical p.38, 7Z, family-income columns. |
How important do people think couples therapy is?
In a separate early-2025 survey, 17% considered couples therapy very important and 30% somewhat important to a successful relationship. Younger adults were more likely to choose very important.
| ID | Finding and qualification | Population, actual period and base | Original source and locator |
|---|---|---|---|
| F04 | For a successful romantic relationship, 17% called couples therapy very important, 30% somewhat important, 25% not very important and 14% not at all important; 14% were unsure. Do not interpret importance as a statement that every couple needs treatment. | US adult citizens; randomly shown 16 of 32 relationship-factor items Item survey January 28 to February 3, 2025; broader release also includes January 29 to February 1 Overall 2,167; couples-therapy item unweighted n=1,068; age bases 189 / 242 / 393 / 244 | Original research [S02] Original results physical p.35, item 3AC. |
| F05 | The share calling couples therapy very important was 25% at ages 18–29, 21% at 30–44, 13% at 45–64 and 10% at 65+. A different question and survey from the lifetime attendance findings; no individual attitude–attendance cross-tab was analyzed. | US adult citizens; randomly shown 16 of 32 relationship-factor items Item survey January 28 to February 3, 2025; broader release also includes January 29 to February 1 Overall 2,167; couples-therapy item unweighted n=1,068; age bases 189 / 242 / 393 / 244 | Original research [S02] Original results physical p.35, item 3AC, age columns. |
The combined very-or-somewhat share is 47% (C04). The age gradient in opinions runs in the opposite direction from the lifetime-attendance pattern, but these are different polls and questions. It does not identify individual attitude–behavior gaps or prove a generational change.
| Age | Ever attended counseling: April 2025 | Therapy very important: Jan/Feb 2025 |
|---|---|---|
| 18–29 | 10% | 25% |
| 30–44 | 13% | 21% |
| 45–64 | 23% | 13% |
| 65+ | 25% | 10% |
MyLittleDesire synthesis of YouGov US [S01] and YouGov US [S02]. Both surveys cover US adult citizens, but respondents, field dates and questions differ. These columns do not measure an individual-level attitude–attendance gap.
What does a survey published in 2026 add?
Grow Therapy’s sponsored YouGov poll, collected in December 2025, reported 15% lifetime attendance. Among attendees, 71% recalled noticeable improvement. This is survey evidence, not an experimental treatment success rate.
| ID | Finding and qualification | Population, actual period and base | Original source and locator |
|---|---|---|---|
| F51 | In the December 2025 sponsored poll, 15% reported attending couples therapy and another 16% had considered it without attending. Not directly comparable as a trend with the differently worded April 2025 US-citizen poll; full questionnaire unavailable. | US adults; therapy-attendee and nonattendee subgroups as stated 2025-12-18 to 2025-12-22 2,514 adults overall; valid item/attendee/subgroup counts and precision not published in checked page | Original research [S14] Key takeaways / opening findings; Methodology. |
| F52 | Among attendees, 71% reported noticeable relationship improvement and 19% said they realized the relationship was no longer sustainable. No verified clinical threshold or common follow-up; categories may overlap. This is recollection, not a trial-based 71% success probability. | Respondents who had attended couples therapy 2025-12-18 to 2025-12-22 Attendee valid item base not published | Original research [S14] Couples therapy has positive results section / key takeaways. |
| F53 | Reported attendance motivations included unresolved conflict (45%) and communication difficulty (43%). Reported motives can overlap; they do not show that therapy is appropriate or needed for every conflict. | Respondents who had attended couples therapy 2025-12-18 to 2025-12-22 Attendee subgroup count not published | Original research [S14] Communication struggles drive people to couples counseling. |
| F54 | Attendance was 22% among respondents with children under 18 and 9% among those without children. The second group is not everyone without minor children; retain the source’s without-children label. Unadjusted differences do not establish a parenting effect. | US adults; therapy-attendee and nonattendee subgroups as stated 2025-12-18 to 2025-12-22 2,514 adults overall; valid item/attendee/subgroup counts and precision not published in checked page | Original research [S14] Most divorced couples never bothered with therapy, parenthood paragraph. |
| F55 | Among people who had never attended, 54% said they had not had a reason; cost or insurance concerns and partner disinterest were each reported at 11%. Cost wording is summarized from source prose; original questionnaire unavailable. No reason is not evidence of stigma, denial or unmet treatment need. | Respondents who had never attended couples therapy 2025-12-18 to 2025-12-22 Nonattendee valid item count not published | Original research [S14] There may be more reasons to go section. |
| F56 | Reported benefits among attendees included better communication (34%), strengthening the relationship (30%) and greater emotional connection (26%). Self-reported benefits can overlap and do not add up to a recovered share. | Respondents who had attended couples therapy 2025-12-18 to 2025-12-22 Attendee valid item count not published | Original research [S14] Couples therapy has positive results section, benefits list. |
The sponsor published overall sample size, collection dates and broad weighting information, but not full questionnaires, valid attendee counts or a clinical improvement threshold. Reported motives and benefits can overlap. The 15% result and April’s 18% do not establish a decline: eligibility and wording differ. We do not adopt the sponsor’s inference that attending earlier would have prevented divorce.
Where do Australians seek help with relationship difficulties?
Relationships Australia’s 2024 probability-panel survey found that friends and family were more commonly named than professional services. These support questions include relationships beyond romantic partners.
| ID | Finding and qualification | Population, actual period and base | Original source and locator |
|---|---|---|---|
| F06 | For difficulties in their most meaningful relationship, 48% said they managed on their own, 37% named friends, 33% family and 8% professional support. The most meaningful relationship is not necessarily romantic; responses can overlap. | Adult residents; most meaningful relationship may be a partner, relative or friend; relationship-breakdown subgroups separate 2024-08-19 to 2024-09-01 B12: n=2,995 identifying a most meaningful relationship | Original research [S03] Printed p.43 / physical p.53, Figure 36; item B12. |
| F07 | Following relationship breakdown, 66% received valuable support from friends, 53% from family and 19% from professional sources; 20% reported no support. Professional support here is broader than couples therapy. Support sources overlap. | Australians reporting a breakup, separation or divorce 2024-08-19 to 2024-09-01 C5: n=1,674 | Original research [S03] Printed p.37 / physical p.47, Figure 31; item C5. |
| F08 | Barriers to valuable support after breakdown included lack of motivation or desire (24%), expense (16%), isolation (15%) and lack of understanding from chosen support people (13%). These are barriers to support in general, not the percentage unable to afford couples counseling. | Australians reporting relationship breakdown 2024-08-19 to 2024-09-01 C6_New: n=1,674 | Original research [S03] Printed p.38 / physical p.48, Figure 32; item C6_New. |
| F09 | Among people still affected by relationship breakdown, 30% had sought professional help, including a counselor, GP or mediator, as a coping strategy. This conditional group differs from all people with a past breakdown; do not read 30% versus 19% as a time trend. | Australians still affected by relationship breakdown 2024-08-19 to 2024-09-01 C8_New: n=609 | Original research [S03] Printed p.40 / physical p.50, Figure 34; item C8_New. |
After breakdown, the friend–professional difference is 47 points (C05); for difficulties in the most meaningful relationship, self-management exceeds professional support by 40 points (C06). Responses can overlap, and neither contrast measures unmet couples-therapy need. The 30% finding applies only to respondents still affected by a past breakdown.
What does the overall clinical evidence show?
A 2020 meta-analysis found a large pooled within-treatment improvement in relationship satisfaction, while its pooled waitlist change was small and not statistically clear.
| ID | Finding and qualification | Population, actual period and base | Original source and locator |
|---|---|---|---|
| F10 | The meta-analysis estimated a within-treatment pre/post satisfaction effect of Hedges g=1.12 (95% CI 0.92–1.31), versus g=0.12 (−0.04–0.29) within waitlists; the waitlist change was not significant. The two pooled within-group estimates cannot simply be subtracted and labeled a randomized treatment effect. This is not 112% improvement. | Couples in included English-language couple-therapy studies Studies published before the 2020 review; individual field periods not verified from abstract 58 studies representing 40 unique samples and 2,092 couples | Original research [S04] Original author abstract, Results; official NCBI PubMed record 32551734. |
The review covered 58 reports representing 40 unique samples and 2,092 couples. Those are different counts. Hedges g is a standardized effect, not a success percentage. Separate pooled within-group effects cannot simply be subtracted to create a randomized treatment effect. This review was verified at original-abstract level; its full methods were not independently audited here.
Related research: relationship satisfaction, trust and communication statistics.
What happened five years after couple therapy?
A historical US randomized trial followed 134 seriously distressed married couples after integrative or traditional behavioral couple therapy. At five years, roughly half met the source’s clinically significant improvement criterion, while about one quarter were separated or divorced.
| ID | Finding and qualification | Population, actual period and base | Original source and locator |
|---|---|---|---|
| F11 | Immediately after treatment, marital-satisfaction change was d=0.90 for integrative behavioral couple therapy (IBCT) and d=0.71 for traditional behavioral couple therapy (TBCT), without a significant difference. These are standardized changes, not recovered percentages. | Chronically and seriously distressed married couples randomized to IBCT or TBCT Treatment and five-year follow-up completed before 2010; exact calendar dates unavailable in checked original abstract 134 couples overall; marital status obtained for all 134; exact valid satisfaction subgroup bases not given in abstract | Original research [S05] Original abstract, Results, pre/post-treatment effect sizes. |
| F12 | At five years, reported satisfaction effects relative to pretreatment were d=1.03 for IBCT and d=0.92 for TBCT. Longer-term treatment differences were nonsignificant; full valid satisfaction bases were unavailable in the checked abstract. | Chronically and seriously distressed married couples randomized to IBCT or TBCT Treatment and five-year follow-up completed before 2010; exact calendar dates unavailable in checked original abstract 134 couples overall; marital status obtained for all 134; exact valid satisfaction subgroup bases not given in abstract | Original research [S05] Original abstract, Results, five-year satisfaction effects. |
| F13 | Clinically significant improvement at five years was reported for 50.0% of IBCT couples and 45.9% of TBCT couples. A qualified trial finding, not a universal counseling success rate or the percentage who remained married. | Chronically and seriously distressed married couples randomized to IBCT or TBCT Treatment and five-year follow-up completed before 2010; exact calendar dates unavailable in checked original abstract 134 couples overall; marital status obtained for all 134; exact valid satisfaction subgroup bases not given in abstract | Original research [S05] Original abstract, Results, clinically significant improvement. |
| F14 | The abstract reported that 25.7% of IBCT couples and 27.9% of TBCT couples were separated or divorced at five years. Separation is a different outcome from satisfaction change. Do not add or subtract these marginals to infer individual trajectories. | Chronically and seriously distressed married couples randomized to IBCT or TBCT Treatment and five-year follow-up completed before 2010; exact calendar dates unavailable in checked original abstract 134 couples overall; marital status obtained for all 134; exact valid satisfaction subgroup bases not given in abstract | Original research [S05] Original abstract, Results, marital status; status collected on all 134 couples. |
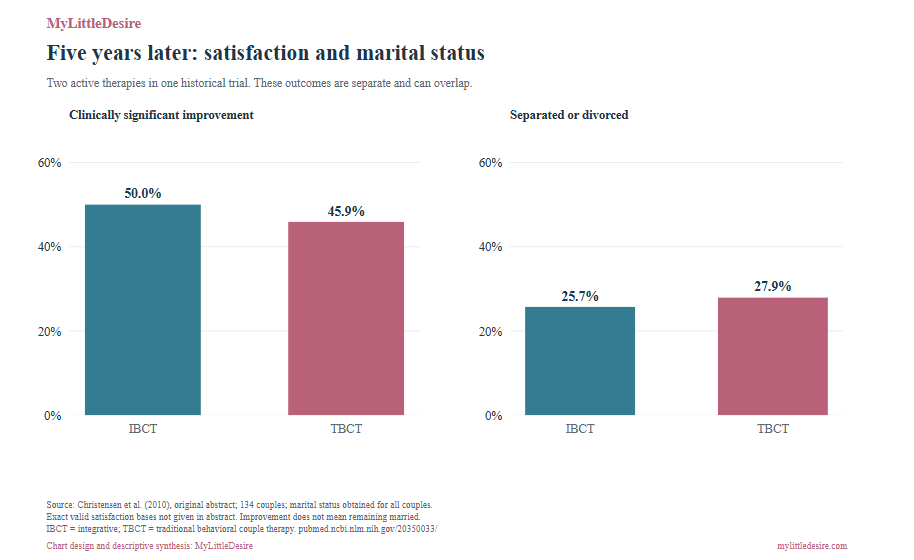
Both groups received therapy, and longer-term differences converged. The 4.1-point improvement difference (C13) is descriptive, not proof that one treatment is superior at five years. Satisfaction and marital status are separate outcomes; their marginals do not reveal whether the same couples improved and stayed married. Exact satisfaction valid bases were not given in the checked original abstract.
For legal event rates and marriage cohorts, see marriage and divorce statistics. Those population measures are different from outcomes in treated couples.
What happened in a UK routine-practice clinic?
A study of Tavistock Relationships’ 2008–2014 clinic records reported improvements in individual and relationship distress. Among paired GRIMS assessments, reliable improvement was more common than clinically significant change.
| ID | Finding and qualification | Population, actual period and base | Original source and locator |
|---|---|---|---|
| F15 | The naturalistic clinic study reported reduced individual psychological distress with a standardized change of d=−1.04. A negative value indicates less distress on the source scale; uncontrolled improvement does not isolate a treatment-caused effect. | Individually and relationally distressed clients attending at least two psychodynamic couple-therapy sessions Clinical records from 2008 through 2014-08-31 877 individuals overall; retained GRIMS change table n=412. CORE change-table n=432 conflicts with text n=423 and is withheld. | Original research [S06] Printed p.383 / physical p.7, Results: Psychological Distress. |
| F16 | The same study reported reduced relationship distress with d=−0.58, indicating improved relationship quality on the GRIMS scale. GRIMS scores run toward worse relationship quality when higher; the sign differs from a positively scored satisfaction measure. | Individually and relationally distressed clients attending at least two psychodynamic couple-therapy sessions Clinical records from 2008 through 2014-08-31 877 individuals overall; retained GRIMS change table n=412. CORE change-table n=432 conflicts with text n=423 and is withheld. | Original research [S06] Printed p.383 / physical p.7, Results: Relationship Satisfaction. |
| F17 | Among the 412 clients in the GRIMS change table, 26.0% showed reliable improvement, 12.1% clinically significant change and 7.8% deterioration. Categories are not mutually exclusive: clinically significant improvement requires reliable change plus crossing the functional threshold. Observed deterioration is not necessarily caused by therapy. | Individually and relationally distressed clients attending at least two psychodynamic couple-therapy sessions Clinical records from 2008 through 2014-08-31 GRIMS paired-change table n=412 individuals | Original research [S06] Printed p.384 / physical p.8, Table 3, GRIMS all-clients row. |
| F18 | Clients attended an average of 23.3 sessions (SD 23.5), ranging from 2 to 150 in this open-ended service. This is one historical clinic’s observed duration, not a recommended course length or a current national average. | Individually and relationally distressed clients attending at least two psychodynamic couple-therapy sessions Clinical records from 2008 through 2014-08-31 877 individuals overall; retained GRIMS change table n=412. CORE change-table n=432 conflicts with text n=423 and is withheld. | Original research [S06] Printed p.382 / physical p.6, Data Analysis, final paragraph. |
These historical observations lack an untreated comparison. The service offered open-ended treatment, and its average session count should not become a recommended duration. Missing final assessments matter: end-of-therapy data were available for 425 of 877 clients, with other assessments and models used. Inconsistent CORE category bases and a pooled GRIMS mean were withheld.
How does couple therapy compare with individual treatment for depression?
The 2018 Cochrane review did not establish a clear difference from individual psychotherapy in depressive symptoms, remaining depressed or discontinuation. Some relationship-distress results favored couple therapy, with very-low-certainty evidence.
| ID | Finding and qualification | Population, actual period and base | Original source and locator |
|---|---|---|---|
| F19 | For depressive symptoms, couple therapy versus individual psychotherapy had SMD=−0.17 (95% CI −0.44 to 0.10), with no clear difference. Low-certainty evidence. The interval spans zero; this does not prove equivalence. | Outpatient couples with a partner clinically diagnosed with depression, generally moderate severity Literature searches through 2018-02-19; earlier trials 9 studies / 304 participants | Original research [S07] Main results, couple therapy versus individual psychotherapy; depressive symptom level. |
| F20 | For remaining depressed, the corresponding risk ratio was 0.94 (95% CI 0.72–1.22), with no clear difference. Low-certainty evidence; a risk ratio is not a percentage-point difference or a cure rate. | Outpatient couples with a partner clinically diagnosed with depression, generally moderate severity Literature searches through 2018-02-19; earlier trials 6 studies / 237 participants | Original research [S07] Main results, proportion remaining depressed. |
| F21 | Treatment discontinuation versus individual psychotherapy had RR=0.85 (95% CI 0.51–1.41), with no clear difference. Low-certainty evidence. Discontinuation was used as a proxy adverse outcome; it is not a full safety assessment. | Outpatient couples with a partner clinically diagnosed with depression, generally moderate severity Literature searches through 2018-02-19; earlier trials 8 studies / 316 participants | Original research [S07] Main results, dropouts versus individual psychotherapy. |
| F22 | Relationship-distress reduction favored couple therapy over individual psychotherapy: SMD=−0.50 (95% CI −0.97 to −0.02). Very-low-certainty evidence with substantial heterogeneity; not the same outcome as depressive symptoms. | Outpatient couples with a partner clinically diagnosed with depression, generally moderate severity Literature searches through 2018-02-19; earlier trials 6 studies / 187 participants | Original research [S07] Main results, relationship-distress level versus individual psychotherapy. |
| F23 | The risk ratio for persisting relationship distress was 0.71 (95% CI 0.51–0.98) versus individual psychotherapy. Very-low-certainty evidence; outcome definitions and thresholds differ from relationship satisfaction scales. | Outpatient couples with a partner clinically diagnosed with depression, generally moderate severity Literature searches through 2018-02-19; earlier trials 2 studies / 81 participants | Original research [S07] Main results, persistence of relationship distress. |
| F24 | Against no or minimal treatment, depressive symptoms favored couple therapy (SMD=−0.95, 95% CI −1.59 to −0.32), as did persistence of depression (RR=0.48, 0.32–0.70). Both findings have very-low-certainty evidence. Comparisons with no treatment must not be presented as superiority over individual therapy. | Outpatient couples with a partner clinically diagnosed with depression, generally moderate severity Literature searches through 2018-02-19; earlier trials Symptom level: 3 studies / 90 participants; persistence: 2 studies / 65 participants | Original research [S07] Main results, comparison with no/minimal treatment. |
Outcome, comparison group and certainty travel with the number. An SMD interval spanning zero is not proof of equivalence; a risk ratio is not a cure percentage. Findings against no/minimal treatment cannot be presented as superiority over individual psychotherapy. The review’s low or very low certainty limits firm conclusions, and its 2018 search date must remain visible.
What do England’s 2025–26 service records show?
The NHS experimental analysis recorded 2,638 qualifying Couples Therapy for Depression courses, averaging 11.0 treatment appointments. Its therapy-based recovery rate was 49.0%, while improvement was 44.6%.
| ID | Finding and qualification | Population, actual period and base | Original source and locator |
|---|---|---|---|
| F57 | The NHS tables recorded 2,638 qualifying Couples Therapy for Depression courses: 2,144 first in a referral, 427 second, 61 third and 6 fourth. A course requires at least two recorded treatment appointments; this is not 2,638 unique couples. | Recorded qualifying courses of Couples Therapy for Depression among referrals finishing treatment in the year; not distinct couples 2025-04-01 to 2026-03-31 2,638 qualifying courses; recovery denominator excludes 855 not at baseline caseness, leaving 1,783; appointment means and course definitions separate | Original research [S15] TBO Data Files 2025–26, Table 2 CSV; England / Couples_Therapy row; Table 4 total row. |
| F58 | Of those courses, 2,181 (82.7%) were delivered discretely and 457 (17.3%) concurrently with another therapy. Concurrent delivery complicates attribution; percentages describe course administration, not combined-treatment effectiveness. | Recorded qualifying courses of Couples Therapy for Depression among referrals finishing treatment in the year; not distinct couples 2025-04-01 to 2026-03-31 2,638 qualifying courses; recovery denominator excludes 855 not at baseline caseness, leaving 1,783; appointment means and course definitions separate | Original research [S15] TBO Table 3 CSV, England / Couples_Therapy row. |
| F59 | Couples Therapy for Depression averaged 11.0 treatment appointments per course: 28,989 appointments across 2,638 courses in the national table. This is a recorded service average, not a prescribed length or a count of unique couples. | Recorded qualifying courses of Couples Therapy for Depression among referrals finishing treatment in the year; not distinct couples 2025-04-01 to 2026-03-31 2,638 qualifying courses; recovery denominator excludes 855 not at baseline caseness, leaving 1,783; appointment means and course definitions separate | Original research [S15] TBO Table 5 CSV, Probdesc=null national total; coupappts / coupcot / coupmta. Main chapter, mean appointments. |
| F60 | Therapy-based recovery was 49.0% (874 of 1,783 initially eligible courses), reliable recovery 42.8% (764 of 1,783), and improvement 44.6% (1,177 of 2,638). Recovery excludes 855 non-cases at baseline; improvement uses the wider course base. These are symptom outcomes, not relationship recovery. Reconstructed denominators are explicit calculations C16–C20. | Recorded qualifying courses of Couples Therapy for Depression among referrals finishing treatment in the year; not distinct couples 2025-04-01 to 2026-03-31 2,638 qualifying courses; recovery denominator excludes 855 not at baseline caseness, leaving 1,783; appointment means and course definitions separate | Original research [S15] TBO Table 4 CSV: England / All / All / Total / Couples Therapy for Depression. Count_NotCaseness=855; Appendices B–C. |
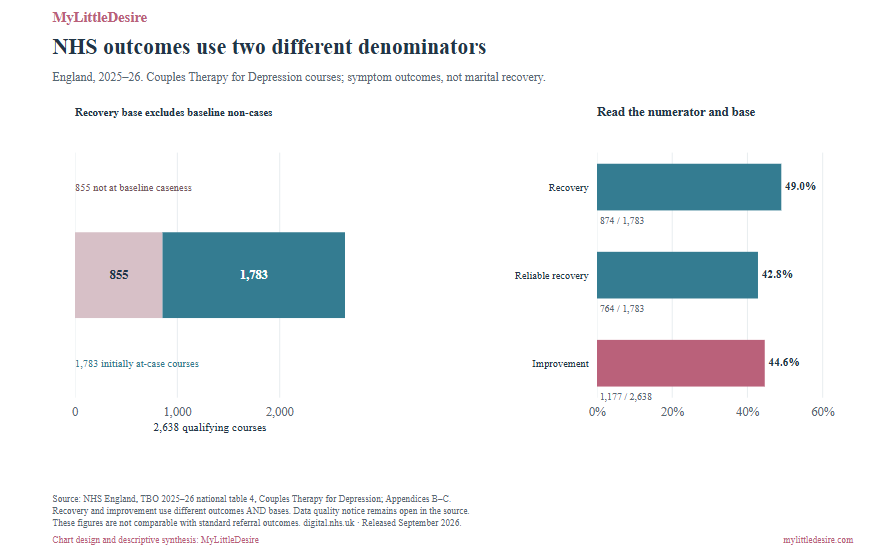
The percentages use different outcomes and bases. Recovery excludes 855 courses not at baseline caseness, leaving 1,783; improvement uses all 2,638 qualifying courses. Calculations C16–C20 reconstruct those bases and rates. These are symptom outcomes, not relationship recovery, and cannot be compared directly with standard referral-based NHS outcomes or targets. A course is not a unique couple, and an open data-quality notice remains part of the source context.
What did a structured online self-help program achieve?
In the original 300-couple OurRelationship trial, the program improved several outcomes relative to waitlist. The researchers explicitly described it as self-help rather than therapy.
| ID | Finding and qualification | Population, actual period and base | Original source and locator |
|---|---|---|---|
| F25 | The program was completed by 129 of the 151 couples assigned to it. That count corresponds to approximately 85.4%; the paper labels it 86%. Count-based arithmetic and the reported rounded label are separated because they do not agree under ordinary whole-percent rounding. | Self-selected distressed heterosexual couples, ages 21–64, married/engaged/cohabiting, both partners participating Before 2016 publication; exact calendar field dates not reported in checked manuscript; approximately two-month controlled phase 300 couples / 600 individuals; 151 assigned program and 149 waitlist; completer satisfaction base differs | Original research [S08] Original manuscript Results: Completion Rates; Methods allocation; see C10. |
| F26 | The controlled satisfaction effect was d=0.69. Individual change categories were 32% recovered, 25% improved, 36% unchanged and 7% deteriorated. The change categories are participant-level source classifications at last available measurement, not couples whose marriages were saved. Deterioration alone is not a causal harm estimate. | Self-selected distressed heterosexual couples, ages 21–64, married/engaged/cohabiting, both partners participating Before 2016 publication; exact calendar field dates not reported in checked manuscript; approximately two-month controlled phase 300 couples / 600 individuals; 151 assigned program and 149 waitlist; completer satisfaction base differs | Original research [S08] Results: Relationship Outcomes, first paragraph; Table 2 / Figure 2. |
| F27 | Relationship confidence improved versus waitlist with d=0.47; participant categories included 31% recovered, 64% without clinically significant improvement and 5% deteriorated. Confidence is a separate scale from satisfaction; do not merge their classifications. | Self-selected distressed heterosexual couples, ages 21–64, married/engaged/cohabiting, both partners participating Before 2016 publication; exact calendar field dates not reported in checked manuscript; approximately two-month controlled phase 300 couples / 600 individuals; 151 assigned program and 149 waitlist; completer satisfaction base differs | Original research [S08] Results: Relationship Outcomes, confidence paragraph. |
| F28 | The intervention reduced negative relationship quality with d=0.57, while its positive-quality effect was d=0.15. Effect directions are expressed as improvements in the source text; negative and positive quality are different constructs, not opposite ends of one item. | Self-selected distressed heterosexual couples, ages 21–64, married/engaged/cohabiting, both partners participating Before 2016 publication; exact calendar field dates not reported in checked manuscript; approximately two-month controlled phase 300 couples / 600 individuals; 151 assigned program and 149 waitlist; completer satisfaction base differs | Original research [S08] Results: Relationship Outcomes, negative/positive quality paragraph. |
| F29 | For negative quality, 24.3% were recovered and 16.9% improved; for positive quality, 12.3% were recovered and 5.3% improved. Deterioration was 6.0% and 23.2%, respectively. Same trial, separate outcomes and thresholds. Improved and recovered categories can be combined within an outcome, not across outcomes. | Self-selected distressed heterosexual couples, ages 21–64, married/engaged/cohabiting, both partners participating Before 2016 publication; exact calendar field dates not reported in checked manuscript; approximately two-month controlled phase 300 couples / 600 individuals; 151 assigned program and 149 waitlist; completer satisfaction base differs | Original research [S08] Results: Relationship Outcomes, clinical-change categories for quality. |
| F30 | Compared with waitlist, full-sample reductions in depressive symptoms had d=0.50 and reductions in anxiety symptoms d=0.21. These are symptom-scale changes in this relationship program, not diagnostic cure rates or a substitute for a disorder-specific treatment trial. | Self-selected distressed heterosexual couples, ages 21–64, married/engaged/cohabiting, both partners participating Before 2016 publication; exact calendar field dates not reported in checked manuscript; approximately two-month controlled phase 300 couples / 600 individuals; 151 assigned program and 149 waitlist; completer satisfaction base differs | Original research [S08] Results: Individual Outcomes; Table 4 / Figure 3. |
| F31 | The reported controlled effects were d=0.19 for work functioning, d=0.18 for quality of life and d=0.23 for perceived health. Self-reported functioning and single-item quality/health measures are not objective medical or employment outcomes. | Self-selected distressed heterosexual couples, ages 21–64, married/engaged/cohabiting, both partners participating Before 2016 publication; exact calendar field dates not reported in checked manuscript; approximately two-month controlled phase 300 couples / 600 individuals; 151 assigned program and 149 waitlist; completer satisfaction base differs | Original research [S08] Results: Individual Outcomes, full-sample paragraph; Table 4. |
| F32 | Among program completers, 94% reported being mostly or very satisfied with services and 97% would recommend the program to a friend. Completer satisfaction is not the percentage clinically recovered. Exact valid satisfaction-item denominator was not stated in the checked paragraph. | Couples/participants completing the program, per source satisfaction wording Before 2016 publication; exact calendar field dates not reported in checked manuscript; approximately two-month controlled phase Completer/item base differs from randomized N; exact valid response count unavailable | Original research [S08] Results: Couples’ Reaction to Intervention. |
The recovered-plus-improved satisfaction share is 57% of classified participants (C07), not a percentage of marriages saved. Corresponding quality totals are 41.2% for the negative-quality measure and 17.6% for positive quality (C08–C09), which are separate constructs. Completer satisfaction is a different outcome again. The reported completion count gives 85.4%, while the paper’s prose says 86%; that minor discrepancy is retained rather than hidden.
| Reported measure | Value | Who or what is counted |
|---|---|---|
| Completed the program | 129/151, approximately 85.4% (C10) | Couples assigned to the intervention; source prose says 86%. |
| Recovered or improved satisfaction | 57% (C07) | Participant-level clinical-change categories at last available measurement. |
| Recovered satisfaction | 32% | A narrower source-defined participant change category. |
| Mostly or very satisfied with services | 94% | Program completers; exact valid satisfaction-item base unpublished. |
Original data: Doss, Cicila, Georgia, Roddy, Nowlan, Benson and Christensen [S08]. This table is not a conversion funnel: the units and eligibility differ between rows.
For separately defined behaviors and populations, see cheating and infidelity statistics. The original self-help trial excluded ongoing affairs, limiting what it can establish about that subgroup.
What if only one partner participates in a relationship program?
A small pilot of OurRelationship for Individuals did not find statistically clear controlled relationship-outcome gains. Some self-reported individual-functioning outcomes improved, but maintenance was uneven.
| ID | Finding and qualification | Population, actual period and base | Original source and locator |
|---|---|---|---|
| F33 | The pilot did not detect significant intervention–waitlist differences in satisfaction (d=0.23), confidence (d=0.12), negative quality (d=−0.26) or positive quality (d=0.09). Null findings in a small pilot are not evidence of exact equality or evidence that individual psychotherapy cannot help. | Self-selected individuals in distressed heterosexual relationships; one partner participates Before 2017 publication; exact calendar field dates unavailable; one-month controlled phase and three-month follow-up 90 individuals; 46 intervention / 44 waitlist; 80% women | Original research [S09] Results: Aim 1; Table 2. |
| F34 | During the controlled month, quality of life (d=0.69), work functioning (d=0.44) and perceived health (d=0.49) improved significantly versus waitlist. These are self-reported individual outcomes, despite no statistically clear relationship-outcome gains. | Self-selected individuals in distressed heterosexual relationships; one partner participates Before 2017 publication; exact calendar field dates unavailable; one-month controlled phase and three-month follow-up 90 individuals; 46 intervention / 44 waitlist; 80% women | Original research [S09] Results: Aim 1; Table 2. |
| F35 | Depressive and anxiety symptom changes did not differ significantly from waitlist, with d=−0.05 and d=−0.23, respectively. Direction favors lower symptoms, but the study did not establish a reliable controlled improvement in these outcomes. | Self-selected individuals in distressed heterosexual relationships; one partner participates Before 2017 publication; exact calendar field dates unavailable; one-month controlled phase and three-month follow-up 90 individuals; 46 intervention / 44 waitlist; 80% women | Original research [S09] Results: Aim 1, individual symptom outcomes; Table 2. |
| F36 | From the end of the intervention to three-month follow-up, the intervention group’s work functioning worsened with d=−0.48 (p=0.040). Within-group follow-up only; no continuing untreated control. Follow-up individual-functioning data were missing in 21.7% of intervention cases, so this is qualified evidence of limited maintenance. | Self-selected individuals in distressed heterosexual relationships; one partner participates Before 2017 publication; exact calendar field dates unavailable; one-month controlled phase and three-month follow-up 90 individuals; 46 intervention / 44 waitlist; 80% women | Original research [S09] Results: Aim 2, follow-up; Table 2. |
This is not a study showing that individual psychotherapy cannot help. It tests one specific relationship self-help adaptation in 90 selected people. Follow-up work functioning declined, and substantial missing data plus the absence of a continuing untreated control limit interpretation. Null findings do not prove zero effect.
Do annual relationship checkups show lasting benefits?
A brief Marriage Checkup with a one-year booster showed outcome-specific effects. The intimacy contrast remained statistically clear at two years; the relationship-distress contrast did not.
| ID | Finding and qualification | Population, actual period and base | Original source and locator |
|---|---|---|---|
| F37 | Across follow-ups, the Marriage Checkup’s mean relationship-distress effect was d=0.23, with individual time-point effects from 0.11 to 0.39; the two-year between-group difference was not significant. The mean across measurement points is not the effect specifically at two years. | Cohabiting married couples seeking checkups; most were not clinically distressed Before 2014 publication; exact calendar field dates unavailable; two-year follow-up with one-year booster 215 enrolled couples; 209 opposite-sex couples analyzed (108 intervention / 101 control); six same-sex couples excluded from reported models | Original research [S10] Results: Marital Satisfaction; abstract; Table 2. |
| F38 | Intimacy effects ranged from d=0.20 to 0.55, averaging d=0.37 across follow-ups; the two-year contrast remained significant (p=0.002). A result for this checkup/booster design and selected sample, not a general therapy success percentage. | Cohabiting married couples seeking checkups; most were not clinically distressed Before 2014 publication; exact calendar field dates unavailable; two-year follow-up with one-year booster 215 enrolled couples; 209 opposite-sex couples analyzed (108 intervention / 101 control); six same-sex couples excluded from reported models | Original research [S10] Results: Intimacy; abstract; Table 2. |
| F39 | The average felt-acceptance effect was d=0.34 for women and d=0.25 for men. Women’s gains were more sustained at later assessments. Sex-specific means across follow-ups. A difference of means does not by itself establish a statistically significant moderation effect; the source’s inconsistent male range endpoint is not used. | Cohabiting married couples seeking checkups; most were not clinically distressed Before 2014 publication; exact calendar field dates unavailable; two-year follow-up with one-year booster 215 enrolled couples; 209 opposite-sex couples analyzed (108 intervention / 101 control); six same-sex couples excluded from reported models | Original research [S10] Results: Acceptance; abstract and Table 2. |
Most participants were not initially clinically distressed. The mean effect across follow-up measurements is not the last follow-up effect. Six same-sex couples were excluded from the reported models, and the selected predominantly white sample limits generalization.
What does the Australian video-delivery study actually test?
The small Curtin study did not detect significant differences between video and face-to-face delivery on the retained outcomes. Both groups received the six-session Couple CARE educational intervention inside the same clinic.
| ID | Finding and qualification | Population, actual period and base | Original source and locator |
|---|---|---|---|
| F40 | Mean DAS adjustment was 100.83 before treatment in both groups; post-treatment means were 106.47 by video and 107.33 face-to-face. The group-by-time interaction was not significant (p=0.821). These are source means in a small same-clinic study, not a demonstrated equivalence of home video and office therapy. | Community couples screened for eligibility; high distress and certain acute needs excluded Before 2022 publication; linked thesis 2015; exact calendar collection dates unavailable in checked article 30 couples / 60 individuals randomized, 15 couples per condition; 28 couples at follow-up | Original research [S11] Table 1; Results: Dyadic Adjustment; original article. |
| F41 | Client satisfaction averaged 28.70 for video and 28.47 face-to-face on the 8–32 CSQ-8 scale, without a significant group difference (p=0.833). Service satisfaction is not symptom remission or relationship recovery. | Community couples screened for eligibility; high distress and certain acute needs excluded Before 2022 publication; linked thesis 2015; exact calendar collection dates unavailable in checked article 30 couples / 60 individuals randomized, 15 couples per condition; 28 couples at follow-up | Original research [S11] Results: Participant Satisfaction; CSQ-8 method. |
| F42 | Working-alliance means rose from 194.63 to 202.77 for video and from 202.17 to 212.10 face-to-face between sessions 3 and 6; the interaction was nonsignificant (p=0.650). Working alliance is an experience/process scale; no alliance follow-up after treatment was collected. | Community couples screened for eligibility; high distress and certain acute needs excluded Before 2022 publication; linked thesis 2015; exact calendar collection dates unavailable in checked article 30 couples / 60 individuals randomized, 15 couples per condition; 28 couples at follow-up | Original research [S11] Table 3; Results: Working Alliance. |
| F43 | Across both delivery groups, pre/post symptom changes had eta-squared values of 0.09 for depression, 0.05 for anxiety and 0.12 for stress; depression change was not maintained clearly at follow-up (p=0.076). Eta squared is not Cohen d or a percent symptom reduction. Both groups received the intervention, so time effects alone do not isolate its causal effect. | Community couples screened for eligibility; high distress and certain acute needs excluded Before 2022 publication; linked thesis 2015; exact calendar collection dates unavailable in checked article 30 couples / 60 individuals randomized, 15 couples per condition; 28 couples at follow-up | Original research [S11] Results: Depression, Anxiety and Stress, follow-up contrasts. |
For video, the therapist sat in another room; participants did not join from their own homes. The study was not powered to establish equivalence for small differences. Service satisfaction, alliance, symptom changes and relationship adjustment are different outcomes. Some reported test-statistic/p-value combinations were inconsistent and are excluded from the numeric core.
Does adding more coaching improve online-program results?
In an adaptive low-income-couple trial, full, automated and contingent support all improved satisfaction relative to waitlist. Pre/post effects and completion odds were not reliably different across the active formats.
| ID | Finding and qualification | Population, actual period and base | Original source and locator |
|---|---|---|---|
| F44 | Program completion was 65% with full coaching, 59% with automated support and 54% with contingent coaching; active formats did not have reliably different completion odds. A numerical six-point gap is not an established coaching benefit. Completion is not clinical recovery. | Help-seeking low-income couples; adaptive allocation, not an all-adult sample Registration NCT03568565; collection completed October 2020 per original trial protocol; exact start not verified 740 couples; 1,472 individuals after eight consent withdrawals; full-coach 226, automated 145, contingent 145, waitlist 224 | Original research [S12] Abstract; Results: Program Completion; Figure 2. |
| F45 | Pre/post satisfaction effects versus waitlist were d=0.46 for full coaching (95% credible interval 0.33–0.59), 0.40 automated (0.25–0.55) and 0.47 contingent (0.32–0.61). The active coaching groups were not reliably different. Credible intervals describe Bayesian posterior uncertainty, not frequentist confidence intervals. | Help-seeking low-income couples; adaptive allocation, not an all-adult sample Registration NCT03568565; collection completed October 2020 per original trial protocol; exact start not verified 740 couples; 1,472 individuals after eight consent withdrawals; full-coach 226, automated 145, contingent 145, waitlist 224 | Original research [S12] Results: Relationship Satisfaction, pre/post paragraph; Table 1. |
| F46 | In the contingent group, 124 of 145 couples were offered additional coaching after insufficient progress; 59 subsequently completed at least one coaching call. Call uptake uses 124 offered couples as its denominator, not all 145 contingent couples or all study participants. | Help-seeking low-income couples; adaptive allocation, not an all-adult sample Registration NCT03568565; collection completed October 2020 per original trial protocol; exact start not verified 740 couples; 1,472 individuals after eight consent withdrawals; full-coach 226, automated 145, contingent 145, waitlist 224 | Original research [S12] Results: Program Completion, contingent-coach paragraph. |
| F47 | Over the next four months, automated-support couples had additional satisfaction gains (d=0.19, credible interval 0.02–0.36); full and contingent groups had changes of −0.03 and 0.04 with intervals spanning zero. These are additional changes after the program, not the total treatment effect or an all-purpose advantage of automated support. | Help-seeking low-income couples; adaptive allocation, not an all-adult sample Registration NCT03568565; collection completed October 2020 per original trial protocol; exact start not verified 740 couples; 1,472 individuals after eight consent withdrawals; full-coach 226, automated 145, contingent 145, waitlist 224 | Original research [S12] Results: Relationship Satisfaction, follow-up paragraph. |
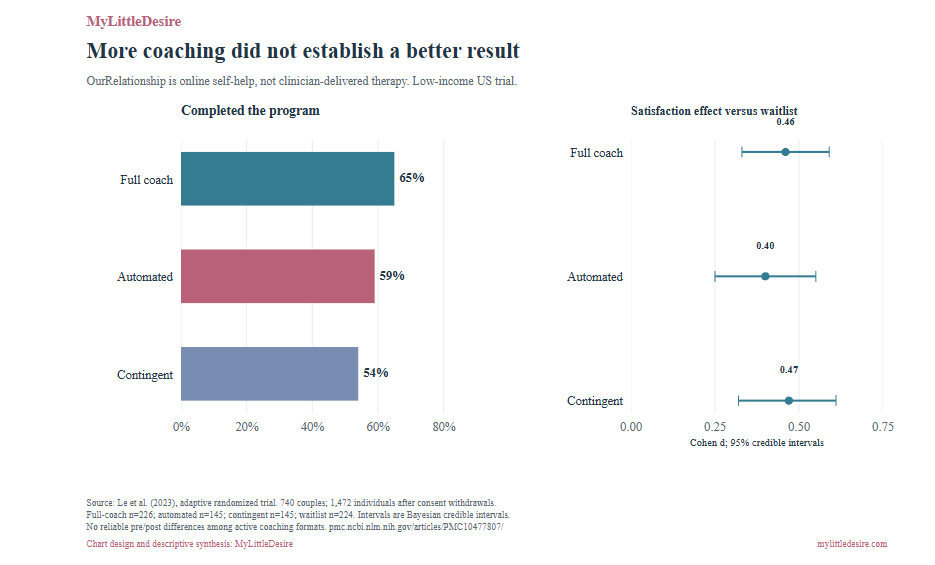
Full-coach completion was numerically six points above automated support (C11), without a reliable completion difference. Of those offered extra contingent coaching, 47.6% completed at least one call (C12). Completion, additional contact and satisfaction change are separate measures. Source intervals here are Bayesian credible intervals, unlike the confidence intervals in the Cochrane review.
What does the 2026 economic model estimate?
A 2026 analysis estimated program-delivery costs and modeled broader benefits using earlier OurRelationship trials. In 2024 dollars, its rounded inputs were $280 delivery cost and $1,847 gross benefits per participant.
| ID | Finding and qualification | Population, actual period and base | Original source and locator |
|---|---|---|---|
| F48 | Estimated delivery cost per participant was $326 in the first trial and $252 in the second; the weighted average was $280 in 2024 US dollars. Provider delivery expenditure, not a current consumer price, insured copay or cost per couple. | Model based on treated participants in two earlier OurRelationship trials; not a new population survey Economic modeling of earlier 2016 and 2020 trials; costs/benefits expressed in 2024 US dollars Trial 1: 151 program couples; trial 2: 248 program couples. Control totals and symptom effects drawn from original trials. | Original research [S13] Results: Costs; Table 1. |
| F49 | The model estimated $1,847 in gross benefits per participant and a benefit–cost ratio of $6.60 per $1 spent. Not observed cash savings. The source’s ambiguous use of net-present-value terminology is not adopted; C14 subtracts the rounded delivery cost explicitly. | Model based on treated participants in two earlier OurRelationship trials; not a new population survey Economic modeling of earlier 2016 and 2020 trials; costs/benefits expressed in 2024 US dollars Trial 1: 151 program couples; trial 2: 248 program couples. Control totals and symptom effects drawn from original trials. | Original research [S13] Results: Benefits and Cost–Benefit Analysis; see C14–C15. |
| F50 | Sensitivity scenarios ranged from $1.88 to $22.06 in estimated benefits per dollar spent. This is an assumption-driven scenario range, not a confidence interval, guaranteed return or reimbursement forecast. | Model based on treated participants in two earlier OurRelationship trials; not a new population survey Economic modeling of earlier 2016 and 2020 trials; costs/benefits expressed in 2024 US dollars Trial 1: 151 program couples; trial 2: 248 program couples. Control totals and symptom effects drawn from original trials. | Original research [S13] Results: Sensitivity Analyses; Figure 1. |
The ratio reproduces approximately 6.60× (C15), and subtracting rounded costs gives approximately $1,567 in modeled net benefits (C14). These are assumption-dependent estimates, not observed household cash savings or 2027 therapy prices. Initial development and marketing are excluded. The source’s conflicting gross/net terminology and an unreconciled alcohol-effect interval were not carried into the publishable claims.
What comparisons does MyLittleDesire contribute?
The contribution is convenient synthesis, explicit denominators, chart design and reproducible arithmetic. Several contrasts are already visible or discussed in the original reports. These are not new fieldwork, newly estimated treatment effects or novel scientific discoveries.
| ID | Comparison | Result | Named-input calculation and boundary | Original research |
|---|---|---|---|---|
| C01 | Lifetime attendance: age 65+ minus 18–29 | 15.0 percentage points | yg_use65-yg_use18 Same April 2025 poll; cross-sectional age gap with unequal lifetime exposure. Not a trend or causal age effect. | YouGov US [S01] |
| C02 | Lifetime attendance: highest minus lowest household-income band | 14.0 percentage points | yg_inc_high-yg_inc_low Unadjusted association, not a measured financial-access effect. | YouGov US [S01] |
| C03 | Very-important attitude: age 18–29 minus 65+ | 15.0 percentage points | yg_att18-yg_att65 January/February 2025 attitude question, not attendance; do not join respondents across polls. | YouGov US [S02] |
| C04 | Therapy considered very or somewhat important | 47% | yg_att_very+yg_att_some Mutually exclusive response categories in one question; no claim every respondent needs counseling. | YouGov US [S02] |
| C05 | Post-breakdown support: friend minus professional | 47.0 percentage points | ra_break_friend-ra_break_prof Same breakdown base, n=1,674. Categories overlap; not a count relying exclusively on friends. | Relationships Australia / Social Research Centre [S03] |
| C06 | Most-meaningful-relationship support: self-management minus professional | 40.0 percentage points | ra_self-ra_prof Same B12 base, n=2,995; includes non-romantic ties and overlapping answers. Not unmet couples-therapy need. | Relationships Australia / Social Research Centre [S03] |
| C07 | OurRelationship satisfaction: recovered plus improved | 57% | or_recovered+or_improved Separate source classifications on the same satisfaction outcome; participant-level, not percent of couples saved. | Doss, Cicila, Georgia, Roddy, Nowlan, Benson and Christensen [S08] |
| C08 | OurRelationship negative quality: recovered plus improved | 41.2% | or_neg_rec+or_neg_imp Mutually exclusive source categories within negative quality; not merged with positive-quality outcomes. | Doss, Cicila, Georgia, Roddy, Nowlan, Benson and Christensen [S08] |
| C09 | OurRelationship positive quality: recovered plus improved | 17.6% | or_pos_rec+or_pos_imp Separate positive-quality measure; no newly estimated clinical threshold. | Doss, Cicila, Georgia, Roddy, Nowlan, Benson and Christensen [S08] |
| C10 | OurRelationship completion reproduced from reported counts | 85.4% | or_complete_n/or_assigned_n*100 129/151=85.4%; source prose reports 86%. Preserve the count/label discrepancy rather than silently treating them as identical. | Doss, Cicila, Georgia, Roddy, Nowlan, Benson and Christensen [S08] |
| C11 | Completion: full coaching minus automated support | 6.0 percentage points | coach_full_complete-coach_auto_complete Numerical difference only; original Bayesian completion comparisons were not reliable. | Le, Roddy, Rothman, Salivar, Guttman and Doss [S12] |
| C12 | Additional call uptake among offered contingent coaching | 47.6% | coach_called_n/coach_offered_n*100 Denominator is 124 offered extra coaching, not the 145 originally in the contingent group. | Le, Roddy, Rothman, Salivar, Guttman and Doss [S12] |
| C13 | Five-year clinically significant improvement: IBCT minus TBCT | 4.1 percentage points | ibct_improve-tbct_improve Descriptive difference between two active treatments; longer-term differences nonsignificant. Exact satisfaction valid bases unavailable in abstract. | Christensen, Atkins, Baucom and Yi [S05] |
| C14 | Modeled gross benefits less rounded delivery cost | Approximately $1,567 per participant (2024 USD; modeled) | cost_gross-cost_avg Rounded source inputs. Approximate modeled net benefit, not observed cash saved; excludes development and marketing costs from delivery estimate. | Doss, Guttman, Metser-Waldman, Ajmera and Dopp [S13] |
| C15 | Modeled benefit/cost ratio reproduced | Approximately 6.60× | cost_gross/cost_avg Ratio of rounded modeled gross benefits to delivery cost. Approximation reproduces the reported 6.60, not a guaranteed return. | Doss, Guttman, Metser-Waldman, Ajmera and Dopp [S13] |
| C16 | NHS baseline-case recovery denominator | 1,783 courses | nhs_courses-nhs_notcase For national therapy-based recovery; excludes 855 not at baseline caseness. Not distinct couples. | NHS England [S15] |
| C17 | NHS therapy-based recovery reproduced | 49.0% | nhs_recovery_n/(nhs_courses-nhs_notcase)*100 874/1,783; symptom caseness outcome, not marital satisfaction or standard referral-based recovery. | NHS England [S15] |
| C18 | NHS therapy-based improvement reproduced | 44.6% | nhs_improve_n/nhs_courses*100 1,177/2,638; wider denominator than recovery. Different numerator and outcome as well as denominator. | NHS England [S15] |
| C19 | NHS first-course share among qualifying courses | 81.3% | nhs_first/nhs_courses*100 2,144/2,638 distinct recorded courses, not a share of English couples attending therapy. | NHS England [S15] |
| C20 | NHS therapy-based reliable recovery reproduced | 42.8% | nhs_relrec_n/(nhs_courses-nhs_notcase)*100 764/1,783; source therapy-based reliable recovery is not directly comparable with standard NHS referral outcomes or targets. | NHS England [S15] |
What should readers check before quoting?
Is there one verified couples-therapy success rate?
No. Studies use different participants, treatments, outcomes and follow-up periods. A service satisfaction rating, reliable improvement, clinical recovery and remaining married cannot be substituted for each other.
Does an effect size of 0.69 mean 69% recovered?
No. Cohen d and Hedges g express standardized differences or changes. A proportion recovered needs a defined clinical threshold and denominator.
Is an online relationship program the same as therapy?
Not necessarily. The original OurRelationship trial explicitly called its program self-help and said its coaches did not provide therapy. The intervention type stays labeled here.
Why can the NHS recovery percentage exceed its improvement percentage?
The outcome rules and denominators differ. Recovery excludes courses not at baseline caseness; the wider improvement base includes them. The counts and calculations are provided.
Does a nonsignificant difference prove that two formats are equivalent?
No. A study may lack enough precision to distinguish them. Formal equivalence or noninferiority requires an appropriate design and prespecified margin.
Can these results predict what a particular couple should do?
No. The findings describe defined study samples and service records. Important trials excluded particular risks and needs, so they do not establish that joint treatment is appropriate in every situation.
Are there comparable national figures for all four target countries?
No. US surveys, England service records and Australian support research differ substantially. This review did not establish a Canada-wide counseling attendance or recovery rate.
How were these findings selected and verified?
We targeted original clinical studies, surveys, systematic reviews, service statistics and an economic analysis relevant to relationship support. Research was checked on October 27, 2026. This is a targeted synthesis, not an exhaustive systematic review or a new clinical trial.
Each database row records a stable finding ID, values and units, original URL, publication and collection periods, geography, population, available sample size, method, exact locator, definitions, caveats and verification status. Sources that publish only an overall sample do not supply an invented valid subgroup base. Related response categories remain grouped.
Original questionnaires, tables and available full manuscripts were consulted. Two sources—the 2020 broad meta-analysis and 2010 five-year report—are quantitatively verified through their original author abstracts; full main methods/tables were not independently available. Official NCBI PubMed XML and the public BioC text-mining service supplied original records/manuscripts when normal pages challenged retrieval. Source PDFs and cached publisher text are not redistributed.
Reports do not equal independent samples. Reviews overlap with trials, the coaching paper has related earlier publications, and the 2026 economic model reuses earlier OurRelationship data, including the 300-couple trial. Three survey reports use YouGov panel data, including the commercially sponsored Grow Therapy poll; they supply 11 of the 60 findings. The model is not a fresh outcomes replication.
The 20 calculations use named inputs within the same source, with percentage points, percentages, counts, ratios and dollar units kept distinct. Decimal rounding avoids floating-point display artifacts. We did not pool country rates, subtract unrelated standardized effects, manufacture missing intervals, recalculate significance tests or reanalyze patient microdata. Frequentist confidence intervals and Bayesian credible intervals are labeled separately.
What limits the conclusions?
- Selected trials, routine clinical records, weighted opt-in polls and probability-panel support surveys have different populations and purposes.
- Therapy, self-help, checkups and educational interventions cannot be treated as one standardized treatment.
- Exact calendar collection dates and valid subgroup bases are unavailable for some reports. Abstract-only sources have narrower verification than full-text studies.
- Short follow-up, dropout, missing assessments, retrospective recall and unadjusted case mix can influence results. Some trials excluded important risk groups.
- Several studies exclude or underrepresent same-sex couples, ethnic groups and other populations. No comparable four-country national rate was established.
- Source inconsistencies in counts, means, test details and cost terminology are documented; affected values were withheld or explicitly qualified.
- Model-based economic benefits are not observed household savings. Service-course recovery is not relationship recovery, and staying married is not the only possible goal of support.
Complete original-source bibliography
- S01 · YouGov US. Half of Americans say they’ve been cheated on; one-third say they have been the cheater. Published: 2025-05-20. Actual period: 2025-04-18 to 2025-04-21. Sample: Overall n=1,125; valid counseling item unweighted n=1,122; age bases 217 / 205 / 405 / 295; income bases 423 / 347 / 260. Method: Weighted opt-in online panel; demographic and political targets; original topline and cross-tabs inspected. Limits: Lifetime self-report, not current utilization. Age groups have unequal years of opportunity. Income differences are unadjusted and do not establish an access mechanism or effect. US citizens are not all US residents. Supporting original material: Original tables, methods or manuscript.
- S02 · YouGov US. What do Americans think are the keys to a successful relationship?. Published: 2025-02-07. Actual period: Item survey January 28 to February 3, 2025; broader release also includes January 29 to February 1. Sample: Overall 2,167; couples-therapy item unweighted n=1,068; age bases 189 / 242 / 393 / 244. Method: Weighted opt-in online panel and matched demographic/political targets; original PDF item 3AC inspected. Limits: Belief about relationship success is not therapy use or treatment response. Item base is smaller than overall survey. Rounded categories may not total 100 in subgroups. Supporting original material: Original tables, methods or manuscript.
- S03 · Relationships Australia / Social Research Centre. Relationship Indicators 2024. Published: 2024-12-11 report release. Actual period: 2024-08-19 to 2024-09-01. Sample: Overall 3,004; meaningful-relationship item n=2,995; breakdown n=1,674; still-affected subgroup n=609. Method: Life in Australia probability-based panel, weighted; 2,968 online and 36 offline interviews; longitudinal respondents plus replenishment. Limits: General relationship support, not a couples-therapy attendance rate. Professional support can include counselors, GPs or mediators depending on item. Multiple sources/strategies can overlap. Different questions have different bases. Supporting original material: Original tables, methods or manuscript.
- S04 · Roddy, Walsh, Rothman, Hatch and Doss. Meta-analysis of couple therapy: Effects across outcomes, designs, timeframes, and other moderators. Published: 2020-07 journal issue. Actual period: Studies published before the 2020 review; individual field periods not verified from abstract. Sample: 58 studies representing 40 unique samples and 2,092 couples. Method: Random-effects meta-analysis; original author abstract supplied through official NCBI PubMed XML. Limits: Within-group pre/post effects are not randomized treatment-minus-control effects, success percentages or probabilities. Abstract-level verification; full main methods/tables not independently accessible here. Studies overlap with other reviews and some trial sources in this hub. Supporting original material: Original tables, methods or manuscript.
- S05 · Christensen, Atkins, Baucom and Yi. Marital status and satisfaction five years following a randomized clinical trial comparing traditional versus integrative behavioral couple therapy. Published: 2010-04 journal issue. Actual period: Treatment and five-year follow-up completed before 2010; exact calendar dates unavailable in checked original abstract. Sample: 134 couples overall; marital status obtained for all 134; exact valid satisfaction subgroup bases not given in abstract. Method: Randomized two-active-treatment trial; approximately eight months of therapy; repeated follow-up over five years. Original abstract verified through official PubMed XML. Limits: No untreated control for the five-year contrast. Both groups received therapy. Reported between-treatment differences converged and were nonsignificant at longer follow-up. Satisfaction improvement is not equivalent to staying married. Full 2010 tables/methods unavailable in this review. Supporting original material: Original tables, methods or manuscript, Original tables, methods or manuscript.
- S06 · Hewison, Casey and Mwamba / Tavistock Relationships. The Effectiveness of Couple Therapy: Clinical Outcomes in a Naturalistic United Kingdom Setting. Published: 2016; Psychotherapy 53(4), 377–387. Actual period: Clinical records from 2008 through 2014-08-31. Sample: 877 individuals overall; retained GRIMS change table n=412. CORE change-table n=432 conflicts with text n=423 and is withheld.. Method: Retrospective nonrandomized single-clinic study; hierarchical models use available assessments, sometimes an in-therapy last assessment when final data absent. Limits: No untreated comparison; selection, missing data and variable therapy duration limit causal interpretation. End-of-therapy data only 425/877 (48.41%). Source GRIMS pooled post-mean and CORE change-table base inconsistencies withheld. Supporting original material: Original tables, methods or manuscript.
- S07 · Barbato, D’Avanzo and Parabiaghi / Cochrane. Couple therapy for depression. Published: 2018-06-08. Actual period: Literature searches through 2018-02-19; earlier trials. Sample: 14 studies / 651 participants overall; each outcome/comparison has its own study count and participant base. Method: Systematic review and random-effects meta-analysis of randomized/quasi-randomized studies; source-reported GRADE certainty retained. Limits: Evidence low or very low certainty. No evidence of a difference is not proof of equivalence. Different outcomes and comparison groups cannot be pooled into one success rate. No trial reported harmful effects, which does not establish no harms. Supporting original material: Original tables, methods or manuscript.
- S08 · Doss, Cicila, Georgia, Roddy, Nowlan, Benson and Christensen. A Randomized Controlled Trial of the Web-Based OurRelationship Program: Effects on Relationship and Individual Functioning. Published: Online 2016-01-25; issue 2016-04. Actual period: Before 2016 publication; exact calendar field dates not reported in checked manuscript; approximately two-month controlled phase. Sample: 300 couples / 600 individuals; 151 assigned program and 149 waitlist; completer satisfaction base differs. Method: Preregistered randomized trial; hierarchical models; original author manuscript via public NCBI BioC. Explicitly described by researchers as self-help, not therapy; coaches did not offer therapy.. Limits: Not clinician-delivered therapy or a representative population sample. Excluded fear/injury-related partner violence, ongoing affairs, concrete separation plans and several other risks. Individual change categories are not percentages of couples saved. Satisfaction of completers has selection bias. Authors have program interests. Supporting original material: Original tables, methods or manuscript, Original tables, methods or manuscript.
- S09 · Nowlan, Roddy and Doss. The Online OurRelationship Program for Relationally Distressed Individuals: A Pilot Randomized Controlled Trial. Published: 2017-09 journal issue; manuscript available 2018. Actual period: Before 2017 publication; exact calendar field dates unavailable; one-month controlled phase and three-month follow-up. Sample: 90 individuals; 46 intervention / 44 waitlist; 80% women. Method: Pilot randomized self-help trial, hierarchical models; separate nonrandom matched comparison with earlier couple version is not used for causal head-to-head claims. Limits: This is a relationship self-help program for one participating partner, not a test of individual psychotherapy. Small sample, substantial follow-up missingness and no continued waitlist control at three months. Program-related interests. Supporting original material: Original tables, methods or manuscript, Original tables, methods or manuscript.
- S10 · Cordova and colleagues. The Marriage Checkup: A Randomized Controlled Trial of Annual Relationship Health Checkups. Published: Online 2014-06-16; issue 2014-08. Actual period: Before 2014 publication; exact calendar field dates unavailable; two-year follow-up with one-year booster. Sample: 215 enrolled couples; 209 opposite-sex couples analyzed (108 intervention / 101 control); six same-sex couples excluded from reported models. Method: Randomized brief assessment/feedback intervention versus waitlist; annual booster; latent growth models and imputation. Limits: Preventive/checkup format, not an intensive therapy trial in all-distressed couples. Selected, predominantly white sample. Mean effect across follow-ups is not the final two-year effect. Supporting original material: Original tables, methods or manuscript, Original tables, methods or manuscript.
- S11 · Kysely, Bishop, Kane, McDevitt, De Palma and Rooney / Curtin University. Couples Therapy Delivered Through Videoconferencing: Effects on Relationship Outcomes, Mental Health and the Therapeutic Alliance. Published: 2022-02-04; volume labeled 2021. Actual period: Before 2022 publication; linked thesis 2015; exact calendar collection dates unavailable in checked article. Sample: 30 couples / 60 individuals randomized, 15 couples per condition; 28 couples at follow-up. Method: Randomized delivery comparison of six-session Couple CARE behavioral education; dyadic mixed models; three-month follow-up. Limits: Both video and face-to-face participants attended the same clinic, with therapist in a separate room for video. Not home teletherapy, and null differences do not prove equivalence. Small study underpowered for small delivery differences. Some reported F/p combinations appear inconsistent; affected test details withheld. Supporting original material: Original tables, methods or manuscript, Original tables, methods or manuscript.
- S12 · Le, Roddy, Rothman, Salivar, Guttman and Doss. A randomized controlled trial of the online OurRelationship program with varying levels of coach support. Published: Online 2023-08-28; journal issue 2023-12. Actual period: Registration NCT03568565; collection completed October 2020 per original trial protocol; exact start not verified. Sample: 740 couples; 1,472 individuals after eight consent withdrawals; full-coach 226, automated 145, contingent 145, waitlist 224. Method: Preregistered partial sequential multiple assignment trial; Bayesian models and multiple imputation; original manuscript and protocol checked. Limits: Relationship self-help/education, not clinician therapy. Coaching models contain adaptive rerandomization. Bayesian 95% credible intervals are not frequentist confidence intervals. Completion is not recovery; no reliable pre/post differences between active coaching formats. Program-related interests. Supporting original material: Original tables, methods or manuscript, Original tables, methods or manuscript.
- S13 · Doss, Guttman, Metser-Waldman, Ajmera and Dopp. Economic Costs and Benefits of the Digital OurRelationship Program for Distressed Couples. Published: 2026-09 journal issue; publicly available before October review. Actual period: Economic modeling of earlier 2016 and 2020 trials; costs/benefits expressed in 2024 US dollars. Sample: Trial 1: 151 program couples; trial 2: 248 program couples. Control totals and symptom effects drawn from original trials.. Method: Cost–benefit model using grant delivery costs and Washington State Institute for Public Policy assumptions; lifetime effect decay, benefit-overlap adjustment and sensitivity analysis. Limits: Benefits are modeled, not observed household cash savings. Delivery costs exclude initial development and marketing; university rent estimated. Same trial participants as earlier reports, not independent replication. Source calls $1,847 both total benefits and net present value; the latter label is withheld. Supporting original material: Original tables, methods or manuscript.
- S14 · Grow Therapy / YouGov. 2026 couples therapy survey: Growing stronger together. Published: Displayed updated 2026-06-24. Actual period: 2025-12-18 to 2025-12-22. Sample: 2,514 adults overall; valid item/attendee/subgroup counts and precision not published in checked page. Method: Commercially commissioned online YouGov panel poll; weighted; random invitations within panel; sponsor describes results as representative. Full questionnaire and cross-tabs not available in checked publication.. Limits: Commercial sponsor and retrospective self-reports. Reported improvement has no clinical threshold, standardized treatment, fixed follow-up or control group. It is not an experimental therapy success rate. Do not infer early therapy prevents divorce from divorced-versus-married prevalence.
- S15 · NHS England. NHS Talking Therapies 2025–26: Additional analysis of therapy-based outcomes. Published: 2026-09-24; edited 2026-09-25. Actual period: 2025-04-01 to 2026-03-31. Sample: 2,638 qualifying courses; recovery denominator excludes 855 not at baseline caseness, leaving 1,783; appointment means and course definitions separate. Method: Original NHS experimental therapy-based analysis; national CSV rows in TBO tables 2–5; courses require at least two attended recorded-therapy treatment appointments; questionnaire outcomes based on course start/end. Limits: Course counts are not unique couples or referrals. Therapy-based symptom recovery is not relationship recovery and is not comparable to standard referral-based NHS outcomes. Nonrandom clinical case mix; not an effectiveness league table. Open source quality notice concerns presenting complaint and one provider gender field; aggregate impact not quantified. Supporting original material: Original tables, methods or manuscript, Original tables, methods or manuscript.
Text retrieval: NCBI BioC documentation. The original publisher links and DOIs remain authoritative.
How to cite this resource
For an underlying survey or clinical finding, consult and cite the original research. Credit MyLittleDesire for this synthesis, a clearly labeled calculation or the chart design. Retain the original population, actual period and limitations. MyLittleDesire did not conduct the source trials or surveys.
MyLittleDesire. Couples Therapy and Counseling Statistics 2027: Use, Outcomes and Access. 2027 editorial edition. https://mylittledesire.com/couples-therapy-statistics/. Add the actual access date when required.