Wanting a relationship, looking for one, feeling ready and planning marriage describe different intentions. This resource brings the original questions together so writers can quote the right figure and make useful comparisons. It covers US research alongside clearly labeled British, Canadian and Australian evidence.
What does a dating-intentions statistic measure?
Start with who answered, what they were asked and whether the number describes a wish, a search, readiness, an expectation or observed behavior.
| Term | Meaning | Interpretation |
|---|---|---|
| Single | A relationship-status category defined by each study. | Pew excludes marriage, cohabitation and committed romance. Other studies have different entry criteria. |
| Open to a relationship | Willingness to consider a relationship, including conditional willingness. | Does not necessarily mean active searching, immediate readiness or marriage plans. |
| Actively seeking | A current search intention under the question’s wording. | Different from actually having dates, frequency or being open if the right person appears. |
| Readiness | A self-rating, often with several intensity levels. | Very ready, mostly ready and a hypothetical perfect-partner decision are separate measures. |
| Committed/exclusive | The source’s stated relationship form or goal. | A committed nonmarital relationship can be wanted without a wish to marry. |
| Marriage wish / expectation | Wanting marriage versus believing or considering that it will happen. | A yes-or-uncertain analysis group is not a group of definite planners. |
| Main reason / multiple reasons | A single choice versus several allowed responses. | Different response formats cannot support a country ranking or a pooled average. |
| Ideal / actual timing | Opinion about how long people should wait versus observed relationship behavior. | An ideal-timing plurality is not a majority, actual median or evidence of an optimum. |
| Comparison | What matches or differs | Appropriate interpretation | Original evidence |
|---|---|---|---|
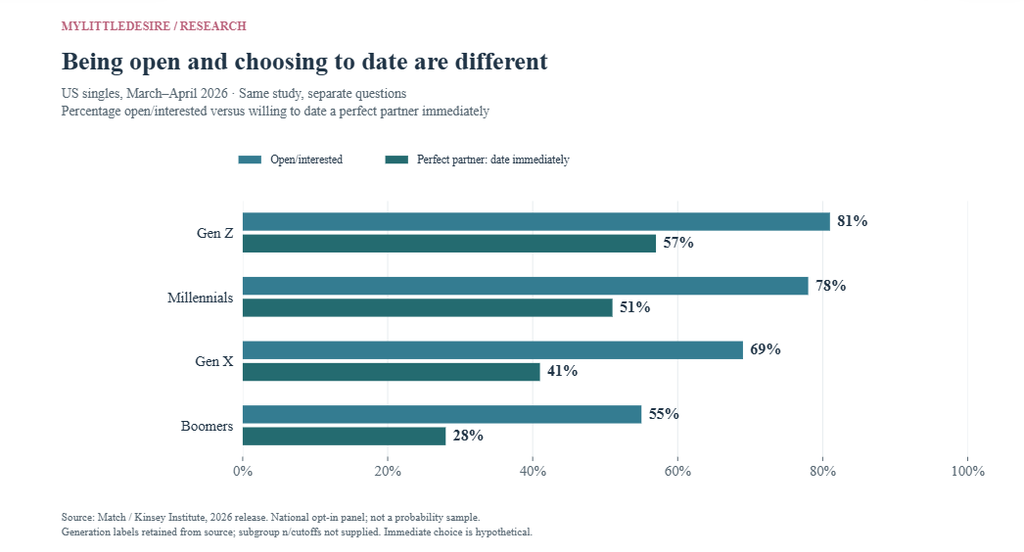
| US generation openness / immediate choice | Same study and generation label, different questions | Compare margins; do not label the difference a share of reluctant individuals. | S01 |
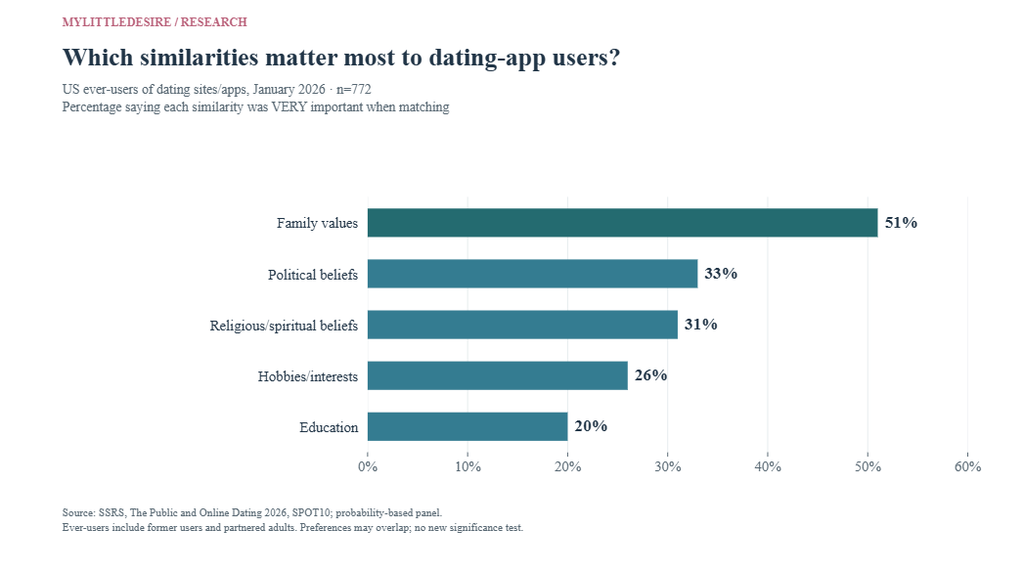
| US matching preferences | Same ever-user base and very-important intensity | Compare selected priorities; the chart is not a cause-of-commitment model. | S02 / SPOT10 |
| Pew 13% / 31% commitment-only | Same wave, all singles versus looking singles | Explain the denominator change instead of treating the values as conflicting. | S03 |
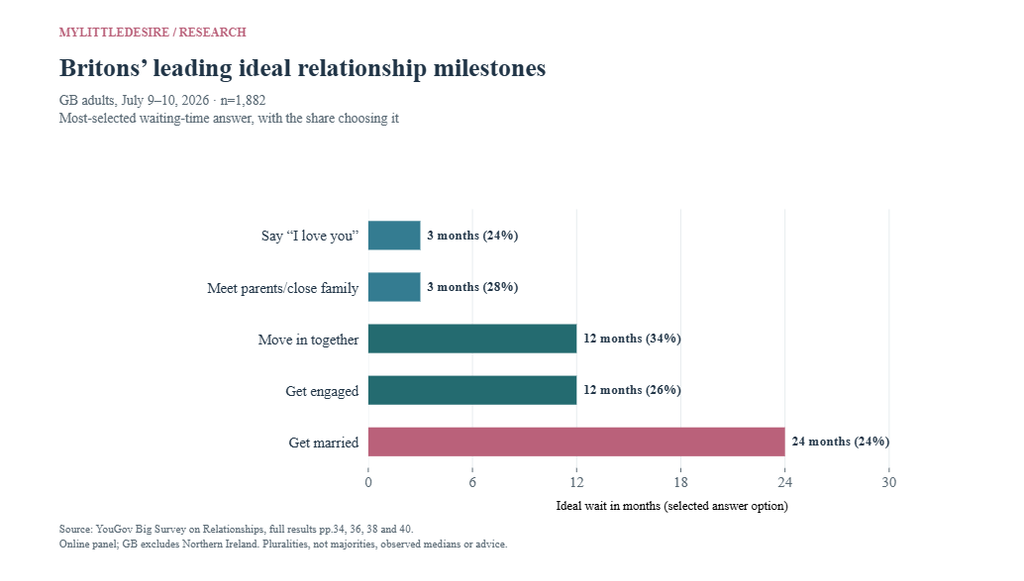
| GB milestone ideals | Same adult survey, separate milestone items | Compare modal answer options; not actual timing, a recommendation or a majority. | S06 |
| US money / commitment barriers | Same restricted analysis base and agreement scale | Compare overlapping endorsements, not causal shares of the national dating market. | S07 / p.17 |
| Canada / US / GB / Australia intentions | Current daters, ever-users, singles and young respondents differ | Keep country context separate; no pooled commitment score or national league table. | S08 / small routed base |
Key dating intentions and commitment findings
72% / 16%
14.4%
Open/interested versus actively seeking a committed relationship.US Singles in America release; March–April 2026
Match / Kinsey Institute at Indiana University
Said they were very ready for a long-term committed relationship.Separate readiness item; codebook Q12, n=4,952
Match / Kinsey Institute at Indiana University ·
44.6%
30.0%
Wanted marriage in the future.US opt-in singles study, 2026; codebook Q52
Match / Kinsey Institute at Indiana University ·
Were open to long-term commitment with no intention of marriage.US study, 2026; hypothetical, multiple response
Match / Kinsey Institute at Indiana University
31% / 13%
69%
Wanted commitment only: looking singles versus all singles.Same 2022 Pew wave; different denominators
Pew Research Center
Wanted marriage someday in the restricted young-adult sample.Never-married ages 18–34 with parent contact, 2023
Pew Research Center ·
24% / 35%
61% / 25%
Wanted a relationship now versus in the future, but not now.GB adults not in a relationship, July 2026; n=608
YouGov
Expected marriage: yes versus maybe/don’t know.US unmarried ages 22–35, early 2025; full n=5,275
Wheatley Institute / Institute for Family Studies
52% / 18%
82%
Endorsed money versus avoiding long-term commitment as dating barriers.Restricted US analysis, early 2025; n=3,995
Wheatley Institute / Institute for Family Studies ·
Wanted a long-term partner among Canadian current daters.December 2025; small n=77, published margin ±11.3 points
Nanos Research / The Globe and Mail ·
Does being open to a relationship mean actively looking?
No. The 2026 Singles in America release reported 72% open or interested, while 16% actively sought commitment. Its codebook separately measured marriage wishes and readiness. Those are different questions, and each describes a different aspect of someone’s intentions.
| ID | Finding and qualification | Population, actual period and base | Original source and locator |
|---|---|---|---|
| F01 | 72% were interested in or open to dating/a relationship; 45% were not actively looking but open to the right person, and 16% actively sought commitment. Definition: Official release’s published rounded categories; broad openness overlaps the more specific categories. Qualification: Do not sum the three figures or label 72% as active relationship seekers. | US single adults 18+ under the Singles in America definition United States March–April 2026 Exact item/subgroup valid n is not printed beside these selected figures. An overall report n is not a subgroup base. | Match / Kinsey Institute at Indiana University Published 2026-09-10 Match release; 2026-09-14 university release Match release: Selective on Purpose; codebook Q11 p.25 |
| F02 | Openness to dating/a relationship was 81% among Gen Z, 78% Millennials, 69% Gen X and 55% Boomers. Definition: Generation labels and published rounded shares from the release. Qualification: Opt-in sample; subgroup valid n and exact generation age cutoffs not printed in the release. | US single adults 18+ under the Singles in America definition United States March–April 2026 Exact item/subgroup valid n is not printed beside these selected figures. An overall report n is not a subgroup base. | Match / Kinsey Institute at Indiana University Published 2026-09-10 Match release; 2026-09-14 university release Match release: Selective on Purpose |
| F03 | If their perfect partner appeared tomorrow, 57% of Gen Z, 51% Millennials, 41% Gen X and 28% Boomers would date immediately. Definition: Hypothetical immediate decision, not general readiness or observed dating. Qualification: Separate item from openness; margin gaps do not identify which people would decline. | US single adults 18+ under the Singles in America definition United States March–April 2026 Exact item/subgroup valid n is not printed beside these selected figures. An overall report n is not a subgroup base. | Match / Kinsey Institute at Indiana University Published 2026-09-10 Match release; 2026-09-14 university release Match release: Selective on Purpose; codebook Q14 p.30 |
| F04 | 75.6% believed romantic love can last forever. Definition: Codebook Q44r1 yes response. Qualification: Belief about love, not a probability of permanent relationships. | US single adults 18+ under the Singles in America definition United States March–April 2026 Published eligible item/group base(s): 4,952. An overall report n is not a subgroup base. | Match / Kinsey Institute at Indiana University Published 2026-09-10 Match release; 2026-09-14 university release Codebook p.113, Q44r1 |
| F05 | 44.6% wanted marriage in the future, 29.1% did not and 26.3% did not know. Definition: Codebook Q52, all study respondents. Qualification: Marriage wishes do not establish imminent plans; codebook precision retained. | US single adults 18+ under the Singles in America definition United States March–April 2026 Published eligible item/group base(s): 4,952. An overall report n is not a subgroup base. | Match / Kinsey Institute at Indiana University Published 2026-09-10 Match release; 2026-09-14 university release Codebook p.141, Q52 |
| F06 | 30.0% were open to a committed long-term relationship with no intention to marry. Definition: Codebook Q55r7 selected; multiple relationship types could be selected. Qualification: Openness is hypothetical and can coexist with other relationship preferences. | US single adults 18+ under the Singles in America definition United States March–April 2026 Published eligible item/group base(s): 4,952. An overall report n is not a subgroup base. | Match / Kinsey Institute at Indiana University Published 2026-09-10 Match release; 2026-09-14 university release Codebook p.146, Q55r7 |
| F07 | 34.6% prioritized peace/emotional safety, 13.9% passion/excitement and 51.5% valued both equally. Definition: Codebook Q41 forced choice about what matters more right now. Qualification: The release prints 34% for the first category; this row explicitly uses the codebook’s 34.6% instead. | US single adults 18+ under the Singles in America definition United States March–April 2026 Published eligible item/group base(s): 4,952. An overall report n is not a subgroup base. | Match / Kinsey Institute at Indiana University Published 2026-09-10 Match release; 2026-09-14 university release Codebook p.112, Q41 |
| F08 | 45.3% said the same core values were very important in a potential partner; 46.8% said somewhat important. Definition: Codebook Q42: importance of sharing core values. Qualification: Preference ratings are not observed compatibility or a cause of relationship success. | US single adults 18+ under the Singles in America definition United States March–April 2026 Published eligible item/group base(s): 4,952. An overall report n is not a subgroup base. | Match / Kinsey Institute at Indiana University Published 2026-09-10 Match release; 2026-09-14 university release Codebook p.112, Q42 |
| F09 | 14.4% felt very ready for a long-term committed relationship, 21.5% mostly ready, 24.8% somewhat ready, 15.4% slightly ready and 23.9% not at all ready. Definition: Codebook Q12 five-level self-rated readiness. Qualification: Different construct from actively seeking or a perfect-partner hypothetical; do not substitute its margins. | US single adults 18+ under the Singles in America definition United States March–April 2026 Published eligible item/group base(s): 4,952. An overall report n is not a subgroup base. | Match / Kinsey Institute at Indiana University Published 2026-09-10 Match release; 2026-09-14 university release Codebook p.26, Q12 |
What do dating-app users want from a match?
Finding an exclusive partner was the leading main reason for online dating in SSRS’s January 2026 survey. Shared family values also led the selected very-important compatibility measures. Ever-users include former users and people who are now partnered, so these findings should not be read as the preferences of current single app users only.
| ID | Finding and qualification | Population, actual period and base | Original source and locator |
|---|---|---|---|
| F10 | 58% named finding an exclusive partner as their main reason for online dating, versus 20% fun, 8% casual sex and 3% non-exclusive partners. Definition: SPOT11, one main reason; other categories also available. Qualification: Ever-users include former users and people now partnered; this is not a current-single dating-app rate. | US adults 18+ who had ever used an online dating site/app United States January 2–4 and 16–20, 2026 Published eligible item/group base(s): 772. An overall report n is not a subgroup base. | SSRS Published 2026-02-02 Topline physical p.7 |
| F11 | Sharing similar family values was very important to 51% and very/somewhat important to 88%. Definition: SPOT10 compatibility importance; published net includes very and somewhat. Qualification: These are nested categories, not separate groups to add. No evidence that the preference causes commitment. | US adults 18+ who had ever used an online dating site/app United States January 2–4 and 16–20, 2026 Published eligible item/group base(s): 772. An overall report n is not a subgroup base. | SSRS Published 2026-02-02 Topline physical p.4 |
| F12 | Sharing similar political beliefs was very important to 33% and very/somewhat important to 68%. Definition: SPOT10 compatibility importance; published net includes very and somewhat. Qualification: These are nested categories, not separate groups to add. No evidence that the preference causes commitment. | US adults 18+ who had ever used an online dating site/app United States January 2–4 and 16–20, 2026 Published eligible item/group base(s): 772. An overall report n is not a subgroup base. | SSRS Published 2026-02-02 Topline physical p.3 |
| F13 | Sharing similar religious/spiritual beliefs was very important to 31% and very/somewhat important to 65%. Definition: SPOT10 compatibility importance; published net includes very and somewhat. Qualification: These are nested categories, not separate groups to add. No evidence that the preference causes commitment. | US adults 18+ who had ever used an online dating site/app United States January 2–4 and 16–20, 2026 Published eligible item/group base(s): 772. An overall report n is not a subgroup base. | SSRS Published 2026-02-02 Topline physical p.3 |
| F14 | Sharing similar hobbies/interests was very important to 26% and very/somewhat important to 81%. Definition: SPOT10 compatibility importance; published net includes very and somewhat. Qualification: These are nested categories, not separate groups to add. No evidence that the preference causes commitment. | US adults 18+ who had ever used an online dating site/app United States January 2–4 and 16–20, 2026 Published eligible item/group base(s): 772. An overall report n is not a subgroup base. | SSRS Published 2026-02-02 Topline physical p.4 |
| F15 | Sharing similar education was very important to 20% and very/somewhat important to 60%. Definition: SPOT10 compatibility importance; published net includes very and somewhat. Qualification: These are nested categories, not separate groups to add. No evidence that the preference causes commitment. | US adults 18+ who had ever used an online dating site/app United States January 2–4 and 16–20, 2026 Published eligible item/group base(s): 772. An overall report n is not a subgroup base. | SSRS Published 2026-02-02 Topline physical p.6 |
| F16 | 50% had ever formed a committed relationship with an online match in 2026, compared with 42% in the 2024 survey. Definition: SPOT13, lifetime formation; separate cross-sectional samples. Qualification: Not an app success probability or the rate of current relationships; no new significance test. | US adults 18+ who had ever used an online dating site/app United States 2026 January waves; comparison January 5–7 and 19–21, 2024 Published eligible item/group base(s): 772. An overall report n is not a subgroup base. | SSRS Published 2026-02-02 Topline p.8, SPOT13 |
| F17 | 58% thought relationships starting online were just as successful as in-person starts; 37% less successful and 5% more successful. Definition: SPOT14, public opinion rather than measured outcomes. Qualification: Do not interpret the 58% opinion as observed equal relationship survival. | US adults 18+ United States January 2–4 and 16–20, 2026 Published eligible item/group base(s): 2,012. An overall report n is not a subgroup base. | SSRS Published 2026-02-02 Topline physical p.8 |
How many singles are looking for commitment or casual dates?
In Pew’s July 2022 survey, 42% of singles were looking for some form of romance. Among that looking-only group, 31% wanted only a committed relationship. The all-single share for the same answer was 13%. The different denominator explains the apparent mismatch.
| ID | Finding and qualification | Population, actual period and base | Original source and locator |
|---|---|---|---|
| F18 | 42% of single adults were looking for a relationship and/or casual dates; 57% were not. Definition: Published looking net and not-currently-looking response. Qualification: Historical 2022; a single person is not necessarily available or looking. | US single adults under Pew’s not-married/not-cohabiting/not-committed definition United States July 5–17, 2022 Published eligible item/group base(s): 2,231. An overall report n is not a subgroup base. | Pew Research Center Published 2023-02-08 Article selected chart; topline SEEKING p.1 |
| F19 | Among all singles, 13% wanted only commitment, 22% were open to commitment or casual dates and 7% wanted only casual dates. Definition: SEEKING response categories using all single adults as the denominator. Qualification: These are not the corresponding percentages among singles who are looking. | US single adults under Pew’s not-married/not-cohabiting/not-committed definition United States July 5–17, 2022 Published eligible item/group base(s): 2,231. An overall report n is not a subgroup base. | Pew Research Center Published 2023-02-08 Article selected chart; topline SEEKING p.1 |
| F20 | 50% of single men and 35% of single women were looking for romance. Definition: Looking for commitment, casual dates or either. Qualification: Unadjusted group margins; not evidence about an individual’s intentions. | US single adults under Pew’s not-married/not-cohabiting/not-committed definition; men and women separately United States July 5–17, 2022 Exact item/subgroup valid n is not printed beside these selected figures. An overall report n is not a subgroup base. | Pew Research Center Published 2023-02-08 Article selected chart; topline SEEKING p.1 |
| F21 | Looking shares were 57% under 50, 36% at 50–64 and 16% at 65+. Definition: Single adults looking, by broad age groups. Qualification: Cross-sectional age differences, not within-person change or generation effects. | US single adults under Pew’s not-married/not-cohabiting/not-committed definition; age groups separately United States July 5–17, 2022 Exact item/subgroup valid n is not printed beside these selected figures. An overall report n is not a subgroup base. | Pew Research Center Published 2023-02-08 Article selected chart; topline SEEKING p.1 |
| F22 | The published looking share declined from 49% in 2019 to 42% in July 2022. Definition: Published net from each survey, rather than sums of rounded answer cells. Qualification: 2019 not-looking response said dates rather than casual dates; no extrapolation beyond 2022. | US single adults under Pew’s not-married/not-cohabiting/not-committed definition United States October 16–28, 2019 and July 5–17, 2022 Exact item/subgroup valid n is not printed beside these selected figures. An overall report n is not a subgroup base. | Pew Research Center Published 2023-02-08 Article selected chart; topline SEEKING p.1 |
| F23 | Single men’s looking share was 61% in 2019 and 50% in 2022; women’s was 38% and 35%. Definition: Sex-specific historical looking shares. Qualification: Pew reports no statistically significant change among women; do not treat the three-point margin as a confirmed decline. | US single adults under Pew’s not-married/not-cohabiting/not-committed definition; men and women separately United States October 16–28, 2019 and July 5–17, 2022 Exact item/subgroup valid n is not printed beside these selected figures. An overall report n is not a subgroup base. | Pew Research Center Published 2023-02-08 Article selected chart; topline SEEKING p.1 |
| F24 | Among singles who were looking, 31% wanted only commitment, 51% were open to either and 17% wanted only casual dates. Definition: Conditional denominator: single and looking. Qualification: Not all singles or all adults; rounded shares can fail to total 100. | US single adults under Pew’s not-married/not-cohabiting/not-committed definition who were looking United States July 5–17, 2022 Exact item/subgroup valid n is not printed beside these selected figures. An overall report n is not a subgroup base. | Pew Research Center Published 2023-02-08 Article selected chart; topline SEEKING p.1 |
| F25 | Among looking singles, women were more likely than men to want only commitment (41% versus 25%); openness to either was 44% versus 56%. Definition: Looking-only gender comparisons. Qualification: No individual prediction or inference that everyone else wanted casual dates. | US single adults under Pew’s not-married/not-cohabiting/not-committed definition who were looking; men/women separately United States July 5–17, 2022 Exact item/subgroup valid n is not printed beside these selected figures. An overall report n is not a subgroup base. | Pew Research Center Published 2023-02-08 Article selected chart; topline SEEKING p.1 |
Do young adults want marriage, and do parents pressure them?
Most never-married young adults in the restricted 2023 Pew sample wanted marriage someday. Most also reported little or no parental pressure to marry. Those separate margins can coexist; without an individual cross-tab they do not show exactly which respondents wanted marriage without pressure.
| ID | Finding and qualification | Population, actual period and base | Original source and locator |
|---|---|---|---|
| F26 | 69% wanted marriage someday, 8% did not and 23% were unsure. Definition: MARRYPREF1, future marriage preference. Qualification: Restricted young-adult sample; not a forecast of how many will marry. | US never-married adults 18–34 with a living parent they contact, excluding current high-school students United States October 24–November 5, 2023 Published eligible item/group base(s): 894. An overall report n is not a subgroup base. | Pew Research Center Published 2024-02-15; original broader report 2024-01-25 Adult-children topline p.5, MARRYPREF1 |
| F27 | 73% felt not much/no parental pressure to marry; 15% some and 12% a great deal/fair amount. Definition: CMARRY2, perceived pressure, grouped categories published in the article. Qualification: Feeling little pressure does not mean not wanting marriage; no joint individual cross-tab was supplied. | US never-married adults 18–34 with a living parent they contact, excluding current high-school students United States October 24–November 5, 2023 Published eligible item/group base(s): 894. An overall report n is not a subgroup base. | Pew Research Center Published 2024-02-15; original broader report 2024-01-25 Article parent-pressure section; topline p.5, CMARRY2 |
How do marriage wishes vary across age and LGBTQ groups?
Pew’s 2025 surveys found similar overall marriage wishes among never-married LGBTQ and non-LGBTQ adults under 50. In each group, younger adults were more likely to want marriage than those aged 30–49. Remarriage is a separate question for a different population.
| ID | Finding and qualification | Population, actual period and base | Original source and locator |
|---|---|---|---|
| F28 | 59% of LGBTQ and 63% of non-LGBTQ never-married adults under 50 wanted marriage someday. Definition: MARRYPREF1 yes, two survey groups. Qualification: Pew describes these as similar shares; the margin is not evidence of identical lives. | US never-married adults 18–49, LGBTQ and non-LGBTQ separately United States LGBTQ January 8–19, 2025; non-LGBTQ January 27–February 2, 2025 Published eligible item/group base(s): 870, 1,490. An overall report n is not a subgroup base. | Pew Research Center Published 2025-08-11 Combined topline pp.2 and 4, MARRYPREF1 |
| F29 | Among never-married LGBTQ adults, 67% aged 18–29 and 48% aged 30–49 wanted marriage. Definition: MARRYPREF1 age comparison. Qualification: Age difference in a cross-section, not a decline as the same people age. | US never-married adults 18–49, LGBTQ and non-LGBTQ separately; LGBTQ age groups United States LGBTQ January 8–19, 2025; non-LGBTQ January 27–February 2, 2025 Exact item/subgroup valid n is not printed beside these selected figures. An overall report n is not a subgroup base. | Pew Research Center Published 2025-08-11 Article: Views on getting married, age comparison |
| F30 | Among never-married non-LGBTQ adults, 73% aged 18–29 and 49% aged 30–49 wanted marriage. Definition: MARRYPREF1 age comparison. Qualification: Do not replace these age groups with generations or compare them with all singles. | US never-married adults 18–49, LGBTQ and non-LGBTQ separately; non-LGBTQ age groups United States LGBTQ January 8–19, 2025; non-LGBTQ January 27–February 2, 2025 Exact item/subgroup valid n is not printed beside these selected figures. An overall report n is not a subgroup base. | Pew Research Center Published 2025-08-11 Article: Views on getting married, age comparison |
| F31 | 46% of previously married LGBTQ adults under 50 wanted remarriage versus 33% of non-LGBTQ adults; uncertainty was 25% versus 37%. Definition: MARRYPREF2, future marriage after a prior marriage. Qualification: Not directly comparable with never-married wishes; separate questions and populations. | US divorced, separated or widowed adults 18–49, LGBTQ/non-LGBTQ separately United States LGBTQ January 8–19, 2025; non-LGBTQ January 27–February 2, 2025 Published eligible item/group base(s): 230, 302. An overall report n is not a subgroup base. | Pew Research Center Published 2025-08-11 Combined topline pp.2 and 5, MARRYPREF2 |
Do British singles want a relationship now or later?
YouGov’s July 2026 results separate current desire from future desire: 24% wanted a relationship now and 35% later. The questions were asked of adults not currently in a relationship in Great Britain. That geography excludes Northern Ireland.
| ID | Finding and qualification | Population, actual period and base | Original source and locator |
|---|---|---|---|
| F32 | 24% wanted a relationship now, 35% wanted one later, 23% never wanted one and 18% were unsure. Definition: Single routed relationship-desire question; exact never-want wording retained. Qualification: Future desire is not current searching; the single base is n=608, not all 1,882 adults. | GB adults not currently in a relationship Great Britain, not the whole United Kingdom July 9–10, 2026 Published eligible item/group base(s): 608. An overall report n is not a subgroup base. | YouGov Published 2026-08-17 Full results PDF physical p.10 |
| F33 | 27% of single men and 20% of single women wanted a relationship now. Definition: Same routed desire item by gender. Qualification: Group-specific valid n unavailable beside this selected extract; not an individual predictor. | GB adults not currently in a relationship; men/women separately Great Britain, not the whole United Kingdom July 9–10, 2026 Exact item/subgroup valid n is not printed beside these selected figures. An overall report n is not a subgroup base. | YouGov Published 2026-08-17 Full results PDF physical p.9 |
| F34 | Wanting a relationship now ranged from 35% at 18–29 to 12% at 60+; the middle age groups were 27%, 29% and 11%. Definition: Ages 18–29, 30–39, 40–49, 50–59 and 60+ in order. Qualification: Different age groups in one cross-section, not a time trend. | GB adults not currently in a relationship; separate age groups Great Britain, not the whole United Kingdom July 9–10, 2026 Exact item/subgroup valid n is not printed beside these selected figures. An overall report n is not a subgroup base. | YouGov Published 2026-08-17 Full results PDF physical p.9 |
| F35 | 42% had not met the right person, 35% preferred singlehood and 30% were not interested in a relationship at present. Definition: Multiple-response reasons for not being in a relationship. Qualification: Reasons overlap; do not sum them or equate lack of the right person with active dating. | GB adults not currently in a relationship Great Britain, not the whole United Kingdom July 9–10, 2026 Published eligible item/group base(s): 608. An overall report n is not a subgroup base. | YouGov Published 2026-08-17 Full results PDF physical p.10 |
| F36 | 29% cited stressful/difficult dating, 29% difficulty trusting, 23% past relationship hurt and 20% personal circumstances. Definition: Multiple-response reasons; last includes health/family/personal circumstances. Qualification: Self-reported reasons, not diagnoses or causes independently established. | GB adults not currently in a relationship Great Britain, not the whole United Kingdom July 9–10, 2026 Published eligible item/group base(s): 608. An overall report n is not a subgroup base. | YouGov Published 2026-08-17 Full results PDF physical p.10 |
When do Britons think relationship milestones should happen?
The leading ideal was three months for saying “I love you” and meeting family, a year for moving in or engagement, and two years for marriage. Each leading answer attracted a plurality. These are opinions about ideal timing, rather than observed medians or a schedule that couples should follow.
| ID | Finding and qualification | Population, actual period and base | Original source and locator |
|---|---|---|---|
| F37 | For saying I love you, the leading ideal wait was 3 months (24%); 6 months drew 19% and 1 month 15%. Definition: Ideal time seeing a new partner before the milestone; selected answer options. Qualification: Plurality opinion, not a majority, median observed time or recommended schedule. | GB adults 18+, all respondents Great Britain, not the whole United Kingdom July 9–10, 2026 Published eligible item/group base(s): 1,882. An overall report n is not a subgroup base. | YouGov Published 2026-08-17 Full results PDF physical p.34 |
| F38 | For meeting parents/close family, the leading ideal wait was 3 months (28%); 6 months drew 24% and 1 month 16%. Definition: Ideal time seeing a new partner before the milestone; selected answer options. Qualification: Plurality opinion, not a majority, median observed time or recommended schedule. | GB adults 18+, all respondents Great Britain, not the whole United Kingdom July 9–10, 2026 Published eligible item/group base(s): 1,882. An overall report n is not a subgroup base. | YouGov Published 2026-08-17 Full results PDF physical p.34 |
| F39 | For moving in together, the leading ideal wait was 1 year (34%); 6 months drew 15% and 2 years 14%. Definition: Ideal time seeing a new partner before the milestone; selected answer options. Qualification: Plurality opinion, not a majority, median observed time or recommended schedule. | GB adults 18+, all respondents Great Britain, not the whole United Kingdom July 9–10, 2026 Published eligible item/group base(s): 1,882. An overall report n is not a subgroup base. | YouGov Published 2026-08-17 Full results PDF physical p.36 |
| F40 | For getting engaged, the leading ideal wait was 1 year (26%); 2 years drew 22% and 3 years 9%. Definition: Ideal time seeing a new partner before the milestone; selected answer options. Qualification: Plurality opinion, not a majority, median observed time or recommended schedule. | GB adults 18+, all respondents Great Britain, not the whole United Kingdom July 9–10, 2026 Published eligible item/group base(s): 1,882. An overall report n is not a subgroup base. | YouGov Published 2026-08-17 Full results PDF physical p.38 |
| F41 | For getting married, the leading ideal wait was 2 years (24%); 3 years drew 16% and 1 year 14%. Definition: Ideal time seeing a new partner before the milestone; selected answer options. Qualification: Plurality opinion, not a majority, median observed time or recommended schedule. | GB adults 18+, all respondents Great Britain, not the whole United Kingdom July 9–10, 2026 Published eligible item/group base(s): 1,882. An overall report n is not a subgroup base. | YouGov Published 2026-08-17 Full results PDF physical p.40 |
How do marriage expectations differ from current priorities?
The 2025 National Dating Landscape Survey reported 61% saying yes to expecting marriage and 25% maybe/don’t know. The report combined those groups for much of its analysis. Keeping that selection visible changes how its dating-purpose and barrier statistics should be interpreted.
| ID | Finding and qualification | Population, actual period and base | Original source and locator |
|---|---|---|---|
| F42 | 61% said yes to expecting marriage, 25% maybe/don’t know and 14% no. Definition: Full sample marriage-expectation categories; 86% yes-or-uncertain analysis eligibility is not 86% definite intention. Qualification: The subsequent restricted results do not describe all 5,275 respondents. | US unmarried adults 22–35, full sample United States Early 2025; exact days not disclosed Published eligible item/group base(s): 5,275. An overall report n is not a subgroup base. | Wheatley Institute / Institute for Family Studies Published February 2026; PDF embargo date 2026-02-10 Report physical pp.9–10 |
| F43 | 64% called marriage an important life goal, 47% a current top priority and 46% wanted to be married now. Definition: Separate marital-salience items. Qualification: Margins do not identify the same respondents’ priority gaps; eligible item n not supplied for each percentage. | US unmarried adults 22–35 in the yes/maybe/don’t-know marriage-expectation analysis group United States Early 2025; exact days not disclosed Exact item/subgroup valid n is not printed beside these selected figures. An overall report n is not a subgroup base. | Wheatley Institute / Institute for Family Studies Published February 2026; PDF embargo date 2026-02-10 Report physical pp.11 |
| F44 | The mean expected marriage horizon was 5.6 years: 6.0 for men and 5.2 for women. Definition: Expected marriage age minus current age, not time until an observed marriage. Qualification: Cross-sectional expectations; endnote 16 excludes implausible expected ages. No prospective follow-up. | US unmarried adults 22–35 in the yes/maybe/don’t-know marriage-expectation analysis group United States Early 2025; exact days not disclosed Exact item/subgroup valid n is not printed beside these selected figures. An overall report n is not a subgroup base. | Wheatley Institute / Institute for Family Studies Published February 2026; PDF embargo date 2026-02-10 Report physical pp.10–11; endnote 16 |
| F45 | 31% dated at least monthly; 36% of men and 26% of women did so. Definition: Report’s active-dating frequency definition. Qualification: Frequency analysis has additional exclusions, including exclusive daters in endnote 20; not all unmarried adults. | US unmarried adults 22–35 in the yes/maybe/don’t-know marriage-expectation analysis group in the frequency analysis after relevant exclusions United States Early 2025; exact days not disclosed Exact item/subgroup valid n is not printed beside these selected figures. An overall report n is not a subgroup base. | Wheatley Institute / Institute for Family Studies Published February 2026; PDF embargo date 2026-02-10 Report physical pp.13; endnotes 20–22 |
| F46 | 78% endorsed serious relationships as a dating purpose: 83% of women and 74% of men. Definition: Somewhat/strongly agree on dating purpose; valid table n=3,995. Qualification: Restricted analysis includes unsure marriage expectations; this is not the all-US-singles share seeking commitment. | US unmarried adults 22–35 in the yes/maybe/don’t-know marriage-expectation analysis group United States Early 2025; exact days not disclosed Published eligible item/group base(s): 1,969, 2,026, 3,995. An overall report n is not a subgroup base. | Wheatley Institute / Institute for Family Studies Published February 2026; PDF embargo date 2026-02-10 Report physical pp.15–16, Dating Purposes table |
| F47 | 80% endorsed emotional connection as a dating purpose: 83% of women and 76% of men. Definition: Dating Purposes table, agreement. Qualification: Self-reported purpose, not observed behavior; valid table sample is restricted. | US unmarried adults 22–35 in the yes/maybe/don’t-know marriage-expectation analysis group United States Early 2025; exact days not disclosed Published eligible item/group base(s): 1,969, 2,026, 3,995. An overall report n is not a subgroup base. | Wheatley Institute / Institute for Family Studies Published February 2026; PDF embargo date 2026-02-10 Report physical pp.16, Dating Purposes table |
| F48 | 67% endorsed personal growth, 63% learning what they wanted in a partner and 60% figuring out relationship goals. Definition: Dating Purposes table, agreement with separate overlapping purposes. Qualification: No claim these ratings cause dating success. | US unmarried adults 22–35 in the yes/maybe/don’t-know marriage-expectation analysis group United States Early 2025; exact days not disclosed Published eligible item/group base(s): 3,995. An overall report n is not a subgroup base. | Wheatley Institute / Institute for Family Studies Published February 2026; PDF embargo date 2026-02-10 Report physical pp.16, Dating Purposes table |
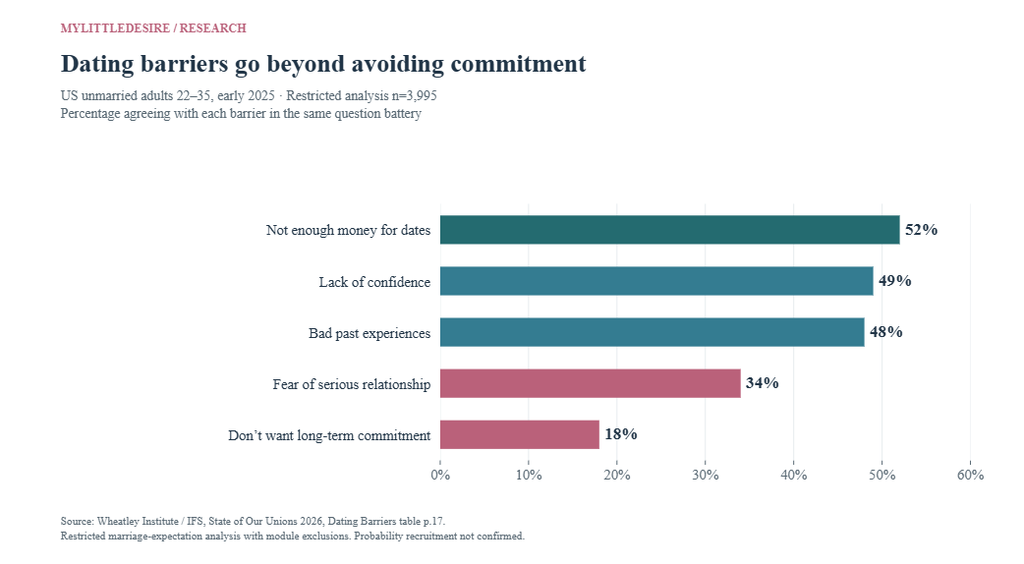
Is avoiding commitment the main reported barrier to dating?
In the report’s restricted barrier sample, insufficient dating money was endorsed more often than not wanting long-term commitment: 52% versus 18%. The 34-point difference is descriptive arithmetic on overlapping answers. It does not establish why all singles are dating less or what would change their behavior.
| ID | Finding and qualification | Population, actual period and base | Original source and locator |
|---|---|---|---|
| F49 | 52% reported insufficient money for dating, 49% lack of confidence and 48% past bad experiences as barriers. Definition: Dating Barriers table, moderately/strongly agree. Qualification: Overlapping perceived barriers, not causal estimates. Women’s money figure conflicts between narrative and table and is withheld. | US unmarried adults 22–35 in the yes/maybe/don’t-know marriage-expectation analysis group United States Early 2025; exact days not disclosed Published eligible item/group base(s): 3,995. An overall report n is not a subgroup base. | Wheatley Institute / Institute for Family Studies Published February 2026; PDF embargo date 2026-02-10 Report physical pp.17, Dating Barriers table |
| F50 | 34% reported fear of a serious relationship, 27% losing freedom and 18% not wanting long-term commitment as barriers. Definition: Dating Barriers table, separate agreement items. Qualification: The 18% is a specific barrier rating, not the overall share unwilling to commit or a diagnosis. | US unmarried adults 22–35 in the yes/maybe/don’t-know marriage-expectation analysis group United States Early 2025; exact days not disclosed Published eligible item/group base(s): 3,995. An overall report n is not a subgroup base. | Wheatley Institute / Institute for Family Studies Published February 2026; PDF embargo date 2026-02-10 Report physical pp.17, Dating Barriers table |
| F51 | 35% cited not being emotionally ready, 29% career/education time constraints and 38% lack of relationship experience. Definition: Dating Barriers table; distinct overlapping items. Qualification: Not being emotionally ready differs from never wanting commitment. | US unmarried adults 22–35 in the yes/maybe/don’t-know marriage-expectation analysis group United States Early 2025; exact days not disclosed Published eligible item/group base(s): 3,995. An overall report n is not a subgroup base. | Wheatley Institute / Institute for Family Studies Published February 2026; PDF embargo date 2026-02-10 Report physical pp.17, Dating Barriers table |
| F52 | 55% said breakups made them reluctant to start again; 45% passed up opportunities after bad experiences, while 28% felt able to stay positive after setbacks. Definition: Breakup-related attitudes and dating resilience, separate items. Qualification: Only supporting context here; these margins neither forecast future relationship formation nor show a treatment effect. | US unmarried adults 22–35 in the yes/maybe/don’t-know marriage-expectation analysis group United States Early 2025; exact days not disclosed Exact item/subgroup valid n is not printed beside these selected figures. An overall report n is not a subgroup base. | Wheatley Institute / Institute for Family Studies Published February 2026; PDF embargo date 2026-02-10 Report physical pp.14 and 18 |
What do Canadian current daters say they want?
Long-term partnership was the leading stated motive in the Nanos survey. Its current-dater base was only 77 people, with a published margin of ±11.3 percentage points. This makes the result useful as a carefully qualified Canadian reference, rather than a basis for ranking countries.
| ID | Finding and qualification | Population, actual period and base | Original source and locator |
|---|---|---|---|
| F53 | 8.2% were currently dating, 87.9% were not and 4.0% preferred not to say. Definition: Dating status, full sample. Qualification: Not currently dating explicitly includes people already committed; it does not mean 87.9% are single or rejecting romance. | Canadian adults 18+ Canada December 27–29, 2025 Published eligible item/group base(s): 1,077. An overall report n is not a subgroup base. | Nanos Research / The Globe and Mail Published PDF says January 2026 release; landing page 2026-02-12 Report p.4, status |
| F54 | 82% wanted a long-term partner, 17% a one-night stand/sexual relationship and 15% a short-term partner. Definition: Why are you dating? Select all that apply; n=77. Qualification: Small base and ±11.3-point published subgroup margin; overlapping answers. Not comparable with US main-reason or all-single questions. | Canadian adults 18+ currently dating Canada December 27–29, 2025 Published eligible item/group base(s): 77. An overall report n is not a subgroup base. | Nanos Research / The Globe and Mail Published PDF says January 2026 release; landing page 2026-02-12 Report p.7, Reasons for dating |
| F55 | 31.6% mentioned honesty, 30.4% kindness and 19.5% loyalty/respect as attractive partner qualities. Definition: Top two qualities; open-ended coded responses, n=73. Qualification: Published subgroup margin ±11.7 points; small and overlapping coded response groups. | Canadian adults 18+ currently dating giving valid open-ended qualities Canada December 27–29, 2025 Published eligible item/group base(s): 73. An overall report n is not a subgroup base. | Nanos Research / The Globe and Mail Published PDF says January 2026 release; landing page 2026-02-12 Report p.8, qualities/values |
| F56 | 23.3% mentioned narcissism/vanity, 22.6% dishonesty and 18.7% selfish behavior as off-putting qualities. Definition: Top two qualities that reduce interest, coded responses; n=73. Qualification: These are mentions, not the share who would reject every person showing the trait; ±11.7-point subgroup margin. | Canadian adults 18+ currently dating giving valid open-ended qualities Canada December 27–29, 2025 Published eligible item/group base(s): 73. An overall report n is not a subgroup base. | Nanos Research / The Globe and Mail Published PDF says January 2026 release; landing page 2026-02-12 Report p.9, least-interesting qualities |
What does Australian research say about marriage preferences?
A historical April 2024 Budget Direct/Pureprofile survey found marriage aspirations among young respondents and a mix of reasons for wanting or declining marriage. These weighted commercial-panel findings have restricted age coverage and unreported subgroup counts. They are included with those limits, rather than presented as a current national singles benchmark.
| ID | Finding and qualification | Population, actual period and base | Original source and locator |
|---|---|---|---|
| F57 | 70.5% of respondents aged 18–24 said they wanted marriage. Definition: Do you want to get married? Age-specific result. Qualification: Historical commercial weighted panel; subgroup valid n unavailable. Do not call this 70.5% of all Australian singles. | Australian online survey respondents 18–69; ages 18–24 only Australia April 2024 Exact item/subgroup valid n is not printed beside these selected figures. An overall report n is not a subgroup base. | Budget Direct / Pureprofile Published 2024-04-19 Original survey: Do you want to get married? age narrative |
| F58 | 60.2% cited celebrating love, 58.1% commitment and 34.0% an important milestone as marriage reasons. Definition: Why want/did want marriage? Multiple selections. Qualification: Combines retrospective and prospective reasons; filtered valid n not published. | Australian online survey respondents 18–69 who were married or wanted marriage Australia April 2024 Exact item/subgroup valid n is not printed beside these selected figures. An overall report n is not a subgroup base. | Budget Direct / Pureprofile Published 2024-04-19 Original survey: Why do/did you want to get married? Australia table |
| F59 | Among those not wanting marriage, 36.6% liked their situation, 35.4% their independence and 34.8% saw it as unnecessary. Definition: Reasons for not wanting marriage; multiple selections. Qualification: Not wanting marriage does not establish opposition to a committed nonmarital relationship. | Australian online survey respondents 18–69 who did not want marriage Australia April 2024 Exact item/subgroup valid n is not printed beside these selected figures. An overall report n is not a subgroup base. | Budget Direct / Pureprofile Published 2024-04-19 Original survey: Why don’t you want to get married? Australia table |
| F60 | 25.9% of those not wanting marriage cited expense; 12.9% did not want to share finances. Definition: Two financial reasons in the same multiple-response question. Qualification: Do not infer that all others could afford marriage or that the reasons are mutually exclusive. | Australian online survey respondents 18–69 who did not want marriage Australia April 2024 Exact item/subgroup valid n is not printed beside these selected figures. An overall report n is not a subgroup base. | Budget Direct / Pureprofile Published 2024-04-19 Original survey: Why don’t you want to get married? Australia table |
20 comparisons with reproducible inputs
Results below are percentage-point differences calculated from published margins. Retain the question, base and period when quoting them. They are descriptive arithmetic; no new significance test, individual-response overlap or causal effect is inferred.
| ID | Comparison | Arithmetic and unit | Original inputs and qualification |
|---|---|---|---|
| C01 | Gen Z: openness minus immediate perfect-partner dating | 81 − 57 = 24.0 percentage points | F02 / F03 Separate question margins from one opt-in study; hypothetical readiness. Does not identify the same people’s discordance; no new significance test. |
| C02 | Millennials: openness minus immediate perfect-partner dating | 78 − 51 = 27.0 percentage points | F02 / F03 Separate question margins from one opt-in study; hypothetical readiness. Does not identify the same people’s discordance; no new significance test. |
| C03 | Gen X: openness minus immediate perfect-partner dating | 69 − 41 = 28.0 percentage points | F02 / F03 Separate question margins from one opt-in study; hypothetical readiness. Does not identify the same people’s discordance; no new significance test. |
| C04 | Boomers: openness minus immediate perfect-partner dating | 55 − 28 = 27.0 percentage points | F02 / F03 Separate question margins from one opt-in study; hypothetical readiness. Does not identify the same people’s discordance; no new significance test. |
| C05 | Family values minus politics: very important | 51 − 33 = 18.0 percentage points | F11 / F12 Same ever-user base and intensity; overlapping preferences, not a causal effect. |
| C06 | Family values minus religion: very important | 51 − 31 = 20.0 percentage points | F11 / F13 Same question battery and ever-user base; no new significance test. |
| C07 | Family values minus hobbies: very important | 51 − 26 = 25.0 percentage points | F11 / F14 Same intensity and ever-user base; no individual-level cross-tab. |
| C08 | Family values minus education: very/somewhat important | 88 − 60 = 28.0 percentage points | F11 / F15 Use the same broader intensity net for both inputs. |
| C09 | Ever formed commitment online: 2026 minus 2024 | 50 − 42 = 8.0 percentage points | F16 / F16 Repeated cross-sectional lifetime reports; not current relationship survival or a conversion-rate improvement. |
| C10 | All singles looking: 2022 minus 2019 | 42 − 49 = -7.0 percentage points | F18 / F22 Published nets; historical wording difference disclosed. No 2027 extrapolation. |
| C11 | Single men looking: 2022 minus 2019 | 50 − 61 = -11.0 percentage points | F20 / F23 Separate cross-sectional samples; Pew also discusses this difference. |
| C12 | Single men minus women currently looking | 50 − 35 = 15.0 percentage points | F20 / F20 Same 2022 single definition, unadjusted group margins. |
| C13 | Looking women minus men wanting only commitment | 41 − 25 = 16.0 percentage points | F25 / F25 Looking-only conditional denominator, not all singles. |
| C14 | LGBTQ marriage wishes: age 18–29 minus 30–49 | 67 − 48 = 19.0 percentage points | F29 / F29 Never-married under-50 cross-section; not change as individuals age. |
| C15 | Non-LGBTQ marriage wishes: age 18–29 minus 30–49 | 73 − 49 = 24.0 percentage points | F30 / F30 Never-married under-50 cross-section; no new significance test. |
| C16 | GB future-but-not-now minus current relationship desire | 35 − 24 = 11.0 percentage points | F32 / F32 Same routed single base; future wish is not active searching. |
| C17 | GB current relationship desire: 18–29 minus 60+ | 35 − 12 = 23.0 percentage points | F34 / F34 Different cross-sectional ages, not a generational trend. |
| C18 | Dating barriers: money minus avoiding long-term commitment | 52 − 18 = 34.0 percentage points | F49 / F50 Same restricted n=3,995 and agreement scale; overlapping barriers. No causal attribution. |
| C19 | Dating barriers: money minus fear of a serious relationship | 52 − 34 = 18.0 percentage points | F49 / F50 Different overlapping barriers in the same restricted sample. No individual discordance rate. |
| C20 | Canada long-term minus short-term dating motive | 82 − 15 = 67.0 percentage points | F54 / F54 Small routed n=77; multiple response. Not a cross-country comparison or a new significance test. |
Common questions about dating intentions
What percentage of singles want a serious relationship?
There is no one universal percentage. In the 2022 Pew survey, 13% of all singles wanted only commitment; among singles who were looking, it was 31%. Quote the denominator, place and year with the number. Original source.
Does being open to love mean actively dating?
No. The 2026 Singles in America release separates broad openness from active relationship seeking, and its codebook has another question about readiness. These are different constructs. Original source.
Are commitment and marriage the same thing in these studies?
No. The Singles in America codebook found 30.0% open to a long-term committed relationship with no intention to marry. That is a hypothetical preference, not a count of people currently in that relationship form. Original source.
Does the 86% marriage headline mean definite marriage plans?
No. In the IFS/Wheatley analysis it combines 61% answering yes with 25% answering maybe/don’t know. Its restricted dating analyses should keep that selection visible. Original source.
How long should couples date before marriage?
The British survey gives opinions about ideal timing; it does not establish a correct schedule or causal outcome. Its leading marriage answer was two years, selected by 24%, a plurality rather than a majority. Original source.
Can the Canadian and US intention percentages rank countries?
No. The Canadian multiple-response motive item covers a small current-dater base; SSRS asks ever-users for one main reason. The populations, periods and formats differ. Original source.
Methodology and limitations
What MyLittleDesire contributed
This is an editorial synthesis of third-party original research: 60 grouped findings, 168 numeric inputs, four original chart designs and 20 reproducible descriptive comparisons. It is not original survey fieldwork or a new scientific study. Several differences are already discussed by the original researchers; no claim is made that every subtraction is a new discovery.
How sources were selected and checked
We prioritized original questionnaires, toplines, codebooks and research reports covering dating intentions, commitment, marriage wishes, readiness, milestones and reported barriers. We checked the source wording, eligible population, geography, actual observation period and available item base. Nine source records span seven publishing groups; Pew contributes three research programs and its 2025 comparison uses two survey cohorts. YouGov contributes 10 of the 60 grouped findings, rather than dominating the collection.
What 2027 means
2027 is the editorial edition, prepared and reviewed November 1, 2026. The evidence includes 2019 historical comparisons and observations from 2022 through 2026. No finding is described as measured during 2027. Older findings remain dated historical evidence, rather than estimates of today’s behavior.
What can be compared
The clearest comparisons use the same survey, eligible base, scale and actual period. Percentage-point differences are A minus B using the published margins. Separate question margins do not identify individual inconsistency, overlap or refusal. Cross-sectional age differences do not follow the same people over time. Repeated survey waves are not experiments or relationship conversion rates.
What sampling allows
Pew and SSRS document probability-based recruitment. Kinsey explicitly describes opt-in panels for Singles in America. YouGov and the Australian commercial survey are panel studies; demographic weighting alone does not prove probability sampling. The IFS/Wheatley report’s nationally representative description is retained as a publisher claim, with insufficient public recruitment detail for independent confirmation. We do not manufacture item-level uncertainty or significance tests.
Small samples and restricted groups
The Nanos motive base is n=77 and its quality-response base n=73; their published margins are ±11.3 and ±11.7 points. The overall n=1,077 does not replace those bases. Most IFS/Wheatley dating results concern a selected yes/maybe/don’t-know marriage group, with further module exclusions. The Australian 2024 results are contextual historical panel evidence, with missing subgroup valid n disclosed.
How conflicting figures were handled
IFS narrative/table disagreements about women’s money barrier, enjoyable romance and women’s interest in starting a relationship were withheld. For Singles in America Q41 we explicitly use the codebook’s 34.6% peace/safety figure; its 34% release figure is not silently substituted. Rounded nets and component categories are kept as published rather than forced to total exactly 100.
Updates and limitations
This is a targeted English-language synthesis, not a systematic review or pooled prevalence estimate. It cannot predict an individual’s intentions or relationship success. Sources requiring better recruitment, fieldwork, subgroup-base or reconciliation detail remain flagged in the research files. Update only after a substantive source review, preserve useful historical series and refresh chart inputs with the text.
Related MyLittleDesire research
Singles and Singlehood Statistics covers relationship status and single life. Cohabitation and Living Together Statistics covers household arrangements. Marriage and Divorce Statistics covers marriage records and outcomes. This resource focuses on intentions and expectations. For proposals, see Engagement Proposal Statistics.
Complete original-source bibliography
- S01 · Match / Kinsey Institute at Indiana University. Singles in America 2026: 15th annual study.
Published 2026-09-10 Match release; 2026-09-14 university release. Data period: March–April 2026.
Population: Single adults 18+ under the study definition; generation labels retained from the release
Method: National online opt-in research panels; demographic recruitment/balancing, not a probability sample. Kinsey explicitly clarifies this sampling distinction. Public codebook frequency counts sum to 4,952, while releases describe approximately 5,000. Codebook question wording and counts inspected.
Limits: Commercially sponsored; participants are not recruited from Match users. Selected press-release and codebook margins are kept in their own stated precision; the release’s peace/safety figure is 34% versus 34.6% in Q41. The weighting/reconciliation behind that difference was not established. Press-release generational subgroup valid n and age cutoffs were not supplied. No sampling-error interval is invented.
Supporting document 1 · Supporting document 2 · Supporting document 3 · Supporting document 4
Reviewed November 1, 2026. - S02 · SSRS. The Public and Online Dating 2026.
Published 2026-02-02. Data period: 2026-01-02 to 2026-01-04 and 2026-01-16 to 2026-01-20; historical comparison January 2024.
Population: Adults 18+; most selected items restricted to ever-users of dating sites/apps
Method: Probability-based SSRS Opinion Panel Omnibus, online and telephone, English/Spanish. Original nine-page topline inspected. Ever-user base n=772 in 2026; n=772 in 2024. Overall margin ±2.5 points is not assigned to subgroup estimates.
Limits: Main reason is single-response; compatibility measures have very-important and broader very/somewhat-important categories. Past relationship formation is lifetime self-report, not current success, retention or an app conversion rate. The public HTML was readable through web retrieval; direct HTTP returned a redirect/challenge page.
Supporting document 1
Reviewed November 1, 2026. - S03 · Pew Research Center. For Valentine’s Day, 5 facts about single Americans.
Published 2023-02-08. Data period: 2022-07-05 to 2022-07-17; historical comparison 2019-10-16 to 2019-10-28.
Population: Single adults: not married, cohabiting or in a committed romantic relationship; some findings further restricted to those looking
Method: Weighted probability-based American Trends Panel plus Ipsos KnowledgePanel LGB oversample. Original topline and methodology inspected. SEEKING is based on n=2,231 single respondents in 2022. Looking-only and demographic valid n are not substituted with this whole single base.
Limits: Historical dated findings, not a 2027 measurement. The article publishes looking totals and conditional shares; do not recompute nets from rounded cells or compare all-single and looking-only percentages as if they share a denominator. 2019 non-looking option used dates rather than casual dates.
Supporting document 1 · Supporting document 2 · Supporting document 3 · Supporting document 4
Reviewed November 1, 2026. - S04 · Pew Research Center. Young adults’ views on getting married and pressure from parents.
Published 2024-02-15; original broader report 2024-01-25. Data period: 2023-10-24 to 2023-11-05.
Population: Adults 18–34 with at least one living parent they contact; not currently enrolled in high school; selected findings never-married
Method: Probability-recruited American Trends Panel, weighted. Original adult-children topline p.5 gives n=894 for both marriage preference and parent-pressure questions.
Limits: Restricted young-adult sample is not every person 18–34 or every single adult. Wanting marriage someday is not immediate readiness or an observed marriage. The general fulfillment/parenthood items in the summary are not substituted for marriage intentions.
Supporting document 1 · Supporting document 2
Reviewed November 1, 2026. - S05 · Pew Research Center. Majorities of LGBTQ and non-LGBTQ U.S. adults under 50 want to get married someday.
Published 2025-08-11. Data period: LGBTQ: 2025-01-08 to 2025-01-19; non-LGBTQ: 2025-01-27 to 2025-02-02.
Population: Never-married or previously married adults ages 18–49; groups and questions kept separate
Method: Two probability-based panel surveys, not one pooled sample: 3,959 LGBTQ adults and 4,716 non-LGBTQ adults. Original combined topline inspected. Never-married under-50 bases 1,490 and 870; previously married under-50 bases 302 and 230 respectively.
Limits: Age-specific valid n not printed with the selected article comparisons remains unavailable. Similar overall marriage wishes do not prove identical experiences or legal constraints. Do not sum survey totals into a nationally pooled study.
Supporting document 1 · Supporting document 2 · Supporting document 3
Reviewed November 1, 2026. - S06 · YouGov. Big Survey on Relationships: singledom and relationship milestone ideals.
Published 2026-08-17. Data period: 2026-07-09 to 2026-07-10.
Population: GB adults; singledom questions restricted to adults not currently in a relationship
Method: Online YouGov panel; published weighted/unweighted tables inspected. Overall n=1,882; single routed unweighted n=608 (weighted count 626). Milestone ideals use all adults.
Limits: Non-probability panel. Ideal timing is an opinion, not median actual timing, a recommendation or evidence that waiting causes stability. Leading milestone answers are pluralities, not majorities. Tables retain never-want wording, unlike the looser article paraphrase.
Supporting document 1 · Supporting document 2 · Supporting document 3
Reviewed November 1, 2026. - S07 · Wheatley Institute / Institute for Family Studies. State of Our Unions 2026: The Dating Recession.
Published February 2026; PDF embargo date 2026-02-10. Data period: Early 2025; exact fieldwork days not established.
Population: Unmarried adults 22–35; most analyses restricted to yes/maybe/don’t-know marriage expectations, with additional exclusions by module
Method: National Dating Landscape Survey fielded by Qualtrics. Report calls the sample nationally representative, but public recruitment/probability and weighting detail is insufficient for independent confirmation. Original tables and endnotes read. Purposes/barriers tables explicitly give n=3,995 (men 1,969; women 2,026).
Limits: Marriage-promoting institutional perspective. The 86% analysis-eligible group includes 61% yes plus 25% maybe/don’t know; 14% no excluded. Many dating analyses exclude cohabiters/engaged people. Frequency additionally excludes exclusive daters (endnote 20). Some narrative/table values conflict: women’s money barrier 46%/47%, enjoyable romance 69%/67%, women interested in relationship 43%/47%. These conflicting values are withheld.
Supporting document 1
Reviewed November 1, 2026. - S08 · Nanos Research / The Globe and Mail. Canadians’ dating intentions, partner qualities and dating status.
Published PDF says January 2026 release; landing page 2026-02-12. Data period: 2025-12-27 to 2025-12-29.
Population: Adults 18+ overall; intentions and partner-quality items restricted to current daters
Method: RDD dual-frame hybrid telephone/online random survey, weighted. Original report and statistical XLSX inspected. Current-dater base n=77 for motives; valid open-ended quality bases n=73.
Limits: Small routed base: published margin ±11.3 points for n=77 and ±11.7 for n=73, not the full-sample ±3.0 points. Motives allow multiple responses and do not sum to 100. Not currently dating includes committed people and uninterested people; it is not a singlehood rate.
Supporting document 1 · Supporting document 2
Reviewed November 1, 2026. - S09 · Budget Direct / Pureprofile. Marriage & Family Survey and Statistics 2024.
Published 2024-04-19. Data period: April 2024; exact fieldwork days not supplied.
Population: Adults 18–69; specific findings use young respondents or marriage-preference subgroups
Method: Budget Direct-commissioned online Pureprofile survey, weighted; original question tables, narrative and survey disclaimer inspected. The source describes demographic representativeness, not a documented probability design.
Limits: Commercial historical panel, not every Australian adult and not observed 2027 behavior. ACT, Tasmania and NT-specific results omitted for negligible samples. Filtered item/subgroup valid n and uncertainty were not supplied. Reasons questions allow multiple selections; wanting marriage and already being married are distinct states.
Supporting document 1
Reviewed November 1, 2026.
How to cite this resource
MyLittleDesire. Dating Intentions & Commitment Statistics 2027 https://mylittledesire.com/dating-intentions-statistics/.