Dating burnout headlines can describe very different experiences: feeling exhausted by apps, being disappointed by dates, needing a break or feeling pressure to keep searching. This guide brings original US, UK and Australian research together, with the question, actual date and population visible. Its comparisons explain why the numbers differ before treating them as evidence of a trend.
What does a dating-burnout statistic actually measure?
Check the definition, severity or frequency threshold, who was eligible and which denominator was used. Survey terminology is not a diagnosis. WHO’s occupational burnout classification does not establish a dating-burnout diagnostic category.
| Term | Meaning | Interpretation |
|---|---|---|
| Survey-defined dating burnout | The wording and threshold specified by a particular dating study. | A survey answer is not a clinical diagnosis. WHO’s ICD-11 burnout definition concerns work; it does not supply a dating-burnout diagnosis. |
| App exhaustion | Feeling emotionally, mentally or physically exhausted by app use. | Sometimes, often and always are different thresholds; the population may be only recent users. |
| Frustration or disappointment | An emotion about dating experiences or people encountered. | Related context, not interchangeable with exhaustion, a validated syndrome or a cause. |
| Need for a break | Feeling that a break would be useful or necessary. | Different from actually taking one, permanently leaving apps or benefiting afterward. |
| All cases versus nonmissing responses | A printed denominator that includes missing cases versus a recalculated valid-response denominator. | Keep the numerator and routing visible; system-missing is not a no response. |
| Separate marginal questions | Percentages from different questions in the same sample. | Subtracting them does not identify individual contradictions, emotion overlap or causal pathways. |
| Broader digital-relationship fatigue | Strain from maintaining online relationships across several channels. | May include group chats, messaging and social media; it is not app-only dating burnout. |
| Percentage points | The arithmetic difference between two percentages. | Category sums and recalculated shares remain percentages; no new significance test is implied. |
| Comparison | What the data supports | How to quote it | Original source |
|---|---|---|---|
| Severity thresholds | Same Q84r3 question and respondent group | State which categories were combined and label sums as MyLittleDesire arithmetic. | S01 |
| Coping denominators | Same selected counts, different denominator | Show all 4,952 versus 3,432 nonmissing; missing is not no. | S01 |
| Message emotions | Same past-year-user survey, distinct emotions | Keep both the emotion and the at-least-sometimes threshold. | S03 |
| Profile attention | Separate expectation and readiness margins | Do not infer individual inconsistency or a cause of fatigue. | S05 |
| US / UK / Australia | Different eligibility, years and constructs | Do not pool or subtract country headline rates. | S06 |
| Academic abstract | Longitudinal associations, no full table audit | No invented national prevalence or diagnostic treatment claim. | S09 |
Key dating burnout findings
15.9%
33.2%
Selected completely for dating-life burnout.2026 opt-in codebook; full n=4,952; study-specific wording
Match / Kinsey Institute ·
Moderate or complete dating-life burnout, summed printed categories.MyLittleDesire calculation C01; not a clinical cutoff
Match / Kinsey Institute ·
55.9%
41.4%
A little, moderate or complete, summed printed categories.MyLittleDesire calculation C02; nested threshold
Match / Kinsey Institute ·
Selected a dating break among nonmissing Q85 responses.C06: 1,420 / 3,432; printed all-case share is 28.7%
Match / Kinsey Institute ·
78%
40% / 35%
Reported app exhaustion sometimes, often or always.US past-year app-user survey; March–April 2024; n=1,000
Forbes Health / OnePoll ·
Cited lack of connection and disappointment as fatigue reasons.Same 2024 survey; reported reasons, not proven causes
Forbes Health / OnePoll ·
54% / 25%
64% / 40%
Women/men overwhelmed by message volume at least sometimes.Pew July 2022 past-year users; gender n unreported
Pew Research Center ·
Men/women insecure about too few messages at least sometimes.Different emotion question; not an overall burnout screen
Pew Research Center ·
88% / 79%
79.1%
Felt disappointed/excited at least sometimes.Pew July 2022 emotion base n=951; feelings can overlap
Pew Research Center ·
Ever felt emotional fatigue or burnout in the quota survey.Undated Healthy Framework fieldwork; US singles 18–54 only
Healthy Framework ·
60%
48% / 53%
Were described as experiencing dating-app fatigue.UK active-singles sponsor survey, September 2026; n=1,000
Alfa Romeo / OnePoll ·
Women/men planned to reduce social media’s influence on dating.Hily Gen Z users, December 2025; intention rather than outcome
Hily ·
What percentage of singles report dating burnout?
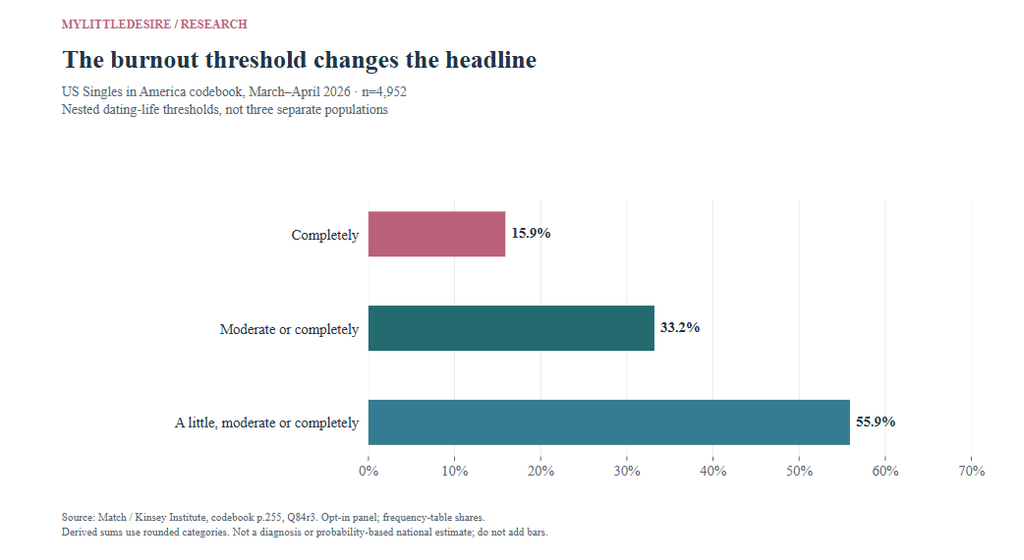
There is no single comparable burnout rate. In the 2026 Singles in America codebook, 15.9% selected completely, 17.3% a moderate amount and 22.7% a little for dating-life burnout. Adding the printed categories gives 33.2% moderate-or-complete and 55.9% at-least-a-little. Those are nested thresholds within one opt-in respondent group, not separate national estimates or clinical diagnoses.
| ID | Finding and qualification | Population, actual period and base | Original source and locator |
|---|---|---|---|
| F01 | Dating-life burnout responses were 30.7% not at all, 13.4% not much, 22.7% a little, 17.3% a moderate amount and 15.9% completely. Definition: Q84r3 asks about the last year and defines burnout as exhaustion, low drive or feeling worn down. Qualification: Codebook frequency shares of opt-in respondents, not a clinical screen or a probability-based national prevalence. Derived threshold sums are identified separately. | Study-defined single adults 18+; codebook frequency tables n=4,952 United States March–April 2026 Published eligible item/group base(s): 4,952. An overall report n is not a subgroup base. | Match / Kinsey Institute Published University release 2026-09-14; Match release 2026-09-10 Codebook p.255, Q84r3 Study methods and limits |
| F02 | For life in general, 18.0% reported no burnout, 13.5% not much, 28.4% a little, 23.6% a moderate amount and 16.6% completely. Definition: Same last-year severity grid, Q84r2, concerning life in general. Qualification: Contextual comparison, not dating-only exhaustion or proof that dating causes wider distress. Rounded categories can total slightly over 100. | Study-defined single adults 18+; codebook frequency tables n=4,952 United States March–April 2026 Published eligible item/group base(s): 4,952. An overall report n is not a subgroup base. | Match / Kinsey Institute Published University release 2026-09-14; Match release 2026-09-10 Codebook p.254, Q84r2 Study methods and limits |
Which parts of dating do singles find frustrating?
In the same codebook, dishonest presentation and poor behavior were selected more often than apps feeling overwhelming or exhausting. The multiple-response question asks about frustrations right now; it does not establish what caused burnout or require respondents to choose only one problem.
| ID | Finding and qualification | Population, actual period and base | Original source and locator |
|---|---|---|---|
| F03 | Repeated rejection/lack of interest frustrated 26.1%; conversations going nowhere frustrated 31.7%. Definition: Q26 asks which aspects are most frustrating right now; multiple selections. Qualification: Not an exposure rate or causal explanation of burnout; overlapping choices cannot be added. | Study-defined single adults 18+; codebook frequency tables n=4,952 United States March–April 2026 Published eligible item/group base(s): 4,952. An overall report n is not a subgroup base. | Match / Kinsey Institute Published University release 2026-09-14; Match release 2026-09-10 Codebook pp.75–76, Q26r1/r2 Study methods and limits |
| F04 | Mismatched intentions/goals frustrated 29.4%; apps feeling overwhelming/exhausting frustrated 21.6%. Definition: Q26 asks which aspects are most frustrating right now; multiple selections. Qualification: Not an exposure rate or causal explanation of burnout; overlapping choices cannot be added. | Study-defined single adults 18+; codebook frequency tables n=4,952 United States March–April 2026 Published eligible item/group base(s): 4,952. An overall report n is not a subgroup base. | Match / Kinsey Institute Published University release 2026-09-14; Match release 2026-09-10 Codebook p.76, Q26r3/r4 Study methods and limits |
| F05 | Pressure to present oneself a certain way frustrated 22.3%; dishonest/inauthentic presentation by others frustrated 43.6%. Definition: Q26 asks which aspects are most frustrating right now; multiple selections. Qualification: Not an exposure rate or causal explanation of burnout; overlapping choices cannot be added. | Study-defined single adults 18+; codebook frequency tables n=4,952 United States March–April 2026 Published eligible item/group base(s): 4,952. An overall report n is not a subgroup base. | Match / Kinsey Institute Published University release 2026-09-14; Match release 2026-09-10 Codebook p.77, Q26r5/r6 Study methods and limits |
| F06 | Bad behavior such as ghosting/disrespect frustrated 37.9%; bad dates such as awkwardness/no chemistry frustrated 33.7%. Definition: Q26 asks which aspects are most frustrating right now; multiple selections. Qualification: Not an exposure rate or causal explanation of burnout; overlapping choices cannot be added. | Study-defined single adults 18+; codebook frequency tables n=4,952 United States March–April 2026 Published eligible item/group base(s): 4,952. An overall report n is not a subgroup base. | Match / Kinsey Institute Published University release 2026-09-14; Match release 2026-09-10 Codebook pp.77–78, Q26r7/r8 Study methods and limits |
| F07 | Safety concerns frustrated 29.4%, dating time/effort 27.8% and uncertainty about dating in line with one’s values 18.1%; 9.9% selected not finding dating frustrating. Definition: Q26 asks which aspects are most frustrating right now; multiple selections. Qualification: Not an exposure rate or causal explanation of burnout; overlapping choices cannot be added. | Study-defined single adults 18+; codebook frequency tables n=4,952 United States March–April 2026 Published eligible item/group base(s): 4,952. An overall report n is not a subgroup base. | Match / Kinsey Institute Published University release 2026-09-14; Match release 2026-09-10 Codebook pp.78–79, Q26r9/r10/r11/r13 Study methods and limits |
How does the denominator change the dating-break statistic?
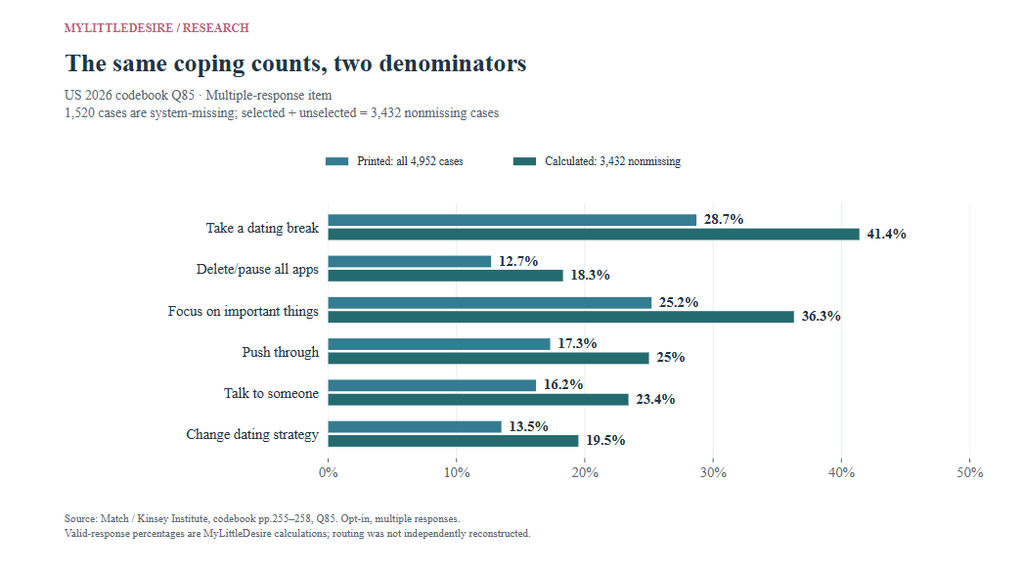
The Q85 break item has 1,420 selected, 2,012 not selected and 1,520 system-missing cases. The printed 28.7% uses all 4,952 cases. MyLittleDesire’s 41.4% calculation uses the 3,432 nonmissing responses: 100 × 1,420 / (1,420 + 2,012). This changes the denominator, not the underlying behavior or the observation date.
| ID | Finding and qualification | Population, actual period and base | Original source and locator |
|---|---|---|---|
| F08 | Taking a dating break was selected by 1,420 cases; the codebook prints 28.7% of all cases. Definition: Q85 multiple-response coping item; printed percent denominator is all 4,952 cases. Qualification: Every selected item has 1,520 system-missing cases. Selected plus unselected counts yield 3,432 nonmissing; recalculated valid-response percentages are explicitly MyLittleDesire arithmetic. Missing is not a no response; no proven remedy or clinical diagnosis follows. | Study-defined single adults 18+; codebook frequency tables n=4,952 United States March–April 2026 Published eligible item/group base(s): 4,952. An overall report n is not a subgroup base. | Match / Kinsey Institute Published University release 2026-09-14; Match release 2026-09-10 Codebook p.255, Q85r1 Study methods and limits |
| F09 | Deleting/pausing all dating apps was selected by 628 cases; the codebook prints 12.7% of all cases. Definition: Q85 multiple-response coping item; printed percent denominator is all 4,952 cases. Qualification: Every selected item has 1,520 system-missing cases. Selected plus unselected counts yield 3,432 nonmissing; recalculated valid-response percentages are explicitly MyLittleDesire arithmetic. Missing is not a no response; no proven remedy or clinical diagnosis follows. | Study-defined single adults 18+; codebook frequency tables n=4,952 United States March–April 2026 Published eligible item/group base(s): 4,952. An overall report n is not a subgroup base. | Match / Kinsey Institute Published University release 2026-09-14; Match release 2026-09-10 Codebook p.256, Q85r2 Study methods and limits |
| F10 | Changing strategy was selected by 670 cases (13.5% of all cases); pushing through by 859 (17.3%). Definition: Q85 multiple-response coping item; printed percent denominator is all 4,952 cases. Qualification: Every selected item has 1,520 system-missing cases. Selected plus unselected counts yield 3,432 nonmissing; recalculated valid-response percentages are explicitly MyLittleDesire arithmetic. Missing is not a no response; no proven remedy or clinical diagnosis follows. | Study-defined single adults 18+; codebook frequency tables n=4,952 United States March–April 2026 Published eligible item/group base(s): 4,952. An overall report n is not a subgroup base. | Match / Kinsey Institute Published University release 2026-09-14; Match release 2026-09-10 Codebook p.256, Q85r3/r4 Study methods and limits |
| F11 | Having friends take over dating apps was selected by 397 cases; the codebook prints 8.0% of all cases. Definition: Q85 multiple-response coping item; printed percent denominator is all 4,952 cases. Qualification: Every selected item has 1,520 system-missing cases. Selected plus unselected counts yield 3,432 nonmissing; recalculated valid-response percentages are explicitly MyLittleDesire arithmetic. Missing is not a no response; no proven remedy or clinical diagnosis follows. | Study-defined single adults 18+; codebook frequency tables n=4,952 United States March–April 2026 Published eligible item/group base(s): 4,952. An overall report n is not a subgroup base. | Match / Kinsey Institute Published University release 2026-09-14; Match release 2026-09-10 Codebook p.257, Q85r5 Study methods and limits |
| F12 | Focusing on friends, family, hobbies or other personally important things was selected by 1,246 cases (25.2% of all cases). Definition: Q85 multiple-response coping item; printed percent denominator is all 4,952 cases. Qualification: Every selected item has 1,520 system-missing cases. Selected plus unselected counts yield 3,432 nonmissing; recalculated valid-response percentages are explicitly MyLittleDesire arithmetic. Missing is not a no response; no proven remedy or clinical diagnosis follows. | Study-defined single adults 18+; codebook frequency tables n=4,952 United States March–April 2026 Published eligible item/group base(s): 4,952. An overall report n is not a subgroup base. | Match / Kinsey Institute Published University release 2026-09-14; Match release 2026-09-10 Codebook p.257, Q85r6 Study methods and limits |
| F13 | Taking a trip/vacation was selected by 682 cases; the codebook prints 13.8% of all cases. Definition: Q85 multiple-response coping item; printed percent denominator is all 4,952 cases. Qualification: Every selected item has 1,520 system-missing cases. Selected plus unselected counts yield 3,432 nonmissing; recalculated valid-response percentages are explicitly MyLittleDesire arithmetic. Missing is not a no response; no proven remedy or clinical diagnosis follows. | Study-defined single adults 18+; codebook frequency tables n=4,952 United States March–April 2026 Published eligible item/group base(s): 4,952. An overall report n is not a subgroup base. | Match / Kinsey Institute Published University release 2026-09-14; Match release 2026-09-10 Codebook p.257, Q85r7 Study methods and limits |
| F14 | Talking to someone was selected by 804 cases (16.2% of all cases); doing nothing by 454 (9.2%). Definition: Q85 multiple-response coping item; printed percent denominator is all 4,952 cases. Qualification: Every selected item has 1,520 system-missing cases. Selected plus unselected counts yield 3,432 nonmissing; recalculated valid-response percentages are explicitly MyLittleDesire arithmetic. Missing is not a no response; no proven remedy or clinical diagnosis follows. | Study-defined single adults 18+; codebook frequency tables n=4,952 United States March–April 2026 Published eligible item/group base(s): 4,952. An overall report n is not a subgroup base. | Match / Kinsey Institute Published University release 2026-09-14; Match release 2026-09-10 Codebook p.258, Q85r8/r10 Study methods and limits |
What did the widely cited 78% app-exhaustion survey measure?
Forbes Health’s survey covered 1,000 US adults who had used a dating app in the preceding year. Its 78% includes sometimes, often or always feeling emotionally, mentally or physically exhausted by apps. The current page is dated July 2025, but fieldwork was March 27–April 1, 2024. The result does not mean 78% of all adults were severely burned out.
| ID | Finding and qualification | Population, actual period and base | Original source and locator |
|---|---|---|---|
| F15 | 78% felt emotionally, mentally or physically exhausted by dating apps sometimes, often or always. Definition: Published frequency threshold, rather than severe/constant exhaustion only. Qualification: Past-year app users, not all U.S. adults. Item/generation/gender valid n not published. Self-reports do not establish causes or diagnoses. | Adults who used a dating app in the prior year United States 2024-03-27 to 2024-04-01 Published eligible item/group base(s): 1,000. An overall report n is not a subgroup base. | Forbes Health / OnePoll Published Current page displays 2025-07-25 How Dating Apps Make People Feel Study methods and limits |
| F16 | Exhaustion at that threshold was reported by 80% of Millennials, 79% of Gen Z, 78% of Gen X and 70% of Baby Boomers. Definition: Generation breakdown of the same exhaustion item. Qualification: Past-year app users, not all U.S. adults. Item/generation/gender valid n not published. Self-reports do not establish causes or diagnoses. | Adults who used a dating app in the prior year United States 2024-03-27 to 2024-04-01 Exact item/subgroup valid n is not printed beside these selected figures. An overall report n is not a subgroup base. | Forbes Health / OnePoll Published Current page displays 2025-07-25 How Dating Apps Make People Feel Study methods and limits |
| F17 | 80% of women and 74% of men reported some level of app exhaustion. Definition: Gender comparison in the publisher’s burnout/exhaustion section. Qualification: Past-year app users, not all U.S. adults. Item/generation/gender valid n not published. Self-reports do not establish causes or diagnoses. | Adults who used a dating app in the prior year United States 2024-03-27 to 2024-04-01 Exact item/subgroup valid n is not printed beside these selected figures. An overall report n is not a subgroup base. | Forbes Health / OnePoll Published Current page displays 2025-07-25 How Dating Apps Make People Feel Study methods and limits |
| F18 | 40% cited failing to find a good connection and 35% disappointment in people among reasons for fatigue. Definition: Reported reasons; the article describes these as shares of all respondents. Qualification: Past-year app users, not all U.S. adults. Item/generation/gender valid n not published. Self-reports do not establish causes or diagnoses. | Adults who used a dating app in the prior year United States 2024-03-27 to 2024-04-01 Published eligible item/group base(s): 1,000. An overall report n is not a subgroup base. | Forbes Health / OnePoll Published Current page displays 2025-07-25 How Dating Apps Make People Feel Study methods and limits |
| F19 | Feeling rejected was cited by 27%, repetitive conversations by 24% and swiping by 22%. Definition: Multiple possible reported reasons, not mutually exclusive causes. Qualification: Past-year app users, not all U.S. adults. Item/generation/gender valid n not published. Self-reports do not establish causes or diagnoses. | Adults who used a dating app in the prior year United States 2024-03-27 to 2024-04-01 Exact item/subgroup valid n is not printed beside these selected figures. An overall report n is not a subgroup base. | Forbes Health / OnePoll Published Current page displays 2025-07-25 How Dating Apps Make People Feel Study methods and limits |
| F20 | Time on apps was cited by 21%, self-presentation pressure by 20% and maintaining profiles/juggling apps by 18%. Definition: Publisher’s reported fatigue reasons; item base not separately stated. Qualification: Past-year app users, not all U.S. adults. Item/generation/gender valid n not published. Self-reports do not establish causes or diagnoses. | Adults who used a dating app in the prior year United States 2024-03-27 to 2024-04-01 Exact item/subgroup valid n is not printed beside these selected figures. An overall report n is not a subgroup base. | Forbes Health / OnePoll Published Current page displays 2025-07-25 How Dating Apps Make People Feel Study methods and limits |
| F21 | App use also made 39% feel confident, 33% attractive and 24% wanted. Definition: Positive self-reported feelings, not the complement of exhaustion. Qualification: Past-year app users, not all U.S. adults. Item/generation/gender valid n not published. Self-reports do not establish causes or diagnoses. | Adults who used a dating app in the prior year United States 2024-03-27 to 2024-04-01 Exact item/subgroup valid n is not printed beside these selected figures. An overall report n is not a subgroup base. | Forbes Health / OnePoll Published Current page displays 2025-07-25 Making Dating Apps Work for You Study methods and limits |
| F22 | Reported daily app time was nearly 51 minutes overall, 52 minutes for women and 49 for men. Definition: Self-reported daily time, not device-logged use or a burnout threshold. Qualification: Past-year app users, not all U.S. adults. Item/generation/gender valid n not published. Self-reports do not establish causes or diagnoses. | Adults who used a dating app in the prior year United States 2024-03-27 to 2024-04-01 Exact item/subgroup valid n is not printed beside these selected figures. An overall report n is not a subgroup base. | Forbes Health / OnePoll Published Current page displays 2025-07-25 How Much Time Do People Spend Each Day on Dating Apps? Study methods and limits |
Can too many and too few messages both be tiring?
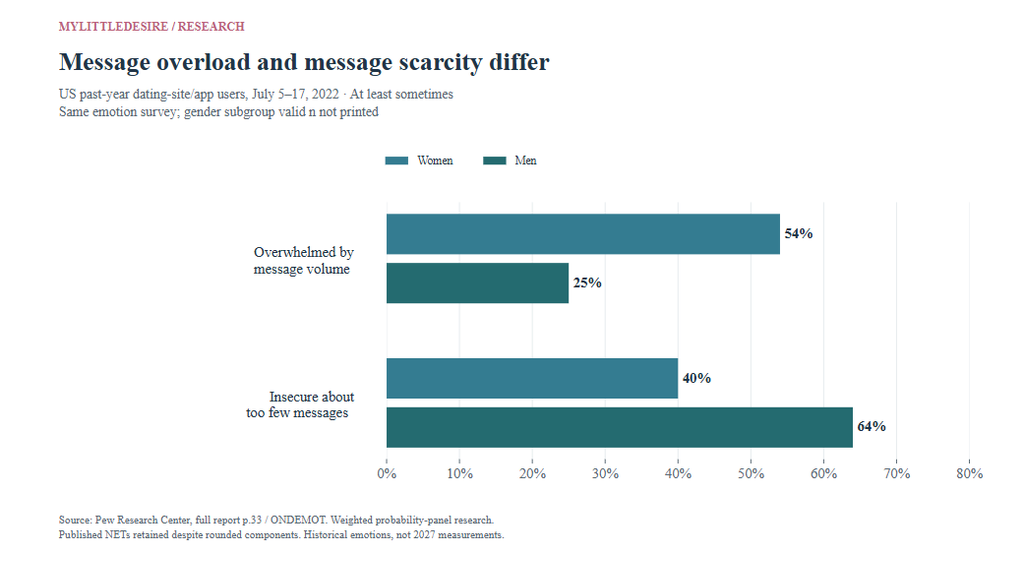
Pew’s July 2022 past-year users reported different experiences. Women more often reported message overload, while men more often reported insecurity about too few messages. These are two distinct emotion questions. Their gender differences should not be collapsed into one burnout score or assumed to describe every individual.
| ID | Finding and qualification | Population, actual period and base | Original source and locator |
|---|---|---|---|
| F23 | 53% of ever-users described online dating positively and 46% negatively. Definition: Very/somewhat positive versus very/somewhat negative overall experience. Qualification: Actual July 2022 responses, not 2027 measurements or diagnosed burnout. Preserve published NETs and frequency; separate marginal answers do not reveal individual overlaps. | US ever-users of dating sites/apps, n=3,128 United States 2022-07-05 to 2022-07-17 Published eligible item/group base(s): 3,128. An overall report n is not a subgroup base. | Pew Research Center Published 2023-02-02 Full report printed pp.28–29; topline ONDEXP Study methods and limits |
| F24 | 55% of past-year users felt insecure about too few messages at least sometimes; 36% felt overwhelmed by message volume at least sometimes. Definition: Two ONDEMOT items, published NETs. Qualification: Actual July 2022 responses, not 2027 measurements or diagnosed burnout. Preserve published NETs and frequency; separate marginal answers do not reveal individual overlaps. | US past-year dating-site/app users; emotion item n=951 United States 2022-07-05 to 2022-07-17 Published eligible item/group base(s): 951. An overall report n is not a subgroup base. | Pew Research Center Published 2023-02-02 Full report printed p.33; topline ONDEMOT, physical p.9 Study methods and limits |
| F25 | 54% of women and 25% of men felt overwhelmed by message volume at least sometimes. Definition: Published gender NETs for the same message-volume item. Qualification: Actual July 2022 responses, not 2027 measurements or diagnosed burnout. Preserve published NETs and frequency; separate marginal answers do not reveal individual overlaps. | US past-year dating-site/app users; emotion item n=951 United States 2022-07-05 to 2022-07-17 Exact item/subgroup valid n is not printed beside these selected figures. An overall report n is not a subgroup base. | Pew Research Center Published 2023-02-02 Full report printed p.33; topline ONDEMOT, physical p.9 Study methods and limits |
| F26 | 64% of men and 40% of women felt insecure about too few messages at least sometimes. Definition: Published gender NETs for the same message-lack item. Qualification: Actual July 2022 responses, not 2027 measurements or diagnosed burnout. Preserve published NETs and frequency; separate marginal answers do not reveal individual overlaps. | US past-year dating-site/app users; emotion item n=951 United States 2022-07-05 to 2022-07-17 Exact item/subgroup valid n is not printed beside these selected figures. An overall report n is not a subgroup base. | Pew Research Center Published 2023-02-02 Full report printed p.33; topline ONDEMOT, physical p.9 Study methods and limits |
| F27 | 19% of women and 6% of men often felt overwhelmed by message volume. Definition: Often threshold, stricter than at least sometimes. Qualification: Actual July 2022 responses, not 2027 measurements or diagnosed burnout. Preserve published NETs and frequency; separate marginal answers do not reveal individual overlaps. | US past-year dating-site/app users; emotion item n=951 United States 2022-07-05 to 2022-07-17 Exact item/subgroup valid n is not printed beside these selected figures. An overall report n is not a subgroup base. | Pew Research Center Published 2023-02-02 Full report printed p.33; topline ONDEMOT, physical p.9 Study methods and limits |
| F28 | 20% of men and 9% of women often felt insecure about too few messages. Definition: Often threshold for lack-of-messages insecurity. Qualification: Actual July 2022 responses, not 2027 measurements or diagnosed burnout. Preserve published NETs and frequency; separate marginal answers do not reveal individual overlaps. | US past-year dating-site/app users; emotion item n=951 United States 2022-07-05 to 2022-07-17 Exact item/subgroup valid n is not printed beside these selected figures. An overall report n is not a subgroup base. | Pew Research Center Published 2023-02-02 Full report printed p.33; topline ONDEMOT, physical p.9 Study methods and limits |
| F29 | 47% of LGB past-year users versus 30% of straight past-year users felt overwhelmed at least sometimes. Definition: Sexual-orientation comparison; LGB categories as the source defines them. Qualification: Actual July 2022 responses, not 2027 measurements or diagnosed burnout. Preserve published NETs and frequency; separate marginal answers do not reveal individual overlaps. | US past-year dating-site/app users; emotion item n=951 United States 2022-07-05 to 2022-07-17 Exact item/subgroup valid n is not printed beside these selected figures. An overall report n is not a subgroup base. | Pew Research Center Published 2023-02-02 Full report printed p.34 Study methods and limits |
| F30 | 64% of past-year users who had ever paid for dating services/features felt insecure about message scarcity, compared with 48% who had never paid. Definition: Different payment-history groups, not a randomized paid-feature experiment. Qualification: Actual July 2022 responses, not 2027 measurements or diagnosed burnout. Preserve published NETs and frequency; separate marginal answers do not reveal individual overlaps. | US past-year dating-site/app users; emotion item n=951 United States 2022-07-05 to 2022-07-17 Exact item/subgroup valid n is not printed beside these selected figures. An overall report n is not a subgroup base. | Pew Research Center Published 2023-02-02 Full report printed p.34 Study methods and limits |
| F31 | 88% were disappointed in people they saw at least sometimes, versus 79% excited; the often shares were 36% and 17%. Definition: Two emotion items at two separate frequency thresholds. Qualification: Actual July 2022 responses, not 2027 measurements or diagnosed burnout. Preserve published NETs and frequency; separate marginal answers do not reveal individual overlaps. | US past-year dating-site/app users; emotion item n=951 United States 2022-07-05 to 2022-07-17 Published eligible item/group base(s): 951. An overall report n is not a subgroup base. | Pew Research Center Published 2023-02-02 Full report printed p.33; topline ONDEMOT, physical p.9 Study methods and limits |
How do fatigue, break needs and help seeking differ?
The undated Healthy Framework survey asked 1,000 US singles aged 18–54 about ever feeling emotional fatigue or burnout. It also asked about feeling a need for a break and seeking professional help. These different questions have different results. Equal age/gender quotas, missing fieldwork dates and unreported recruitment limit national and current-year interpretation.
| ID | Finding and qualification | Population, actual period and base | Original source and locator |
|---|---|---|---|
| F32 | 79.1% reported ever feeling emotional fatigue or burnout: 15.4% severe, 39.7% moderate and 24.0% mild; 20.9% said never. Definition: Ever-experienced single question combining fatigue and burnout. Qualification: Historical/undated quota sample of singles 18–54, not a fresh national adult prevalence. Recruitment, weighting and fieldwork dates unavailable. Self-reports, not clinical diagnoses or treatment effects. | Single adults 18–54 who used a dating app in prior 12 months United States Not stated on the readable original page Published eligible item/group base(s): 1,000. An overall report n is not a subgroup base. | Healthy Framework Published Undated original page; publication date not independently established Overall Results – Dating App Burnout Study methods and limits |
| F33 | 81.4% of women and 76.8% of men reported any level of fatigue/burnout. Definition: Gender total explicitly reported by the original publisher. Qualification: Historical/undated quota sample of singles 18–54, not a fresh national adult prevalence. Recruitment, weighting and fieldwork dates unavailable. Self-reports, not clinical diagnoses or treatment effects. | Single adults 18–54 who used a dating app in prior 12 months United States Not stated on the readable original page Published eligible item/group base(s): 500. An overall report n is not a subgroup base. | Healthy Framework Published Undated original page; publication date not independently established Key Takeaways / Results by Gender – Dating App Burnout Study methods and limits |
| F34 | Severe fatigue/burnout was 14.4% at ages 18–24, 18.4% at 25–34, 16.4% at 35–44 and 12.4% at 45–54. Definition: Single severity category, not any-fatigue totals. Qualification: Historical/undated quota sample of singles 18–54, not a fresh national adult prevalence. Recruitment, weighting and fieldwork dates unavailable. Self-reports, not clinical diagnoses or treatment effects. | Single adults 18–54 who used a dating app in prior 12 months United States Not stated on the readable original page Published eligible item/group base(s): 250. An overall report n is not a subgroup base. | Healthy Framework Published Undated original page; publication date not independently established Results by Age – Dating App Burnout Study methods and limits |
| F35 | 89.8% had ever felt a need for a dating-app break: 28.9% often, 48.2% occasionally and 12.7% rarely; 10.2% never. Definition: Need for a break, not confirmation of taking one or a therapeutic effect. Qualification: Historical/undated quota sample of singles 18–54, not a fresh national adult prevalence. Recruitment, weighting and fieldwork dates unavailable. Self-reports, not clinical diagnoses or treatment effects. | Single adults 18–54 who used a dating app in prior 12 months United States Not stated on the readable original page Published eligible item/group base(s): 1,000. An overall report n is not a subgroup base. | Healthy Framework Published Undated original page; publication date not independently established Overall Results – Taking a Break Study methods and limits |
| F36 | 33.0% of women and 24.8% of men often felt a need for an app break. Definition: Same often-need question, gender bases n=500 each. Qualification: Historical/undated quota sample of singles 18–54, not a fresh national adult prevalence. Recruitment, weighting and fieldwork dates unavailable. Self-reports, not clinical diagnoses or treatment effects. | Single adults 18–54 who used a dating app in prior 12 months United States Not stated on the readable original page Published eligible item/group base(s): 500. An overall report n is not a subgroup base. | Healthy Framework Published Undated original page; publication date not independently established Results by Gender – Taking a Break Study methods and limits |
| F37 | 27.2% said they had sought professional help as a result of online dating; 29.6% of men and 24.8% of women said so. Definition: All survey respondents answered the help-seeking question; not only those who reported fatigue. Qualification: Historical/undated quota sample of singles 18–54, not a fresh national adult prevalence. Recruitment, weighting and fieldwork dates unavailable. Self-reports, not clinical diagnoses or treatment effects. | Single adults 18–54 who used a dating app in prior 12 months United States Not stated on the readable original page Published eligible item/group base(s): 500, 1,000. An overall report n is not a subgroup base. | Healthy Framework Published Undated original page; publication date not independently established Overall / Results by Gender – Seeking Professional Help Study methods and limits |
What do surveyed Gen Z app users report about social pressure?
Hily’s December 2025 research describes Gen Z users of its service, rather than all Gen Z adults. It reports self-attributed pressure from social-media content and conversations with friends, family or colleagues. Those answers can describe perceived pressure without demonstrating that the content or conversations caused fatigue.
| ID | Finding and qualification | Population, actual period and base | Original source and locator |
|---|---|---|---|
| F38 | 57% of women and 60% of men said they know social media’s perfect dating image is fake. Definition: Recognition of an idealized dating image, not a burnout screen. Qualification: December 2025 Hily Gen Z users, not all Gen Z. Gender/item n unavailable; self-attributed associations and separate margins cannot establish causal pathways or individual contradictions. | Gen Z Hily daters; exact age bounds and gender/item bases not supplied United States December 2025; retrospective dating questions refer to 2025 Exact item/subgroup valid n is not printed beside these selected figures. An overall report n is not a subgroup base. | Hily Published 2026-01-29 Truth #1 opening Study methods and limits |
| F39 | Dating content left 48% of women and 58% of men feeling they did not date enough. Definition: Self-described response to social-media dating content. Qualification: December 2025 Hily Gen Z users, not all Gen Z. Gender/item n unavailable; self-attributed associations and separate margins cannot establish causal pathways or individual contradictions. | Gen Z Hily daters; exact age bounds and gender/item bases not supplied United States December 2025; retrospective dating questions refer to 2025 Exact item/subgroup valid n is not printed beside these selected figures. An overall report n is not a subgroup base. | Hily Published 2026-01-29 Truth #1: Frequency of dates Study methods and limits |
| F40 | 43% of women and 51% of men reported zero dates in 2025. Definition: Retrospective date-frequency response in the same service-user survey. Qualification: December 2025 Hily Gen Z users, not all Gen Z. Gender/item n unavailable; self-attributed associations and separate margins cannot establish causal pathways or individual contradictions. | Gen Z Hily daters; exact age bounds and gender/item bases not supplied United States December 2025; retrospective dating questions refer to 2025 Exact item/subgroup valid n is not printed beside these selected figures. An overall report n is not a subgroup base. | Hily Published 2026-01-29 Truth #1: Frequency of dates Study methods and limits |
| F41 | After discussing dating with their circles, 55% of women and 65% of men felt they did not date enough; 34% and 28% felt discouraged from dating. Definition: Separate reported consequences of peer/family/colleague discussions. Qualification: December 2025 Hily Gen Z users, not all Gen Z. Gender/item n unavailable; self-attributed associations and separate margins cannot establish causal pathways or individual contradictions. | Gen Z Hily daters; exact age bounds and gender/item bases not supplied United States December 2025; retrospective dating questions refer to 2025 Exact item/subgroup valid n is not printed beside these selected figures. An overall report n is not a subgroup base. | Hily Published 2026-01-29 Truth #2 consequence bullets Study methods and limits |
| F42 | 39% of women and 23% of men deemed their partners not good enough after discussions with their circles. Definition: Self-attributed peer influence on partner evaluation. Qualification: December 2025 Hily Gen Z users, not all Gen Z. Gender/item n unavailable; self-attributed associations and separate margins cannot establish causal pathways or individual contradictions. | Gen Z Hily daters; exact age bounds and gender/item bases not supplied United States December 2025; retrospective dating questions refer to 2025 Exact item/subgroup valid n is not printed beside these selected figures. An overall report n is not a subgroup base. | Hily Published 2026-01-29 Truth #2 consequence bullets Study methods and limits |
| F43 | 24% of women and 23% of men wanted to stay single after discussions with their circles. Definition: A stated consequence, not overall preference for lifelong singlehood. Qualification: December 2025 Hily Gen Z users, not all Gen Z. Gender/item n unavailable; self-attributed associations and separate margins cannot establish causal pathways or individual contradictions. | Gen Z Hily daters; exact age bounds and gender/item bases not supplied United States December 2025; retrospective dating questions refer to 2025 Exact item/subgroup valid n is not printed beside these selected figures. An overall report n is not a subgroup base. | Hily Published 2026-01-29 Truth #2 consequence bullets Study methods and limits |
Do expectations of profile attention match stated readiness?
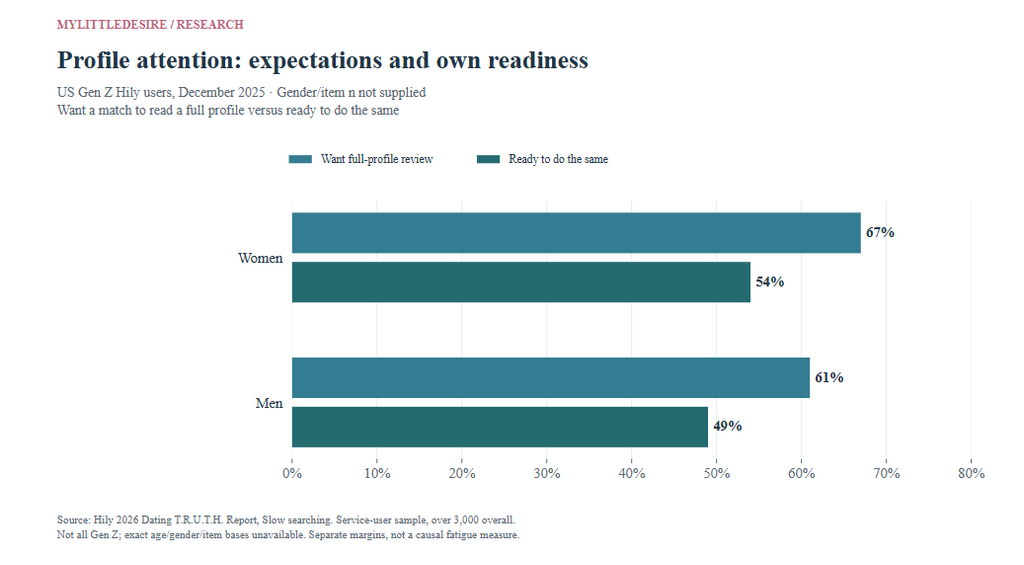
In Hily’s sample, 67% of women wanted a match to read their full profile, while 54% were ready to do the same; the men’s figures were 61% and 49%. The 13- and 12-point differences compare separate marginal questions. They cannot identify inconsistent individuals, explain burnout causally or prove that a change will improve outcomes.
| ID | Finding and qualification | Population, actual period and base | Original source and locator |
|---|---|---|---|
| F44 | 62% of women and 55% of men were open to in-person romantic meetings; 38% and 42% felt anxious approaching strangers. Definition: Separate openness and approach-anxiety items; not mutually exclusive categories. Qualification: December 2025 Hily Gen Z users, not all Gen Z. Gender/item n unavailable; self-attributed associations and separate margins cannot establish causal pathways or individual contradictions. | Gen Z Hily daters; exact age bounds and gender/item bases not supplied United States December 2025; retrospective dating questions refer to 2025 Exact item/subgroup valid n is not printed beside these selected figures. An overall report n is not a subgroup base. | Hily Published 2026-01-29 Return to Reality: Meet-cute mindset Study methods and limits |
| F45 | 67% of women and 61% of men wanted a match to read their full profile before liking; 54% and 49% were ready to do the same. Definition: Other-person expectation versus own readiness, separate margins. Qualification: December 2025 Hily Gen Z users, not all Gen Z. Gender/item n unavailable; self-attributed associations and separate margins cannot establish causal pathways or individual contradictions. | Gen Z Hily daters; exact age bounds and gender/item bases not supplied United States December 2025; retrospective dating questions refer to 2025 Exact item/subgroup valid n is not printed beside these selected figures. An overall report n is not a subgroup base. | Hily Published 2026-01-29 Return to Reality: Slow searching Study methods and limits |
| F46 | 48% of women and 53% of men planned to reduce social-media use to limit its influence on dating perceptions. Definition: Intention, not a measured behavior change or proven intervention. Qualification: December 2025 Hily Gen Z users, not all Gen Z. Gender/item n unavailable; self-attributed associations and separate margins cannot establish causal pathways or individual contradictions. | Gen Z Hily daters; exact age bounds and gender/item bases not supplied United States December 2025; retrospective dating questions refer to 2025 Exact item/subgroup valid n is not printed beside these selected figures. An overall report n is not a subgroup base. | Hily Published 2026-01-29 Return to Reality: Appstinence Study methods and limits |
What does the newer UK dating-fatigue survey add?
A sponsor release reports dating-app fatigue among 60% of 1,000 actively dating UK singles surveyed in September 2026. It also reports that 49% preferred meeting partners more naturally. The complete fatigue question and frequency threshold were not supplied, and a meeting preference is not an observed decision to quit apps.
| ID | Finding and qualification | Population, actual period and base | Original source and locator |
|---|---|---|---|
| F47 | 60% of the surveyed UK active singles were described as experiencing dating-app fatigue. Definition: Sponsor’s reported fatigue item; complete frequency threshold not supplied. Qualification: Active singles, not all adults or all app users; commercial car promotion and incomplete questionnaire. | UK single people actively dating; exact age eligibility not stated United Kingdom September 2026 Exact item/subgroup valid n is not printed beside these selected figures. An overall report n is not a subgroup base. | Alfa Romeo / OnePoll Published 2026-10-08 Release headline/bullets and research footnote Study methods and limits |
| F48 | 49% preferred to meet potential partners more naturally. Definition: Meeting preference, not actual app deletion. Qualification: No claim that these are the same people as the 60% fatigued group, that the two percentages can be subtracted, or that a road trip treats burnout. | UK single people actively dating; exact age eligibility not stated United Kingdom September 2026 Exact item/subgroup valid n is not printed beside these selected figures. An overall report n is not a subgroup base. | Alfa Romeo / OnePoll Published 2026-10-08 Release opening and research footnote Study methods and limits |
What can Australian research tell us—and what does it measure?
Real Insurance’s digital-fatigue question includes messages, group chats and social-media groups as well as dating apps. Its separate dating-difficulty question has a routed n=705. Coffee Meets Bagel’s younger-professional survey reports broad app challenges and lists mental fatigue among them; neither the broad digital result nor its 91% challenges figure is a dating-burnout prevalence estimate.
| ID | Finding and qualification | Population, actual period and base | Original source and locator |
|---|---|---|---|
| F49 | 35% felt digital-relationship fatigue at least occasionally: 9% frequently and 26% occasionally. Reported NETs were 41% for women, 28% for men, 73% for Gen Z and 54% for Gen Y. Definition: Online relationship maintenance includes chats, messages, groups and dating apps. Qualification: Broader than dating burnout. No item/generation/gender valid bases printed; all 1,204 is the report sample, not necessarily every subgroup denominator. | Australian adults; subgroup valid bases not printed beside selected findings Australia 2025-08-13 to 2025-08-18 Exact item/subgroup valid n is not printed beside these selected figures. An overall report n is not a subgroup base. | Real Insurance / MYMAVINS Published 2025-11-20 webpage Full report printed p.33, Digital fatigue Study methods and limits |
| F50 | 51% said dating had become harder in recent years, including 57% of women and 45% of men. Definition: Perceived change in dating difficulty, not a measured time-series burnout trend. Qualification: Not fatigue prevalence, national incidence or a causal measure; age/gender bases not printed beside these figures. | Australian respondents who had tried to date/meet romantic partners, n=705; gender subgroup n unreported Australia 2025-08-13 to 2025-08-18 Published eligible item/group base(s): 705. An overall report n is not a subgroup base. | Real Insurance / MYMAVINS Published 2025-11-20 webpage Full report printed p.18, routed n=705; original release p.3 Study methods and limits |
| F51 | 91% described dating apps as challenging; the release lists ghosting at 41%, mental fatigue at 38% and shallow profiles at 33% among challenges. Definition: Separate broad challenges and named pain points; full item routing/denominators not established. Qualification: The 91% is not a burnout rate. Do not assume the 38% mental-fatigue denominator is all 1,063, or generalize to all Australians, singles or app users. | Working professionals 21–35 actively seeking a relationship or open to one Australia November 2025 Exact item/subgroup valid n is not printed beside these selected figures. An overall report n is not a subgroup base. | Coffee Meets Bagel / YouGov Published Page 2026-02-12; release text dated 2026-02-02 Dating frustrations; About the Report Study methods and limits |
What does longitudinal research add?
The accessible Sharabi, Von Feldt and Ha abstract reports rising emotional exhaustion and inefficacy across four waves over 12 weeks, with 493 active single app users initially and 190 at the last wave. It reports associations with pre-existing difficulties. This is different evidence from a one-time opinion poll, but retention is not a burnout count, and we did not audit full result tables or establish the fieldwork dates. First online publication was October 19, 2024; the journal issue is January 2026.
20 calculations with reproducible inputs
Category sums and valid-response shares are percentages. Subtractions between percentages are percentage-point differences. All are descriptive calculations from identified inputs; no new statistical tests, causal effects or individual response overlaps are inferred.
| ID | Calculation | Arithmetic and unit | Original inputs and qualification |
|---|---|---|---|
| C01 | Dating burnout: moderate or complete, summed printed categories | 17.3 + 15.9 = 33.2 percent | F01 Rounded codebook category sum, not a validated clinical cutoff or a probability-based national estimate. |
| C02 | Dating burnout: a little, moderate or complete, summed printed categories | 22.7 + 17.3 + 15.9 = 55.9 percent | F01 Nested threshold within the same frequency table; do not add the threshold bars together. |
| C03 | General-life burnout: moderate or complete, summed printed categories | 23.6 + 16.6 = 40.2 percent | F02 Broader context, not dating-only fatigue; rounded category sum. |
| C04 | Dishonesty frustration minus apps-overwhelming frustration | 43.6 − 21.6 = 22.0 percentage points | F05 / F04 Same multiple-response Q26 base; not mutually exclusive causes or a test of which factor caused burnout. |
| C05 | Bad-behavior frustration minus apps-overwhelming frustration | 37.9 − 21.6 = 16.3 percentage points | F06 / F04 Same Q26 question; descriptive margins, no new significance test. |
| C06 | Take a dating break: share among nonmissing Q85 responses | 100 × 1420 / (1420 + 2012) = 41.4 percent | F08 100 × selected / (selected + not selected). Nonmissing n=3,432 for this item, compared with printed all-case n=4,952. No missing-as-no assumption or proven treatment effect. |
| C07 | Delete/pause all apps: share among nonmissing Q85 responses | 100 × 628 / (628 + 2804) = 18.3 percent | F09 100 × selected / (selected + not selected). Nonmissing n=3,432 for this item, compared with printed all-case n=4,952. No missing-as-no assumption or proven treatment effect. |
| C08 | Focus on personally important things: share among nonmissing Q85 responses | 100 × 1246 / (1246 + 2186) = 36.3 percent | F12 100 × selected / (selected + not selected). Nonmissing n=3,432 for this item, compared with printed all-case n=4,952. No missing-as-no assumption or proven treatment effect. |
| C09 | Push through: share among nonmissing Q85 responses | 100 × 859 / (859 + 2573) = 25.0 percent | F10 100 × selected / (selected + not selected). Nonmissing n=3,432 for this item, compared with printed all-case n=4,952. No missing-as-no assumption or proven treatment effect. |
| C10 | Talk to someone: share among nonmissing Q85 responses | 100 × 804 / (804 + 2628) = 23.4 percent | F14 100 × selected / (selected + not selected). Nonmissing n=3,432 for this item, compared with printed all-case n=4,952. No missing-as-no assumption or proven treatment effect. |
| C11 | Change dating strategy: share among nonmissing Q85 responses | 100 × 670 / (670 + 2762) = 19.5 percent | F10 100 × selected / (selected + not selected). Nonmissing n=3,432 for this item, compared with printed all-case n=4,952. No missing-as-no assumption or proven treatment effect. |
| C12 | Forbes exhaustion: women minus men | 80 − 74 = 6.0 percentage points | F17 Same survey; subgroup n unreported; not a causal or significance claim. |
| C13 | Forbes exhaustion: Millennials minus Baby Boomers | 80 − 70 = 10.0 percentage points | F16 Generation definitions and valid n not printed; not cohort aging or a time trend. |
| C14 | Pew overwhelmed by messages: women minus men | 54 − 25 = 29.0 percentage points | F25 July 2022 past-year users, at least sometimes; not diagnosed burnout. |
| C15 | Pew insecure about too few messages: men minus women | 64 − 40 = 24.0 percentage points | F26 Separate insecurity item, not the reverse of message overload; subgroup n unreported. |
| C16 | Pew often disappointed minus often excited | 36 − 17 = 19.0 percentage points | F31 Separate marginal emotions at the same often threshold; no individual overlap identified. |
| C17 | Pew at least sometimes disappointed minus excited | 88 − 79 = 9.0 percentage points | F31 Published NETs retained; not a count of people disappointed but never excited. |
| C18 | Hily full-profile review: women expectation minus own readiness | 67 − 54 = 13.0 percentage points | F45 Separate marginal answers in an app-user sample, not a count of individual inconsistency. |
| C19 | Hily full-profile review: men expectation minus own readiness | 61 − 49 = 12.0 percentage points | F45 Separate margins; exact subgroup n unavailable; not a causal explanation of fatigue. |
| C20 | Healthy Framework ever-needed-break minus any fatigue | 89.8 − 79.1 = 10.7 percentage points | F35 / F32 Different marginal questions; this does not identify who needed a break without fatigue. Fieldwork date not supplied. |
Common questions about dating burnout research
Is 78% the percentage of all adults with dating burnout?
No. It is Forbes Health’s reported share among surveyed US past-year app users feeling exhausted sometimes, often or always in March–April 2024. The sample and threshold must travel with the number. Original survey source.
Why do the 2026 codebook threshold percentages differ?
They combine different severity categories from the same question: completely is 15.9%, moderate-or-complete sums to 33.2%, and at-least-a-little to 55.9%. These are nested descriptive thresholds, not changes over time. Original survey source.
Why is the dating-break share 28.7% in one place and 41.4% in another?
The printed share uses all 4,952 codebook cases; the recalculated share uses 3,432 nonmissing responses. Both use the same selected count, 1,420. The denominator changes, not the behavior. Original survey source.
Does needing a break mean someone is burned out?
These surveys ask separate questions. Healthy Framework reports 89.8% ever needing a break and 79.1% ever feeling fatigue/burnout. Separate margins do not identify which individuals answered differently. Original survey source.
Do burnout studies prove dating apps cause mental-health problems?
The selected prevalence and opinion surveys do not establish causal effects. The accessible longitudinal abstract reports change and associations, but its design and reported associations do not justify treating every app user’s distress as an app-caused outcome. Original survey source.
Does reducing social media or taking an app break cure burnout?
The selected findings describe intentions and coping choices, rather than randomized treatment effects. Hily’s reduction plans should not be presented as observed improvements. Original survey source.
Methodology and limitations
Research scope and contribution
MyLittleDesire compiled 51 grouped findings and 151 numeric inputs from eight survey programs, alongside one academic abstract and one classification reference. It created four chart designs and 20 reproducible descriptive calculations. This is an editorial synthesis rather than original survey fieldwork, a systematic review or a pooled global prevalence estimate. Related response categories share a finding ID; 51 findings do not mean 51 studies.
Dates and edition
2027 is the editorial edition. Original documents were retrieved mainly November 1, 2026; the completed source, calculation and presentation review was November 2, 2026. Dated survey observations span July 2022 to September 2026. Healthy Framework’s fieldwork/publication date was not established, so it remains undated historical context. Forbes’s current page date is 2025 while its survey dates are 2024. No observations are presented as collected in 2027.
How original evidence was verified
We inspected original releases, methodology, selected tables in the 344-page Kinsey codebook, Pew’s full report/topline and the Real Insurance whitepaper. Pew’s emotion chart and Real Insurance’s relevant charts were visually checked because extracted text can misread digits and footnotes. Some original pages were readable through public research retrieval after direct requests returned placeholders or errors. Only selected questions were audited, not every item or respondent-level record.
Sampling and generalization
Kinsey explicitly describes opt-in panels, with demographic balancing rather than probability recruitment. Forbes, Healthy Framework, Hily and sponsor releases have varying disclosure. Pew describes probability-based panels and weighting. Hily covers its own Gen Z users, CMB a restricted 21–35 professional group, and the UK sponsor survey active singles. Sampling contractors overlap across reports. None of these differences is erased to manufacture a country ranking or a single all-adult burnout rate.
Thresholds and denominators
Q84 thresholds sum the printed rounded category shares; they are nested, not independent groups or diagnostic cutoffs. For Q85, selected and not-selected counts sum to 3,432 while the table includes 1,520 system-missing cases in all-case percentages. We label valid-response calculations explicitly and do not reconstruct unverified routing. Real Insurance’s dating-difficulty question uses n=705 who tried dating, rather than all 1,204 adults. Published Pew NETs are retained despite rounded components.
Missing information and uncertainty
Missing fieldwork dates, item/subgroup n, confidence intervals, standard errors and standard deviations remain unavailable rather than zero or imputed. We did not assign an overall advertised margin to every subgroup or treat it as proof of probability sampling. Commercial sponsorship and narrower populations remain visible. Descriptive differences are not new significance tests or evidence about individual overlaps.
Conflict and exclusion handling
Healthy Framework’s older-group help-seeking narrative/table disagreement is excluded. Its alcohol-or-drugs total cannot be established by adding overlapping selections. Conflicting secondary SIA 2025 claims and the inaccessible Choosi full report were not used. The exclusions inventory records 46 holdouts, including unmeasured SEO metrics and unsupported interpretations. The original sources remain the place to verify underlying research.
Academic evidence and clinical terminology
The accessible Sharabi, Von Feldt and Ha abstract describes 493 active single app users across four waves over 12 weeks, with 190 at the final wave, and reports increasing exhaustion and inefficacy. The paper first appeared online in October 2024 and entered a January 2026 issue. We did not verify its full effect tables or fieldwork dates, derive a prevalence from retention or infer causation. WHO’s occupational classification is context, not validation of a clinical dating-burnout threshold.
How the hub should be updated
Review original question wording, dates, eligibility and tables before replacing findings. Update every affected input, calculation, chart and sentence together. Preserve useful historical years, record substantive changes and keep the evergreen URL. Reports of coping choices or planned changes should not become claims of proven cures. No guaranteed backlink, ranking or AI citation is claimed.
Related MyLittleDesire research
Online Dating and Dating App Statistics covers adoption and platform experiences. Singles and Singlehood Statistics covers relationship status and single life. Ghosting Statistics covers contact-ending definitions and prevalence. Loneliness Statistics covers a separate social-connection construct. This hub focuses on fatigue, thresholds, response bases and coping questions.
Complete original-source bibliography
- S01 · Match / Kinsey Institute. Singles in America 2026: public codebook.
Role: Survey findings
Published University release 2026-09-14; Match release 2026-09-10. Data period: March–April 2026.
Population: Study-defined single adults 18+; codebook frequency tables n=4,952
Method: National online opt-in panels, demographically balanced; not a probability sample and not recruited from Match customers. Relevant Q26, Q84 and Q85 tables in the 344-page public codebook were inspected. Codebook percentages are frequency-table shares; no separate weighting adjustment was applied by MyLittleDesire.
Limits: Commercial funding. Survey-defined burnout is not a diagnosis. Q85 prints shares against all 4,952 cases, including 1,520 system-missing; selected plus unselected counts yield 3,432 nonmissing responses. Routing logic was not independently reconstructed. Rounded category sums are descriptive, with no new significance tests.
Supporting document 1 · Supporting document 2 · Supporting document 3
Source review completed November 2, 2026. - S02 · Forbes Health / OnePoll. Forbes Health Survey: 78% Of All Users Report Dating App Burnout.
Role: Survey findings
Published Current page displays 2025-07-25. Data period: 2024-03-27 to 2024-04-01.
Population: Adults who used a dating app in the prior year
Method: Commissioned online OnePoll survey. Original article and methodology read. Exhaustion frequency includes sometimes, often or always. The publisher reports an overall ±3.1-point margin; probability recruitment was not established.
Limits: Commercial affiliate publisher. No raw questionnaire/topline, subgroup n or generation cutoffs verified. Do not apply the stated margin to every estimate or treat it as proof of probability sampling. 2025 page date does not make this 2025/2027 fieldwork.
Source review completed November 2, 2026. - S03 · Pew Research Center. From Looking for Love to Swiping the Field: experiences of U.S. online daters.
Role: Survey findings
Published 2023-02-02. Data period: 2022-07-05 to 2022-07-17.
Population: Adults; ever-user base n=3,128; past-year app/site-user emotion base n=951
Method: Weighted probability-based American Trends Panel and Ipsos KnowledgePanel LGB oversample. Original full report and topline inspected; full report printed pp.28–34, emotion chart p.33, topline ONDEMOT n=951.
Limits: Historical emotions and overall experience are not direct burnout prevalence. Gender, sexual-orientation and paid-user subgroup valid n not printed beside selected estimates. Use published NETs; rounded components may not sum to NET. No individual emotion overlap or causation inferred.
Supporting document 1 · Supporting document 2 - S04 · Healthy Framework. Online Dating Burnout and Emotional Fatigue Data.
Role: Survey findings
Published Undated original page; publication date not independently established. Data period: Not stated on the readable original page.
Population: Single adults 18–54 who used a dating app in prior 12 months
Method: Online survey with equal quota cells: four age groups, n=250 each, and equal men/women, n=500 each; each age/gender cell n=125. Original questions and published tables read through accessible original web retrieval after direct HTTP 403.
Limits: Recruitment, weighting and fieldwork dates not supplied; quota distribution is not a national age distribution. Lifetime-style ever questions differ from past-year frequency. Source narrative/table conflict for older-group help seeking and invalid alcohol/drug union are withheld. Historical/undated context, not a new current national rate.. - S05 · Hily. 2026 Dating T.R.U.T.H. Report.
Role: Survey findings
Published 2026-01-29. Data period: December 2025; retrospective dating questions refer to 2025.
Population: Gen Z Hily daters; exact age bounds and gender/item bases not supplied
Method: Original release describes over 3,000 Gen Z Hily daters surveyed by the company research team. Original question summaries, gender values and methods read through accessible original web retrieval after direct local response was Site Unavailable.
Limits: Self-selected service population, not all Gen Z or U.S. singles. Exact n, recruitment, weighting, generation ages and item-valid bases unavailable. Peer/social-media effects are self-attributions. Separate marginal questions cannot identify individual double standards or causal effects. - S06 · Alfa Romeo / OnePoll. Research reveals dating app fatigue among 60% of daters.
Role: Survey findings
Published 2026-10-08. Data period: September 2026.
Population: UK single people actively dating; exact age eligibility not stated
Method: Original sponsor release identifies OnePoll, n=1,000 and September 2026. Selected fatigue and preference statements read.
Limits: Car-brand promotion; complete fatigue question, frequency threshold, weighting and item-valid n not supplied. Preference to meet naturally is not actual app deletion or proof of a remedy. Do not call this a nationally representative burnout diagnosis. - S07 · Real Insurance / MYMAVINS. Real Relationships Report 2025.
Role: Survey findings
Published 2025-11-20 webpage. Data period: 2025-08-13 to 2025-08-18.
Population: Australian adults; subgroup valid bases not printed beside selected findings
Method: Original 35-page report and four-page release inspected; methods p.3 and digital fatigue p.33. Online demographic sample described as broadly representative across age, gender, wealth and location; probability recruitment not established.
Limits: Digital fatigue includes group chats, messages and social-media groups as well as dating apps; it is not dating-only burnout. Dating-harder is a perception, not clinical fatigue. Missing subgroup n/uncertainty remains unavailable.
Supporting document 1 · Supporting document 2 - S08 · Coffee Meets Bagel / YouGov. Dating Realness Report: Australian dating-app challenges.
Role: Survey findings
Published Page 2026-02-12; release text dated 2026-02-02. Data period: November 2025.
Population: Working professionals 21–35 actively seeking a relationship or open to one
Method: Original sponsor release and About the Report methods read through original web retrieval after local Site Unavailable. Survey in partnership with YouGov.
Limits: Restricted young-professional population. Complete questionnaire, item routing and weighting not established. The 91% challenges finding is not 91% burnout; the listed 38% mental-fatigue item lacks an explicit valid denominator in the release.
Source review completed November 2, 2026. - S09 · Sharabi, Von Feldt and Ha / New Media & Society. Burnt out and still single: Susceptibility to dating app burnout over time.
Role: Academic context; excluded from numeric finding count
Published First online 2024-10-19; January 2026 issue, 28(1), pp.169–190. Data period: Fieldwork dates not established from accessible abstract.
Population: 493 active single dating-app users initially, 190 at final wave
Method: Accessible original journal abstract and author-university record checked: four waves over 12 weeks; multilevel growth models reported increases in exhaustion and inefficacy.
Limits: Abstract-level evidence only, not a full-table audit or respondent-level reanalysis. Final n=190 is retention, not the number burned out. No effect sizes, uncertainty, national prevalence, arm counts or causal effects imputed.
Supporting document 1
Source review completed November 2, 2026. - S10 · World Health Organization. Burn-out an occupational phenomenon: ICD-11 clarification.
Role: Definition context; excluded from numeric finding count
Published FAQ undated; linked clarification 2019-05-28. Data period: Classification guidance; no survey.
Population: Not a dating survey
Method: Original WHO FAQ read. ICD-11 burnout concerns the occupational context and is not classified as a medical condition.
Limits: This classification does not validate a dating-burnout diagnostic category or threshold. The article reports study-specific survey definitions.
Supporting document 1
How to cite this resource
MyLittleDesire. Dating Burnout Statistics 2027. https://mylittledesire.com/dating-burnout-statistics/. Accessed